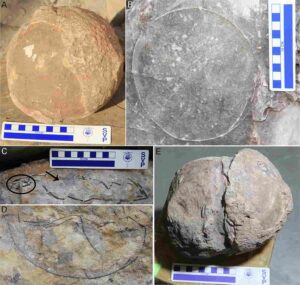
(A) Completely unhatched egg from the clutch P43. (B) Almost fully intact circular outline of egg possibly indicating it to be unhatched and no loose eggshells are found in the clutch P6. (C) Compressed egg from clutch DR10 showing hatching window (arrow showing gap) and few eggshells collected just around the hatching window (circled) which possibly represent the remnants of hatching window. (D) Egg from clutch P26 showing curved outline. (E) Deformed egg from clutch P30 showing egg surfaces slipping past each other. Credit: Dhiman et al., 2023, PLOS ONE, CC-BY 4.0 (creativecommons.org/licenses/by/4.0/)
The discovery of more than 250 fossilized eggs reveals intimate details about the lives of titanosaurs in the Indian subcontinent, according to a study published January 18, 2022 in the open-access journal PLOS ONE by Harsha Dhiman of the University of Delhi, New Delhi and colleagues.
The Lameta Formation, located in the Narmada Valley of central India, is well-known for fossils of dinosaur skeletons and eggs of the Late Cretaceous Period. Recent work in the area uncovered 92 nesting sites containing a total of 256 fossil eggs belonging to titanosaurs, which were among the largest dinosaurs to have ever lived. Detailed examination of these nests has allowed Dhiman and colleagues to make inferences about the life habits of these dinosaurs.
The authors identified six different egg-species (oospecies), suggesting a higher diversity of titanosaurs than is represented by skeletal remains from this region. Based on the layout of the nests, the team inferred that these dinosaurs buried their eggs in shallow pits like modern-day crocodiles. Certain pathologies found in the eggs, such as a rare case of an “egg-in-egg,” indicate that titanosaur sauropods had a reproductive physiology that parallels that of birds and possibly laid their eggs in a sequential manner as seen in modern birds. The presence of many nests in the same area suggests these dinosaurs exhibited colonial nesting behavior like many modern birds. But the close spacing of the nests left little room for adult dinosaurs, supporting the idea that adults left the hatchlings (newborns) to fend for themselves.
Details of dinosaur reproductive habits can be difficult to determine. These fossil nests provide a wealth of data about some of the largest dinosaurs in history, and they come from a time shortly before the age of dinosaurs came to an end. The insights gleaned from this study contribute significantly to paleontologists’ understanding of how dinosaurs lived and evolved.
Harsha Dhiman, lead author of the research, adds: “Our research has revealed the presence of an extensive hatchery of titanosaur sauropod dinosaurs in the study area and offers new insights into the conditions of nest preservation and reproductive strategies of titanosaur sauropod dinosaurs just before they went extinct.”
Guntupalli V.R. Prasad, co-author and leader of the research team, adds: “Together with dinosaur nests from Jabalpur in the upper Narmada valley in the east and those from Balasinor in the west, the new nesting sites from Dhar District in Madhya Pradesh (Central India), covering an east-west stretch of about 1000 km, constitute one of the largest dinosaur hatcheries in the world.”
Reference:
Harsha Dhiman et al, New Late Cretaceous titanosaur sauropod dinosaur egg clutches from lower Narmada valley, India: Palaeobiology and taphonomy, PLoS ONE (2023). DOI: 10.1371/journal.pone.0278242
Nearly 100 million years ago, the Earth experienced an extreme environmental disruption that choked oxygen from the oceans and led to elevated marine extinction levels that affected the entire globe.
Now, in a pair of complementary new studies, two Northwestern University-led teams of geoscientists report new findings on the chronology and character of events that led to this occurrence, known as Ocean Anoxic Event 2 (OAE2), which was co-discovered more than 40 years ago by late Northwestern professor Seymour Schlanger.
By studying preserved planktonic microfossils and bulk sediment extracted from three sites around the world, the team collected direct evidence indicating that ocean acidification occurred during the earliest stages of the event, due to carbon dioxide (CO2) emissions from the eruption of massive volcanic complexes on the sea floor.
In one of the new studies, the researchers also propose a new hypothesis to explain why ocean acidification led to a strange blip of cooler temperatures (dubbed the “Plenus Cold Event”), which briefly interrupted the otherwise intensely hot greenhouse period.
By analyzing how an influx of CO2 from volcanoes affected ocean chemistry, biomineralization and climate, the researchers hope to better understand how today’s Earth is responding to an increase of CO2 due to human activities, which potentially could lead to solutions for adapting to and mitigating anticipated consequences.
A paper, with findings from deep-sea cores, including a newly drilled site near southwest Australia, will be published on Thursday (Jan. 19) in the journal Nature Geoscience. A complementary paper detailing findings from ancient malformed microfossils was published on Dec. 13, in the Nature journal Communications Earth & Environment.
“Ocean acidification and anoxia resulted from massive CO2 release from volcanoes,” said Northwestern’s Brad Sageman, a senior co-author of both studies. “These major CO2 emission events in Earth’s history provide the best examples we have of how the Earth system responds to very large inputs of CO2. This work has fundamental applicability to our understanding of the climate system, and our ability to predict what will happen in the future.”
“Based on isotopic analyses of the element calcium, we propose a possible explanation for the Plenus Cold Event, which is that a slowdown in biocalcification rates due to ocean acidification allowed alkalinity to accumulate in seawater,” said Northwestern’s Andrew Jacobson, a senior co-author of both studies. “Increased alkalinity led to a drawdown of CO2 from the atmosphere. It could very well be the case that such cooling is a predictable—but transitory—consequence of warming. Our results for OAE2 provide a geological analog for ocean alkalinity enhancement, which is a leading strategy for mitigating the anthropogenic climate crisis.”
Experts on climate during the Cretaceous Period and isotope geochemistry, Sageman and Jacobson are both professors of Earth and planetary sciences in Northwestern’s Weinberg College of Arts and Sciences. The two studies were led by their former Ph.D. students, Gabriella Kitch and Matthew M. Jones, who initiated this research while at Northwestern.
Reconstructing Cretaceous conditions
Based on over 40 years of study, OAE2 is one of the most significant perturbations of the global carbon cycle to have occurred on planet Earth. Researchers have hypothesized that oxygen levels in the oceans dropped so low during OAE2 that marine extinction rates increased significantly. To better understand this event and the conditions leading up to it, the researchers studied ancient organic carbon-rich and fossil-bearing layers of sedimentary rock in widely distributed outcrop sites, as well as deep-sea cores obtained by the International Ocean Discovery Program (IODP).
The sites included Gubbio, Italy (a famous area in mainland Italy that used to be a deep ocean basin), the Western Interior Seaway (an ancient seabed stretching from the Gulf of Mexico to the Arctic Ocean in North America) and a several deep-sea sites, including a new one from the eastern Indian Ocean, offshore of southwest Australia.
Deep-sea cores provide an invaluable record of conditions in parts of the paleo-oceans that were completely unknown prior to the development of ocean drilling programs. In all three cores, the researchers focused on sections from the mid-Cretaceous Period, just before the boundary of the Turonian and Cenomanian Ages, in order to reconstruct conditions leading up to OAE2.
“The challenging part of studying ocean acidification in the geologic past is that we don’t have ancient seawater,” said Jones, who is now a Peter Buck Postdoctoral Fellow at the Smithsonian Institution. “It’s extremely rare that you would find anything that resembles ancient seawater trapped in a rock or mineral. So, we have to look for indirect evidence, particularly changes in the chemistry of fossil shells and lithified sediments.”
Malformed fossils
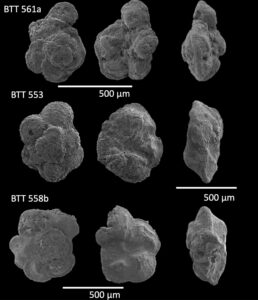
For the study published in Communications Earth & Environment, Kitch and her co-authors focused on fossilized foraminifera, ocean-dwelling unicellular organisms with an external shell made of calcium carbonate, which were collected at the Gubbio site by an Italian collaborator, Professor Rodolfo Coccioni at the University of Urbino.
Kitch and her collaborators were drawn to the Gubbio specimens because Coccioni’s optical observations and measurements of their shells showed abnormalities, including a consistent pattern of “dwarfing,” or a decrease in overall size, coincident with the onset of OAE2.
“These are optical signs of stress,” said Kitch, who is now a Knauss Fellow at the National Oceanic and Atmospheric Administration. “We hypothesized that the stress could have been caused by ocean acidification, which then affected the way the organisms built their shells.”
To test this hypothesis, Kitch analyzed the calcium isotope composition of the fossils. After dissolving the fossilized shells and analyzing their composition with a thermal ionization mass spectrometer, the Northwestern team observed that calcium isotope ratios shifted in the malformed specimens in a way consistent with stress from acidification.
“This is the first paper to marry calcium isotopic evidence for acidification with observations of biological indicators of stress,” Sageman said. “It’s these independent biological and geochemical observations that confirm there was an impact on biomineralization during the onset of OAE2.”
‘Cause-and-effect relationship’
For the second study, published in Nature Geoscience, Jones and his co-authors focused on deep sea cores of lithified sediments from offshore southwest Australia, which he and colleagues collected during an IODP expedition in 2017. For this piece of the puzzle, the researchers were less interested in what was in the sediment and more interested in what the sediment was noticeably lacking.
The core contains stacks of limestone, rich with calcium carbonate minerals, but is punctuated by a sudden absence of carbonate right before OAE2.
“For this time interval, we found that calcite is absent,” Jones said. “There are no carbonate minerals. This section of the core is visibly darker; it jumped right out at us. The carbonate either dissolved at the seafloor or fewer organisms were making calcium carbonate shells in the surface water. It’s a direct observation of an ocean acidification event.”
In his geochemical analyses conducted in collaboration with Professor Dave Selby at Durham University, Jones noticed that carbonate was not the only component showing significant change. Coincident with the onset of OAE2, there is also a marked shift in osmium isotope ratios that signal a massive input of mantle-derived osmium, the fingerprint of a major submarine volcanism event. This observation is consistent with the work of many other researchers, who have found evidence for the eruption of a large igneous province (LIP) preceding OAE2.
These events of massive volcanic activity occur throughout Earth history and are increasingly recognized as major agents of global change. Many LIPs were submarine, injecting tons of CO2 directly into the oceans. When CO2 dissolves into seawater, it forms a weak acid that can inhibit calcium carbonate formation and may even dissolve preexisting carbonate shells and sediments.
“Right at the onset of OAE2, osmium isotope ratios shift to really, really low values,” Jones said. “The only way that can happen is through a large igneous province eruption. That helps us establish a cause-and-effect relationship. We can see the evidence that volcanoes were really active because the osmium values crash. Then, suddenly, there’s no carbonate.”
Biological feedback
While ocean acidification following a LIP is not necessarily surprising, the Northwestern team did uncover something unusual. Acidic conditions during OAE2 lasted much longer than other widely recognized acidification events in the ancient world. Jones posits that the lack of oxygen in ocean waters may have extended the acidification state.
“Organisms that consumed sinking plankton and organic matter in the water column during OAE2 were also respiring CO2, which contributed to the ocean acidification that was initially triggered by CO2 emission from LIP volcanic activity,” Jones said. “So, marine anoxia can be a ‘positive feedback’ on ocean acidification. That’s important because the global ocean today, in addition to having its pH levels decrease, is losing oxygen content as well. That suggests that decreases in oxygen may prolong acidification and highlights that the two phenomena are closely related.”
In Kitch’s study, she found that biology played yet another role during the event. Global warming and ocean acidification did not just passively affect foraminifera. The organisms also actively responded by reducing calcification rates when building their shells. As calcification slowed, the foraminifera consumed less alkalinity from seawater, which helped buffer the ocean’s increasing acidity. This also heightened the ocean’s ability to absorb CO2, potentially triggering the Plenus Cold Event.
“We call this phase a ‘hothouse period’ because temperatures were really, really warm,” Kitch said. “However, there is evidence for relative cooling during the OAE2 interval. No one has been able to explain why this cooling happened. Our study shows that by decreasing carbonate production in the ocean, you actually bump up alkalinity, which gives the ocean a buffering capacity to absorb CO2. The ocean suddenly has the capacity to draw down CO2 and balance carbon fluxes.”
Stabilization ‘comes with a cost’
But just because brief cooling interrupted this otherwise hothouse period, the researchers caution that the oceans’ natural ability to buffer CO2 is not the answer to current human-caused climate change. Sageman explains the scenario by comparing climate change to cancer.
“It’s like if a patient had cancer, and the cancer went away for a month,” Sageman said. “But then it came back and killed the patient. Don’t get fooled into thinking the ocean will cool us off and everything will be OK. It was cool for a tiny sliver of time.”
“Although the Earth rebounded and healed itself, extinctions in the marine realm helped achieve that,” Jacobson added. “The Earth has some stabilizing feedbacks, but they come with a cost.”
Reference:
Matthew Jones, Abrupt episode of mid-Cretaceous ocean acidification triggered by massive volcanism, Nature Geoscience (2023). DOI: 10.1038/s41561-022-01115-w. www.nature.com/articles/s41561-022-01115-w
Gabriella D. Kitch et al, Calcium isotope ratios of malformed foraminifera reveal biocalcification stress preceded Oceanic Anoxic Event 2, Communications Earth & Environment (2022). DOI: 10.1038/s43247-022-00641-0
Note: The above post is reprinted from materials provided by Northwestern University.
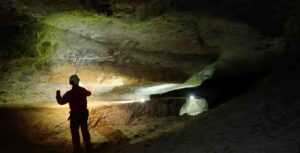
Dimitri Laurent explores a typical gallery in the Nébélé Cave, which was formed by sulfuric acid speleogenesis. You can see a deep notch that indicates the former presence of a river, and sodium sulfate on the left that is produced from weathering by sulfuric acid. Credit: Christophe Durlet
A study published in the journal Geology uses isotopes of sulfur to fingerprint the sources of sulfuric acid that have carved unique and beautiful cave systems in the Pyrenees mountains of southern France.
Networks of caves form when carbonate rocks like limestone dissolve. These are also known as karsts. In most caves, water has trickled down through Earth’s surface, picking up carbon dioxide and becoming slightly acidic along the way; this is the same type of mild carbonic acid that you’ll find in a can of soda that has carbon dioxide dissolved in it.
A rarer type of cave forms from transport of fluids up through the crust and through fault zones, forming vertical caves that can connect with horizontal caverns, forming large networks. In some cases, when sulfur is present, sulfuric acid forms and acts to dissolve limestone much faster—forming caves 10–100 times faster than its carbonic acid counterparts.
When sulfur compounds are present in water or in the minerals in the cave walls, chemical-loving bacteria use the sulfate as an energy source, producing hydrogen sulfide as a by-product. Oxidation of this hydrogen sulfide then forms sulfuric acid. Sulfuric acid can also come from hydrothermal springs or from minerals within the rock, and both are true in the northern Pyrenees.
Sulfur comes in four different isotopes—each weighing a slightly different amount. Researchers were able to estimate the relative contributions of sulfuric acid from different sources by using these isotopes as a marker of where the sulfur originated.
The large network of limestone caves in the foothills of the French Pyrenees mountains was formed by a combination of acid-forming processes that left their imprint on the minerals left behind. Sulfur-containing minerals like gypsum and mirabilite in the caves hinted that sulfuric acid was involved in their formation. Mirabilite is a rare mineral that forms long, thin crystals up to 50 cm in length that radiate out like flowers.
For the first time, researchers studying limestone caves carved out by sulfuric acid have estimated how much of the cave-forming acid was produced by bacteria within the cave versus how much was produced by thermochemical processes. This innovation in separating the various sources of limestone dissolution has also allowed them to make the first estimate of how much carbon dioxide was emitted by the formation of the caves.
Dimitri Laurent, lead author of this study, explains, “We tried to identify hydrothermal springs close to measured faults, and then we contacted the local speleological clubs to visit the caves near the springs. We see that at depth in the Northern Pyrenees, in the northern foothills, there are Triassic evaporites that produced hydrogen sulfide through thermochemical processes 65 million years ago.”
That hydrogen sulfide then traveled through fractures in the rock and has been trapped within the cave host rock since then. As water began to dissolve this sulfur-rich rock, the fossil hydrogen sulfide was liberated and oxidized to form sulfuric acid. The Triassic evaporites have also delivered sulfates to the caves more recently, via deep hydrothermal fluids, which are then used by bacteria within the cave.
Combining chemistry with physical observations of the landscape, the researchers reconstructed the history of how these spectacular caves came to be.
Reference:
D. Laurent et al, Unravelling biotic versus abiotic processes in the development of large sulfuric-acid karsts, Geology (2023). DOI: 10.1130/G50658.1
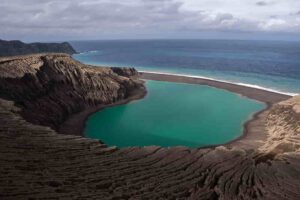
A view from the summit of Hunga Tonga-Hunga Ha’apai in 2017 (CC BY-SA 4.0 Damien Grouille/Wikimedia Commons)
A new analysis of seismic data recorded after the massively violent eruption of the underwater volcano Hunga Tonga-Hunga Ha’apai, on January 15, 2022, has revealed new and useful information on the sequence of events. Kotaro Tarumi and Kazunori Yoshizawa at Hokkaido University discuss their methods and findings in an article in Earth and Planetary Science Letters.
“We showed that the eruption consisted of two distinct sequences of events, some of which occurred quasi-periodically in the first sequence. It will be worthwhile to investigate the mechanisms involved in such eruption cycles further,” says seismologist and geophysicist Yoshizawa.
The volcano generated seismic, tsunami and atmospheric waves that were recorded worldwide. Recent studies have estimated that it was one of the most energetic eruptions recorded by modern instruments.
“Eruption episodes are difficult to analyze fully from seismic surface waves, but we have teased out more details using what are called teleseismic-P waves,” says Ph.D. student Tarumi. These are seismic waves that have traveled through the planet to locations distant from the eruption site. In this case, the team used seismic data collected from sites as far as at a 93-degree angle around the circumference of the planet.
The team’s “back-projection” analysis successfully detected the locations and timing of multiple explosions, even though P-waves from each eruption overlapped and were masked by other seismic signals and noises.
The back-projection technique reverses the transmission of seismic signals to reveal details of a potential source that radiated seismic waves. It was originally developed and applied for imaging the source processes of large earthquakes, but is now proving equally applicable to large scale volcanic events.
The results revealed that the sequence of eruptions occurred in two main parts. The first sequence began at 04:02 UTC on January 15, then escalated into major explosions at 04:15 UTC and 200 to 300 seconds after. The entire sequence lasted at least until 04:35 UTC.
A second sequence of eruptions began about four hours later and continued from six to seven minutes, including a massive eruption at 08:31. Satellite imagery recorded the resulting dramatic ash cloud from the first eruption sequence, but until now the precise details of the underwater events have remained elusive.
One interesting finding was that significant explosive eruptions intermittently occurred at 270 to 280 second intervals, a frequency suggesting a resonance effect with the atmosphere and the Earth. “This apparent agreement of the eruption cycle and the atmospheric resonant oscillation with the Earth could be coincidental, but it certainly deserves further exploration,” Yoshizawa concludes.
Reference:
Kotaro Tarumi et al, Eruption sequence of the 2022 Hunga Tonga-Hunga Ha’apai explosion from back-projection of teleseismic P waves, Earth and Planetary Science Letters (2023). DOI: 10.1016/j.epsl.2022.117966
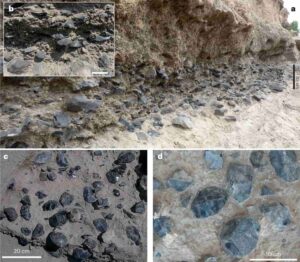
The extensive accumulations of obsidian artefacts in level C. a,b, General view of the level and detail of artefact density along the MS cliff (a) and inset (b). c,d, General view (c) and detail (d) of the artefact concentration (mainly handaxes) in the test pit of 2004. Credit: Nature Ecology & Evolution (2023). DOI: 10.1038/s41559-022-01970-1
A team of researchers affiliated with several institutions in Spain, working with two colleagues from France and another from Germany has discovered an Obsidian handaxe-making workshop from 1.2 million years ago in the Awash valley in Ethiopia. In their paper published in the journal Nature Ecology & Evolution, the group describes where the handaxes were found, their condition and their age.
The Stone Age lasted from approximately 2.6 million years ago, to approximately 3,300 BCE, when the Bronze Age began. Historians generally break the era down into the Paleolithic, Mesolithic and Neolithic periods. Prior research has shown that “knapping workshops” appeared sometime during the Middle Pleistocene, in Europe—approximately 774,000 to 129,000 years ago.
Such workshops developed as tool-making evolved into a skill. Individuals who developed such skills worked together in workshops to crank out enough of whatever tools were needed by those in the general area. One such tool was the handaxe, which could be used for chopping or as a weapon.
Handaxes were made by chipping bits off of a stone to make a sharp edge. They were not attached to anything; they were simply held in the hand when in use. The stones used were typically flint or, in latter times, obsidian—a type of volcanic glass. Obsidian, even in modern times, is considered a difficult material to work with because it is so rough on the hands. In this new effort the researchers have found evidence of an obsidian handaxe knapping workshop established far earlier than one has ever been seen before.
The researchers were working at the Melka Kunture dig site when they found a handaxe buried in a layer of sediment. They soon found more. They found 578 in all, and all but three were made of obsidian. Dating of the material around the axes showed them to be from approximately 1.2 million years ago.
Study of the axes showed them all to have been crafted in like manner, indicating that the researchers had found an ancient knapping workshop. The find marks the oldest known example of such a workshop, and the first of its kind not in Europe. The researchers note that the work was done so long ago that they are not even able to identify the hominids that made them.
Reference:
Margherita Mussi et al, A surge in obsidian exploitation more than 1.2 million years ago at Simbiro III (Melka Kunture, Upper Awash, Ethiopia), Nature Ecology & Evolution (2023). DOI: 10.1038/s41559-022-01970-1
Note: The above post is reprinted from materials provided by Science X Network.
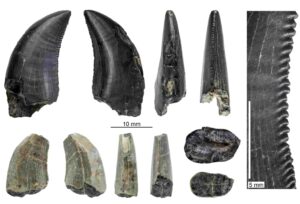
A figure from the study showing teeth from a megaraptor dinosaur from various view points. The black tooth preserves most of the tooth crow. The tan tooth is missing the crown apex and base. Credit: Davis et al.
A study led by The University of Texas at Austin is providing a glimpse into dinosaur and bird diversity in Patagonia during the Late Cretaceous, just before the non-avian dinosaurs went extinct.
The fossils represent the first record of theropods — a dinosaur group that includes both modern birds and their closest non-avian dinosaur relatives — from the Chilean portion of Patagonia. The researchers’ finds include giant megaraptors with large sickle-like claws and birds from the group that also includes today’s moA study is providing a glimpse into dinosaur and bird diversity in Patagonia during the Late Cretaceous, just before the non-avian dinosaurs went extinct.dern species.
“The fauna of Patagonia leading up to the mass extinction was really diverse,” said lead author Sarah Davis, who completed this work as part of her doctoral studies with Professor Julia Clarke at the UT Jackson School of Geosciences Department of Geological Sciences. “You’ve got your large theropod carnivores and smaller carnivores as well as these bird groups coexisting alongside other reptiles and small mammals.”
The study was published in the Journal of South American Earth Sciences.
Since 2017, members of the Clarke lab, including graduate and undergraduate students, have joined scientific collaborators from Chile in Patagonia to collect fossils and build a record of ancient life from the region. Over the years, researchers have found abundant plant and animal fossils from before the asteroid strike that killed off the dinosaurs.
The study focuses specifically on theropods, with the fossils dating from 66 to 75 million years ago.
Non-avian theropod dinosaurs were mostly carnivorous, and include the top predators in the food chain. This study shows that in prehistoric Patagonia, these predators included dinosaurs from two groups — megaraptors and unenlagiines.
Reaching over 25 feet long, megaraptors were among the larger theropod dinosaurs in South America during the Late Cretaceous. The unenlagiines — a group with members that ranged from chicken-sized to over 10 feet tall — were probably covered with feathers, just like their close relative the velociraptor. The unenlagiinae fossils described in the study are the southernmost known instance of this dinosaur group.
The bird fossils were also from two groups — enantiornithines and ornithurines. Although now extinct, enantiornithines were the most diverse and abundant birds millions of years ago. These resembled sparrows — but with beaks lined with teeth. The group ornithurae includes all modern birds living today. The ones living in ancient Patagonia may have resembled a goose or duck, though the fossils are too fragmentary to tell for sure.
The researchers identified the theropods from small fossil fragments; the dinosaurs mostly from teeth and toes, the birds from small bone pieces. Davis said that the enamel glinting on the dinosaur teeth helped with spotting them among the rocky terrain.
Some researchers have suggested that the Southern Hemisphere faced less extreme or more gradual climatic changes than the Northern Hemisphere after the asteroid strike. This may have made Patagonia, and other places in the Southern Hemisphere, a refuge for birds and mammals and other life that survived the extinction. Davis said that this study can aid in investigating this theory by building up a record of ancient life before and after the extinction event.
Study co-author Marcelo Leppe, the director of the Antarctic Institute of Chile, said that these past records are key to understanding life as it exists today.
“We still need to know how life made its way in that apocalyptic scenario and gave rise to our southern environments in South America, New Zealand and Australia,” he said. “Here theropods are still present — no longer as dinosaurs as imposing as megaraptorids — but as the diverse array of birds found in the forests, swamps and marshes of Patagonia, and in Antarctica and Australia.”
The research was funded by the National Science Foundation, the National Agency for Research and Development of Chile, and the Jackson School of Geosciences.
The study’s co-authors include Clarke and researchers at the University of Chile, Major University, the University of Concepción and the Chilean National Museum of Natural History.
Reference:
Sarah N. Davis, Sergio Soto-Acuña, Roy A. Fernández, Jared Amudeo-Plaza, Marcelo A. Leppe, David Rubilar-Rogers, Alexander O. Vargas, Julia A. Clarke. New records of Theropoda from a Late Cretaceous (Campanian-Maastrichtian) locality in the Magallanes-Austral Basin, Patagonia, and insights into end Cretaceous theropod diversity. Journal of South American Earth Sciences, 2023; 122: 104163 DOI: 10.1016/j.jsames.2022.104163
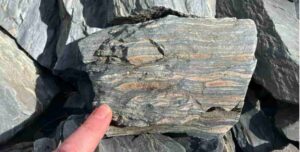
Boudinage in brecciated dolostone rocks of the Panamint Range (Wildrose Area, Death Valley National Park). New research shows that periclase is stronger than bridgmanite in earth’s lower mantle, analogous to boudins developing in rigid (“stronger”) rocks among less competent (“weaker”) rocks. Credit: Jennifer M. Jackson, Caltech
As you are reading this, more than 400 miles below you is a massive world of extreme temperatures and pressures that has been churning and evolving for longer than humans have been on the planet. Now, a detailed new model from Caltech researchers illustrates the surprising behavior of minerals deep in the planet’s interior over millions of years and shows that the processes are actually happening in a manner completely opposite to what had been previously theorized.
The research was conducted by an international team of scientists, including Jennifer M. Jackson, William E. Leonhard Professor of Mineral Physics. A paper describing the study appears in the journal Nature on January 11.
“Despite the enormous size of the planet, the deeper parts are often overlooked because they’re literally out of reach—we can’t sample them,” Jackson says. “Additionally, these processes are so slow they seem imperceptible to us. But the flow in the lower mantle communicates with everything it touches; it’s a deep engine that affects plate tectonics and may control volcanic activity.”
The lower mantle of the planet is solid rock, but over hundreds of millions of years it slowly oozes, like a thick caramel, carrying heat throughout the planet’s interior in a process called convection.
Many questions remain unanswered about the mechanisms that allow this convection to happen. The extreme temperatures and pressures at the lower mantle—up to 135 gigapascals and thousands of degrees Fahrenheit—make it difficult to simulate in the laboratory.
For reference, the pressure at the lower mantle is almost a thousand times the pressure at the deepest point of the ocean. Thus, while many lab experiments on mineral physics have provided hypotheses about the behavior of lower mantle rocks, the processes occurring at geologic timescales to drive the sluggish flow of lower-mantle convection have been uncertain.
The lower mantle is mostly made up of a magnesium silicate called bridgmanite yet also includes a small but significant amount of a magnesium oxide called periclase mixed in among the bridgmanite in addition to small amounts of other minerals. Laboratory experiments had previously shown that periclase is weaker than bridgmanite and deforms more easily, but these experiments did not take into account how minerals behave on a timescale of millions of years. When incorporating these timescales into a complex computational model, Jackson and colleagues found that grains of periclase are actually stronger than the bridgmanite surrounding them.
“We can use the analogy of boudinage in the rock record [image at right], where boudins, which is French for sausage, develop in a rigid, ‘stronger,’ rock layer among less competent, ‘weaker,’ rock,” Jackson says.
“As another analogy, think about chunky peanut butter,” Jackson explains. “We had thought for decades that periclase was the ‘oil’ in peanut butter, and acted as the lubricant between the harder grains of bridgmanite. Based on this new study, it turns out that periclase grains act as the ‘nuts’ in chunky peanut butter. Periclase grains just go with the flow but don’t affect the viscous behavior, except in circumstances when the grains are strongly concentrated. We show that under pressure, mobility is much slower in periclase compared to bridgmanite. There is an inversion of behavior: periclase hardly deforms, while the major phase, bridgmanite, controls deformation in Earth’s deep mantle.”
Understanding these extreme processes happening far below our feet is important for creating accurate four-dimensional simulations of our planet, and it helps us comprehend more about other planets as well. Thousands of exoplanets (planets outside of our solar system) have now been confirmed, and discovering more about mineral physics under extreme conditions gives new insights into the evolution of planets radically different from our own.
Reference:
Patrick Cordier et al, Periclase deforms more slowly than bridgmanite under mantle conditions, Nature (2023). DOI: 10.1038/s41586-022-05410-9
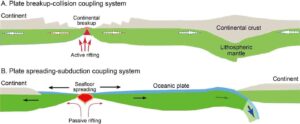
A. The lithospheric breakup-collision coupling system, in which collisional thickening of the continental crust is coupled with lithospheric breakup due to asthenospheric upwelling for active rifting. B. The seafloor spreading-lithospheric subduction coupling system, in which the oceanic slab is subducted to depths of >80–100 km for the gravitational pull, providing far-field stresses for passive rifting. Credit: Science China Press
The emergence of plate tectonics in the late 1960s led to a paradigm shift from fixism to mobilism of global tectonics, providing a unifying context for the previously disparate disciplines of Earth sciences. Although plate tectonics was originally defined by the kinematics of the Earth’s outer shell (lithosphere) on the underlying asthenosphere, a number of dynamic interpretations for its operation have developed in the past five decades.
This has advanced plate tectonics as a holistic theory of kinematics-dynamics for the motion of large and small plates in both horizontal and vertical directions. Because modern plate boundaries occur as a global network of mobile belts on the spherical Earth, the difficulty was encountered in deciphering the operation of ancient plate tectonics in geological history.
A synthetic study presented by Prof. Yong-Fei Zheng at University of Science and Technology of China and published in Science China Earth Sciences, focuses on an advanced version of plate tectonics in its basic principles and geological corollaries along active and fossil plate margins. This is achieved by inspection of natural observations and their tectonic interpretations in the fields of geology, geochemistry, geophysics and geodynamics.
The advances are significant and fundamental to our understanding of various phenomena at present and past plate margins, setting general standards to determine the spatiotemporal relationships between material movement, energy transfer, dynamic regime and geothermal gradient along plate margins. Therefore, they provide new insights not only into many first-order problems regarding tectonic occurrences in continental regions but also into the origin of hotspot magmatism in relation to the mantle plume hypothesis.
According to the geometric structure, dynamic regime and thermal state of plate margins, Zheng highlights the importance of plate divergent-convergent coupling systems in the operation of plate tectonics on Earth. These coupling systems are categorized into two types.
One is the lithospheric breakup-collision due to active rifting, with the push effect of lithospheric breakup on collisional thickening and shallow subduction to smaller depths of <60–80 km. The other is the seafloor spreading-lithospheric subduction due to passive rifting, with the pull effect of subducting oceanic slab on deep subduction to greater depths of >80–100 km. Because plates may be of different sizes since their generation, they may move in different directions to exchange matter and energy not only between lithosphere and asthenosphere but also between the crust and the mantle.
As generalized by Zheng, matter and energy transfers at plate margins proceed in bottom-up and top-down ways, respectively. They correspond to changes of not only their dynamic regime from extension to compression and from compression to extension but also their thermal state from hot to warm and from cold to warm. In the rifting zone, heat is preferentially transferred from the asthenosphere into the crust, resulting in heat loss from the Earth’s interior to exterior. In subduction zones, the cold lithosphere sinks into the hotter asthenosphere, leading to cooling of the Earth’s interior.
Therefore, both rifting and subduction zones are two basic sites for the matter and energy exchanges between the Earth’s spheres. As such, recognition of their geodynamic mechanisms and tectonic effects on the formation and evolution of plate margins is the key to advance plate tectonics.
Although modern plate tectonics is characterized by a global network of mobile belts on the present Earth, its operation on the ancient Earth history can be tested by inspection of plate divergent-convergent coupling systems. This is outlined by Zheng through characterizing two of the fundamental components in plate tectonics. One is the initiation of rifting zones, eventually forming new ocean basins, and the other is the initiation of subduction zones, recycling the crust into the mantle.
Subduction initiation and lithospheric rifting are the two key processes for the onset of plate tectonics. Their operation has great bearing on the structure, processes and geodynamics of plate margins. These elements also fundamentally explain the onset and operation of plate tectonics in Precambrian time.
Reference:
Yong-Fei Zheng, Plate tectonics in the twenty-first century, Science China Earth Sciences (2022). DOI: 10.1007/s11430-022-1011-9
Note: The above post is reprinted from materials provided by Science China Press.
Superdeep diamonds that originate hundreds of kilometers beneath Earth’s surface are like time capsules revealing how they were formed, thanks to unique combinations of minerals trapped inside the diamonds. Credit: University of Alberta
A unique combination of minerals trapped inside a “superdeep” diamond that originated hundreds of kilometers beneath Earth’s surface sheds new light on plate tectonics, the geological processes that give rise to mountains, oceans and continents.
One of the inclusions found in the diamond was a very pure example of the mineral olivine, a variety of which is more commonly known as the gemstone peridot. Most olivine found on Earth has some iron in it, so the purity of this olivine speaks to the unique conditions under which it was formed, according to an international study published last week in Nature.
The olivine’s purity, as well as some of the other minerals that were inclusions in this diamond, indicate a far deeper origin than usual for a diamond, between what’s called the transition zone and the lower mantle zone—420 kilometers to 660 kilometers beneath Earth’s surface. It also shows that the environment between these zones has an extremely variable oxygen content.
“To make this extreme composition [of olivine] and the overall mineral assemblage that we’ve got, the only way of doing that is to have a very deeply subducted oceanic plate or slab that goes down into the mantle, so you’re essentially pushing material from the surface of the Earth into the depths of the Earth,” says study co-author Graham Pearson, professor in the Department of Earth and Atmospheric Sciences and director of the Diamond Exploration and Research Training School.
“You get huge gradients in oxygen activity when you do that, and these big gradients are very conducive to driving extreme variations in composition of minerals,” he adds.
A crucial source of new knowledge
An understanding of these oxygen gradients helps explain how plate tectonics brings volatile elements back up into the mantle, and can also offer clues to how superdeep diamonds are formed—knowledge that can’t be gained any other way, according to Pearson.
“You can see oceanic slabs descending into the Earth in seismic images, but you don’t have any idea of the detailed structures they develop, or the mechanisms and chemistry going on in those slabs,” he says. “These diamonds provide a unique trace of that detailed chemical evolution as the slab’s going down.
“It’s amazing to document the buckling of these huge oceanic plates as they descend into the bowels of the Earth, by probing minerals that are tens of microns in size, trapped in diamonds.”
As we gain more insight into the movement of those slabs into the mantle, called subduction, we’re able to better understand plate tectonics, Pearson explains.
“Subduction drives the whole of plate tectonics. If you don’t understand the details of subduction, that limits your understanding of how plate tectonics work.”
Plate tectonics is responsible for the formation of everything from mountains to oceans to continents, and even has an influence on Earth’s climate. Advancing our understanding of plate tectonics could also help us better comprehend natural events like earthquakes and volcanic eruptions, Pearson notes.
Diamonds are a scientist’s best friend
Superdeep diamonds, which originate from depths of more than 300 kilometers below Earth’s surface, are a treasure trove of scientific information because diamonds are uniquely able to preserve information about where they’re formed, including many of the physical and chemical processes that occurred during their formation.
Most other minerals lose much of that information by the time they make their way to Earth’s surface, but as Pearson explains, diamonds act almost as time capsules.
“There are many things at the surface of the Earth that can only be explained by processes happening at deep depths,” says Pearson.
“If you want to explain things you see at the surface—whether it’s economic mineralization, surface uplift or subsidence phenomena related to oil-bearing basins—you need an understanding of the structure, mechanics and properties of the deep Earth. Diamond is uniquely able to bolster that understanding.”
Reference:
Fabrizio Nestola et al, Extreme redox variations in a superdeep diamond from a subducted slab, Nature (2023). DOI: 10.1038/s41586-022-05392-8
The Northwestern research team of seismologists and statisticians has developed an earthquake probability model that is more comprehensive and realistic than what is currently available.
Results of a new study by Northwestern University researchers will help earthquake scientists better deal with seismology’s most important problem: when to expect the next big earthquake on a fault.
Seismologists commonly assume that big earthquakes on faults are fairly regular and that the next quake will occur after approximately the same amount of time as between the previous two. Unfortunately, Earth often doesn’t work that way. Although earthquakes sometimes come sooner or later than expected, seismologists didn’t always have a way to describe this.
Now they do. The Northwestern research team of seismologists and statisticians has developed an earthquake probability model that is more comprehensive and realistic than what is currently available. Instead of just using the average time between past earthquakes to forecast the next one, the new model considers the specific order and timing of previous earthquakes. It helps explain the puzzling fact that earthquakes sometimes come in clusters—groups with relatively short times between them, separated by longer times without earthquakes.
“Considering the full earthquake history, rather than just the average over time and the time since the last one, will help us a lot in forecasting when future earthquakes will happen,” said Seth Stein, William Deering Professor of Earth and Planetary Sciences in the Weinberg College of Arts and Sciences.
“When you’re trying to figure out a team’s chances of winning a ball game, you don’t want to look only at the last game and the long-term average. Looking back over additional recent games can also be helpful. We now can do a similar thing for earthquakes.”
The study, titled “A More Realistic Earthquake Probability Model Using Long-Term Fault Memory,” was published recently in the Bulletin of the Seismological Society of America. Authors of the study are Stein, Northwestern professor Bruce D. Spencer and recent Ph.D. graduates James S. Neely and Leah Salditch. Stein is a faculty associate of Northwestern’s Institute for Policy Research (IPR), and Spencer is an IPR faculty fellow.
“Earthquakes behave like an unreliable bus,” said Neely, now at the University of Chicago. “The bus might be scheduled to arrive every 30 minutes, but sometimes it’s very late, other times it’s too early. Seismologists have assumed that even when a quake is late, the next one is no more likely to arrive early. Instead, in our model if it’s late, it’s now more likely to come soon. And the later the bus is, the sooner the next one will come after it.”
Traditional model and new model
The traditional model, used since a large earthquake in 1906 destroyed San Francisco, assumes that slow motions across the fault build up strain, all of which is released in a big earthquake. In other words, a fault has only short-term memory—it “remembers” only the last earthquake and has “forgotten” all the previous ones. This assumption goes into forecasting when future earthquakes will happen and then into hazard maps that predict the level of shaking for which earthquake-resistant buildings should be designed.
However, “Large earthquakes don’t occur like clockwork,” Neely said. “Sometimes we see several large earthquakes occur over relatively short time frames and then long periods when nothing happens. The traditional models can’t handle this behavior.”
In contrast, the new model assumes that earthquake faults are smarter—have longer-term memory—than seismologists assumed. The long-term fault memory comes from the fact that sometimes an earthquake didn’t release all the strain that built up on the fault over time, so some remains after a big earthquake and can cause another. This explains earthquakes that sometimes come in clusters.
“Earthquake clusters imply that faults have long-term memory,” said Salditch, now at the U.S. Geological Survey. “If it’s been a long time since a large earthquake, then even after another happens, the fault’s ‘memory’ sometimes isn’t erased by the earthquake, leaving left-over strain and an increased chance of having another. Our new model calculates earthquake probabilities this way.”
For example, although large earthquakes on the Mojave section of the San Andreas fault occur on average every 135 years, the most recent one occurred in 1857, only 45 years after one in 1812. Although this wouldn’t have been expected using the traditional model, the new model shows that because the 1812 earthquake occurred after a 304-year gap since the previous earthquake in 1508, the leftover strain caused a sooner-than-average quake in 1857.
“It makes sense that the specific order and timing of past earthquakes matters,” said Spencer, a professor of statistics. “Many systems’ behavior depends on their history over a long time. For example, your risk of spraining an ankle depends not just on the last sprain you had, but also on previous ones.”
Reference:
James S. Neely et al, A More Realistic Earthquake Probability Model Using Long-Term Fault Memory, Bulletin of the Seismological Society of America (2022). DOI: 10.1785/0120220083
UV light from the sun slowly breaks down plastics on the ocean’s surfaces. Floating microplastic is broken down into ever smaller, invisible nanoplastic particles that spread across the entire water column, but also to compounds that can then be completely broken down by bacteria. This is shown by experiments in the laboratory of the Royal Netherlands Institute for Sea Research, NIOZ, on Texel. In the latest issue of Marine Pollution Bulletin, PhD student Annalisa Delre and colleagues calculate that about two percent of visibly floating plastic may disappears from the ocean surface in this way each year. “This may seem small, but year after year, this adds up. Our data show that sunlight could thus have degraded a substantial amount of all the floating plastic that has been littered into the oceans since the 1950s,” says Delre.
Missing Plastic Paradox
Since the mass production of plastics began in the 1950s, a significant portion of plastic waste has made its way to the ocean via rivers, blown of from land by winds or directly dumped from ships. But the amount of plastic that is actually found in the ocean is only a fraction of what has entered the ocean. The majority is literally lost. In science, this problem is known as the Missing Plastic Paradox. To investigate if degradation by UV light can explain some of the vanished plastic, Delre and colleagues conducted experiments in the laboratory.
Artificial sun and sea
In a container filled with simulated seawater, the researchers mixed small plastic pieces. They then stirred this plastic soup automatically under a lamp that mimiced UV light from the sun. Gases and dissolved compounds including nanoplastics that leached from the degrading plastic pieces were then captured and analysed.
Slow degradation
From these measurements, the researchers measured that at least 1.7 percent of (visible) microplastics break down annually. For the most part it breaks down into ever smaller pieces including the (invisible) nanoplastics as well as into molecules that one also finds in crude oil. Potentially, some of these can be broken down further by bacteria. Only a small fraction is fully oxidized to the relatively harmless CO2.
Fed into a more complex calculation, accounting for the release of floating plastic to the ocean, beaching and ongoing photodegradation at the ocean surface, the breakdown by sunlight could have transformed a fifth (22%) of all floating plastic that has ever been released to the ocean, mostly to smaller, dissolved particles and compounds.
“With these calculations, we put an important piece in the jigsaw of the Missing Plastic Paradox in place,” says Helge Niemann, researcher at NIOZ and professor at Utrecht University and one of the supervisors of PhD student Delre.
Effects on marine life
Potentially, there may be good news in this research, says Niemann. “In part, the plastic breaks down into substances that can be completely broken down by bacteria. But for another part, the plastic remains in the water as invisible nanoparticles.”
In an earlier study with ‘real’ Wadden Sea water and North Sea water, Niemann and colleagues already showed that a substantial part of the missing plastics floats in the oceans as invisible nanoparticles. “The precise effects of these particles on algae, fish and other life in the oceans are still largely unclear,” says Niemann. “With these experiments under UV light, we can explain another part of the plastic paradox. We need to continue investigating the fate of the remaining plastic. Also, we need to investigate what all this micro and nano plastic does to marine life. Even more important,” Niemann stresses, “is to stop plastic littering all together, as this thickens the ocean’s plastic soup.”
Reference:
Annalisa Delre, Maaike Goudriaan, Victor Hernando Morales b, Annika Vaksmaa, Rachel Tintswalo Ndhlovu, Marianne Baas, Edwin Keijzer, Tim de Groot, Emna Zeghal, Matthias Egger Thomas Röckmann, Helge Niemann Plastic photodegradaton under simulated marine concitions. Plastic photodegradaton under simulated marine concitions. Marine Pollution Bulletin, Jan 2023 DOI: 10.1016/j.marpolbul.2022.114544
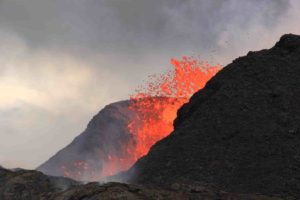
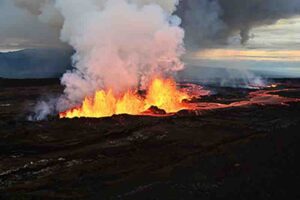
Lava fountains at Kilauea in Hawaii created a spatter cone, which was estimated to be 180 feet tall in this June 2018 photo. Credit: U.S. Geological Survey
Magma pumping through a massive complex of flat, interconnected chambers deep beneath volcanoes in Hawai’i appears to be responsible for an unexplained swarm of tiny earthquakes felt on the Big Island over the past seven years, in particular since the 2018 eruption and summit collapse of Kīlauea.
The pancake-like chambers, called “sills,” channel magma laterally and upward to recharge the magma chambers of at least two of the island’s active volcanoes: Mauna Loa and Kīlauea. Using a machine-learning algorithm, geoscientists at Caltech were able to use data gathered from seismic stations on the island to chart out the structure of the sills, mapping them with never-before-seen precision and demonstrating that they link the volcanoes.
More than 192,000 small seismic events, each represented here as a single black dot, reveal in 3D the shape and location of the sills beneath Hawai’i
Further, the researchers were able to monitor the progress of the magma as it pushed upward through the sills, and to link that to Kīlauea’s activity. They analyzed a period that ended in May 2022, so it is not yet possible to say whether they can spot the magma flow that led to the November 27 eruption of Mauna Loa, but the team intends to look at that next.
“Before this study, we knew very little about how magma is stored and transported deep beneath Hawai’i. Now, we have a high-definition map of an important part of the plumbing system,” says John D. Wilding (MS ’22), Caltech graduate student and co-lead author of a paper describing the research that was published in the journal Science on December 22. The study represents the first time scientists have been able to directly observe a magma structure located this deep underground. “We know pretty well what the magma is doing in the shallow part of the system above 15 kilometer depth, but until now, everything below that has just been the subject of speculation,” Wilding says.
With data on more than 192,000 small temblors (less than magnitude 3.0) that occurred over the 3.5-year period from 2018 to mid-2022, the team was able to map out more than a dozen sills stacked on top of one another. The largest is about 6 kilometers by 7 kilometers. The sills tend to be around 300 meters thick, and are separated by a distance of about 500 meters.
“Volcanic earthquakes are typically characterized by their small magnitude and frequent occurrence during magmatic unrest,” says Weiqiang Zhu, postdoctoral scholar research associate in geophysics and co-lead author of the Science paper. “We are excited about recent advances in machine learning, particularly deep learning, which are helping to accurately detect and locate these small seismic signals recorded by dense seismic networks. Machine learning can be an effective tool for seismologists to analyze large archived datasets, identify patterns in small earthquakes, and gain insights into underlying structures and physical mechanisms.”
Wilding and Zhu worked with Jennifer Jackson, the William E. Leonhard Professor of Mineral Physics; and Zachary Ross, assistant professor of geophysics and William H. Hurt Scholar; who are both senior authors on the paper. In October, Ross was named one of the 2022 Packard Fellows for Science and Engineering, which will provide funding to support this research moving forward.
The team did not have to place a single piece of hardware to do the study; rather, they relied on data gathered by United States Geological Survey seismometers on the island. However, the machine-learning algorithm developed in Ross’s lab gave them an unprecedented ability to separate signal from noise — that is, to clearly identify earthquakes and their locations, which create a sort of 3-D “point cloud” that illustrates the sills.
“It’s analogous to taking a CT [computerized tomography] scan, the way a doctor can visualize the inside of a patient’s body,” Ross says. “But instead of using controlled sources with X-rays, we use passive sources, which are earthquakes.”
The team was able to catalog about 10 times as many earthquakes as was previously possible, and they were able to pinpoint their locations with a margin of error of less than a kilometer; previous locations were determined with error margins of a few kilometers. The work was accomplished using a deep-learning algorithm that had been taught to spot earthquake signals using a training dataset of millions of previously identified earthquakes. Even with small earthquakes, which might not stand out to the human eye on a seismogram, the algorithm finds patterns that distinguish quakes from background noise. Ross previously used the technique to reveal how a naturally occurring injection of underground fluids drove a four-year-long earthquake swarm near Cahuilla, California.
The sills appear to be at depths ranging from around 36-43 kilometers. (For reference, the deepest humans have ever drilled into the Earth is a little over 12 kilometers.) Scientists have long known that a phase boundary is present at a depth of around 35 kilometers beneath Hawai’i; at such a phase boundary, rock of the same chemical composition transitions from one group of minerals above to a different group below. Studying the new data, Jackson recognized that the transitions occurring in this rock coupled to magma injections could host chemical reactions and processes that stress or weaken the rock, possibly explaining the existence of the sills — and by extension, the active seismicity.
“The transition of spinel to plagioclase within the lherzolite rock may be occurring through diffuse migration, entrapment, and crystallization of magma melts within the shallow lithospheric mantle underneath Hawai’i,” Jackson says. “Such assemblages can exhibit transient weakening arising from coupled deformation and chemical reactions, which could facilitate crack growth or fault activation. Recurrent magma injections would continuously modulate grain sizes in the sill complex, prolonging conditions for seismic deformation in the rock. This process could exploit lateral variations in strength to produce and sustain the laterally compact seismogenic features that we observe.”
It is unclear whether the sills beneath the Big Island are unique to Hawai’i or whether this sort of subvolcanic structure is common, the researchers say. “Hawai’i is the best-monitored island in the world, with dozens of seismic stations giving us a window into what’s going on beneath the surface. We have to wonder, at how many other locations is this happening?” Wilding says.
Also unclear is exactly how the magma’s movement triggers the tiny quakes. The earthquakes map out the structures, but the actual mechanism of earthquakes is not well understood. It could be that the injection of a lot of magma into a space creates a lot of stress, the researchers say.
Reference:
John D. Wilding, Weiqiang Zhu, Zachary E. Ross, Jennifer M. Jackson. The magmatic web beneath Hawai‘i. Science, 2022; DOI: 10.1126/science.ade5755
New study reveals, how foreshock waves interact with Earth’s magnetosphere. Foreshock waves are able to tune the shock, making it alternatively stronger or weaker. These waves could only be detected in a narrow region behind the shock. (Image: Lucile Turc)
An international team of scientists led by Lucile Turc, an Academy Research Fellow at the University of Helsinki and supported by the International Space Science Institute in Bern has studied the propagation of electromagnetic waves in near-Earth space for three years. The team has studied the waves in the area where the solar wind collides with Earth’s magnetic field called foreshock region, and how the waves are transmitted to the other side of the shock. The results of the study are now published in Nature Physics.
“How the waves would survive passing through the shock has remained a mystery since the waves were first discovered in the 1970s. No evidence of those waves has ever been found on the other side of the shock,” says Turc.
The team has used a cutting-edge computer model, Vlasiator, developed at the University of Helsinki by a group led by professor Minna Palmroth, to recreate and understand the physical processes at play in the wave transmission. A careful analysis of the simulation revealed the presence of waves on the other side of the shock, with almost identical properties as in the foreshock.
“Once it was known what and where to look for, clear signatures of the waves were found in satellite data, confirming the numerical results,” says Lucile Turc.
The waves in the foreshock can enter the Earth’s magnetic field
Around our planet is a magnetic bubble, the magnetosphere, which shields us from the solar wind, a stream of charged particles coming from the Sun. Electromagnetic waves, appearing as small oscillations of the Earth’s magnetic field, are frequently recorded by scientific observatories in space and on the ground. These waves can be caused by the impact of the changing solar wind or come from the outside of the magnetosphere.
The electromagnetic waves play an important role in creating adverse space weather around our planet: they can for example accelerate particles to high energies, which can then damage spacecraft electronics, and cause these particles to fall into the atmosphere.
On the side of Earth facing the Sun, scientific observatories frequently record oscillations at the same period as those waves that form ahead of the Earth’s magnetosphere, singing a clear magnetic song in a region of space called the foreshock.
This has led space scientists to think that there is a connection between the two, and that the waves in the foreshock can enter the Earth’s magnetosphere and travel all the way to the Earth’s surface. However, one major obstacle lies in their way: the waves must cross the shock before reaching the magnetosphere.
“At first, we thought that the initial theory proposed in the 1970s was correct: the waves could cross the shock unchanged. But there was an inconsistency in the wave properties that this theory could not reconcile, so we investigated further,” says Turc.
“Eventually, it became clear that things were much more complicated than it seemed. The waves we saw behind the shock were not the same as those in the foreshock, but new waves created at the shock by the periodic impact of foreshock waves.”
When the solar wind flows through the shock, it is compressed and heated. The shock strength determines how much compression and heating take place. Turc and her colleagues showed that foreshock waves are able to tune the shock, making it alternatively stronger or weaker when wave troughs or crests arrive at the shock. As a result, the solar wind behind the shock changes periodically and creates new waves, in concert with the foreshock waves.
The numerical model also pinpointed that these waves could only be detected in a narrow region behind the shock, and that they could easily be hidden by the turbulence in this region. This likely explains why they had not been observed before.
While the waves originating from the foreshock only play a limited role in space weather at Earth, they are of great importance to understand the fundamental physics of our universe.
Reference:
L. Turc, O. W. Roberts, D. Verscharen, A. P. Dimmock, P. Kajdič, M. Palmroth, Y. Pfau-Kempf, A. Johlander, M. Dubart, E. K. J. Kilpua, J. Soucek, K. Takahashi, N. Takahashi, M. Battarbee, U. Ganse. Transmission of foreshock waves through Earth’s bow shock. Nature Physics, 2022; DOI: 10.1038/s41567-022-01837-z
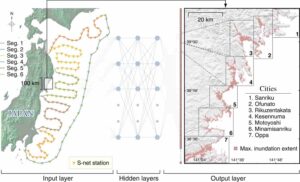
The schematic of the proposed method. Locations of interest are shown with maximum inundation extent on the training set. S-net station segments are marked with colored lines. Credit: Nature Communications (2022). DOI: 10.1038/s41467-022-33253-5
Detailed predictions about how an approaching tsunami will impact the northeastern coastline in Japan can be made in fractions of a second rather than half an hour or so—buying precious time for people to take appropriate action. This potentially life-saving technology exploits the power of machine learning.
The catastrophic tsunami that struck northeast Japan on March 11, 2011 claimed the lives of about 18,500 people. Many lives might have been saved if early warning of the impending tsunami had included accurate predictions of how high the water would reach at different points along the coastline and further inland.
The coast now boasts the world’s largest network of sensors for monitoring movement of the ocean floor. The 150 offshore stations making up this network provide early warning of tsunamis. But to be meaningful, the data generated by the sensors needs to be converted into tsunami heights and extents along the coastline.
This usually requires numerically solving difficult nonlinear equations, which typically takes about 30 minutes on a standard computer. But the 2011 tsunami hit some parts of the coast a mere 45 minutes after the earthquake.
Now, Iyan Mulia of the RIKEN Prediction Science Laboratory and co-workers have used machine learning to cut the calculation time to less than one second.
“The main advantage of our method is the speed of predictions, which is crucial for early warning,” explains Mulia. “Conventional tsunami modeling provides predictions after 30 minutes, which is too late. But our model can make predictions within seconds.”
Since tsunamis are rare occurrences, the team trained their machine-learning system using more than 3,000 computer-generated tsunami events. They then tested it with 480 other tsunami scenarios and three actual tsunamis. Their machine-learning-based model could achieve comparable accuracy at only 1% the computational effort.
The same deep-learning approach could be used for other disaster scenarios where time is of the essence. “The sky’s the limit—you can apply this method to any kind of disaster predictions where the time constraint is very limited,” says Mulia, who first became interested in studying tsunamis after the 2004 Indian Ocean tsunami devastated coastal regions in his home country of Indonesia. “I’m now working on a storm surge prediction, also using machine learning.”
The work is published in the journal Nature Communications.
Mulia notes that the method is only accurate for large tsunamis that are higher than about 1.5 meters, so he and his team are now seeking to improve its accuracy for smaller tsunamis.
Reference:
Iyan E. Mulia et al, Machine learning-based tsunami inundation prediction derived from offshore observations, Nature Communications (2022). DOI: 10.1038/s41467-022-33253-5
Note: The above post is reprinted from materials provided by RIKEN.
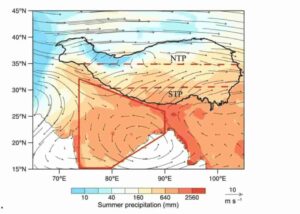
Summer precipitation and black carbon emission characteristics. a The spatial pattern of summer precipitation using the Climatic Research Unit (CRU) dataset overlain with summer 500 hPa wind fields for the period 2001–2016, using the ERA-Interim dataset over the Tibetan plateau (TP) and South Asia (denoted by red polygon). NTP and STP delineate the northern and southern Tibetan plateau boundaries.
Black carbon aerosol is the product of incomplete combustion of fossil fuels and biomass, and has strong light absorption. Black carbon deposition in snow ice reduces the albedo of the snow ice surface, accelerating the melting of glaciers and snow cover, and thus changing the hydrological process and water resources in the region.
The South Asia region adjacent to the Tibetan Plateau is one of the regions with high black carbon emission in the world. Black carbon aerosol from South Asia can transport across the Himalayan Mountains to the inland region of the Tibetan Plateau.
Recently, a joint research team led by Prof. Kang Shichang from the Northwest Institute of Eco-Environment and Resources of the Chinese Academy of Sciences (CAS), Prof. Chen Deliang from the University of Gothenburg and Prof. Robert Gillies from the Utah State University analyzed the influence of black carbon aerosols on regional precipitation and glaciers over the Qinghai-Tibet Plateau.
Their findings were published in Nature Communications on Nov. 30.
The researchers found that since the 21st century, the South Asian black carbon aerosols have indirectly affected the material supply of the Tibetan Plateau glaciers by changing water vapor transport in the South Asian monsoon.
“Black carbon aerosols in South Asia heat up the middle and upper atmosphere, thus increasing the north-south temperature gradient,” said Prof. Kang. “Accordingly, the convective activity in South Asia is enhanced, which causes convergence of water vapor in South Asia. Meanwhile, black carbon also increases the number of cloud condensation nuclei in the atmosphere.”
These changes in meteorological conditions caused by black carbon aerosols make more water vapor form precipitation in South Asia, and less water vapor transmit to the Tibetan Plateau. As a result, precipitation in the central and southern Tibetan Plateau decreases during monsoon, especially in the southern part of the Tibetan Plateau.
The decrease of precipitation further leads to the decrease of material supply of glaciers. From 2007 to 2016, the reduced material supply accounted for 11.0% of the average glacier material loss on the Tibetan Plateau and 22.1% in the southern part of the plateau.
“The transboundary transport and deposition of black carbon aerosols in South Asia accelerate glacier ablation on the Tibetan Plateau. Meanwhile, the reduction of plateau summer precipitation will reduce the material supply of plateau glacier, which will increase the amount of glacier material deficit,” said Prof. Kang.
Reference:
Junhua Yang et al, South Asian black carbon is threatening the water sustainability of the Asian Water Tower, Nature Communications (2022). DOI: 10.1038/s41467-022-35128-1
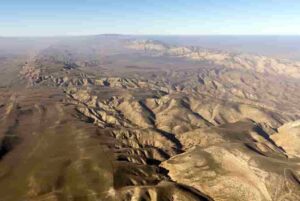
A team from the University of South Florida is on the ground in Hawaii studying Mauna Loa, the largest active volcano in the world, to improve efforts that can help protect residents from lava flow. While slow-moving, lava averages 2,200 degrees Fahrenheit and destroys everything in its path.
The team is collecting data that will be used to create models that can help improve lava flow forecasting tools that are useful in determining how hazards impact populations. One such tool, known as MOLASSES, is a simulation engine that forecasts inundation areas of lava flow.
MOLASSES was created by USF geosciences Professor Chuck Connor, who says using the radar to gather data is essential in understanding volcano topography and improving the lava flow models.
“We want to make hazard maps that help people understand where they live and what the risks are,” Connor said. “We can’t stop a volcano from erupting, but we can give people warning about the lava flow.”
Shortly after Mauna Loa’s eruption in late November — the first since 1984 — USF geosciences Professor Tim Dixon sent two graduate students, Taha Chorsi and Mahsa Afra, to Hawaii with a Terrestrial Radar Interferometer, a rare, ground-based instrument that measures where the landscape is changing and how quickly those changes are occurring.
Chorsi and Afra delivered the radar to USF alumna Lis Gallant, a National Science Foundation postdoctoral research fellow at the United States Geological Survey Hawaiian Volcano Observatory.
Using the radar, the USF scientists were able to capture the thickening of Mauna Loa’s lava flows. The novelty of the ground-based instrument is its ability to measure the lava’s surface and create a three-dimensional map within a span of minutes.
“A lot of volcano science happens in hostile terrains,” Gallant said. “This radar is a particularly powerful instrument because it can see through moisture, and now, we can definitely say it would be well-suited in areas where visibility is poor and to immediately help hazard response.”
The team will review this data over the next several months to determine where the Mauna Loa lava flow was moving and the velocities of those movements. The data can be used to better understand how lava flows move and advance, which in turn can be used by scientists to improve tools used to forecast lava flow hazards through models.
Dixon has had great success using the radar to monitor Earth movements in glaciers, landslides, earthquakes and volcanoes. Many of his students, including Chorsi and Afra, have worked alongside him over the years to learn the radar and develop a user manual.
“There’s probably only a hundred people in the world who can successfully use this instrument,” Dixon said.
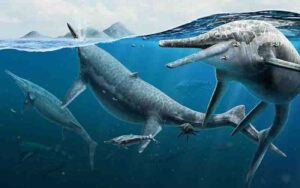
Fig. 1: Some adult individuals watch over the newly-hatched Europasaurus chicks which are leaving the nest to join their herd. Commissioned artwork by Davide Bonadonna.
Europasaurus is a long-necked, herbivorous dinosaur that lived in the Late Jurassic, about 154 million years ago, on a small island in modern-day Germany. Recently, scientists from the universities of Vienna and Greifswald examined fossil braincase material of Europasaurus with the aid of micro-computed tomography (micro-CT). The digital reconstruction of the inner ear of Europasaurus gave the researchers new insights not only into its hearing ability, but also into its reproductive and social behaviour. The study was recently published in eLife.
Like its famous relative Brachiosaurus, Europasaurus belongs to the group of sauropod dinosaurs, which include the largest land-living animals that ever lived on Earth. Some representatives could attain body lengths of around 40 metres, possibly weighing up to 80 metric tons. However, Europasaurus holgeri was a comparatively small sauropod species with a body height of up to three metres.
Europasaurus, which lived about 154 million years ago on an island in modern-day Germany, constitutes the first dinosaur for which the evolutionary phenomenon of insular dwarfism was demonstrated: large island-dwelling animals become smaller over a number of generations. Possibly, Europasaurus represents the fossil counterpart to the recent Sumatran tiger and rhino, which are smaller than their closest relatives from the mainland.
Fossil skull remains of very young to fully-grown adults have been examined
For the study that has just been published, scientists from the universities of Greifswald and Vienna examined fossil braincase material of Europasaurus, belonging to different age stages: from very young and small individuals to adult ones. In order to learn more about these long extinct animals, the researchers reconstructed the cavities that once housed the brain and inner ears with the aid of micro-CT.
The part of the inner ear being responsible for hearing, the lagena or cochlea, turns out to be relatively long in Europasaurus. This suggests that these animals had a good sense of hearing, rendering intraspecific communication crucial and gregarious behavior likely.
Europasaurus was probably precocial
Another part of the inner ear is relevant for the sense of equilibrium and consists of three tiny arches. The scientists found that the inner ear cavities within very small specimens resemble the respective cavities of adults in form and size. “This supposes that very young individuals of Europasaurus strongly relied on the ability to equilibrate already. Some considered skull remains were so tiny (~2 cm) that they may belong to hatchlings, which renders the species precocial,” says Sebastian Stumpf from the University of Vienna. Whereas some sauropods weighed several tens of tons more than their newly-hatched offspring (posing a lethal threat for the latter), the hatchlings of Europasaurus may have immediately followed the herd in some approximation.
Reference:
Marco Schade, Nils Knötschke, Marie K Hörnig, Carina Paetzel, Sebastian Stumpf. Neurovascular anatomy of dwarf dinosaur implies precociality in sauropods. eLife, 2022; 11 DOI: 10.7554/eLife.82190
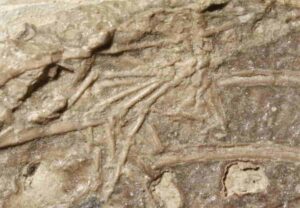
Close up photograph of the mammal foot among the ribs of Microraptor. Photograph by Hans Larsson, who retains the copyright on these images. These may be used in any article in association with this story. / Gros plan photo du pied de mammifère parmi les côtes de Microraptor. Photographie de Hans Larsson, qui détient les droits d’auteur sur ces images. Ceux-ci peuvent être utilisés dans n’importe quel article en association avec cette histoire.
Microraptor was an opportunistic predator, feeding on fish, birds, lizards — and now small mammals. The discovery of a rare fossil reveals the creature was a generalist carnivore in the ancient ecosystem of dinosaurs.
Finding the last meal of any fossil animal is rare. When McGill University Professor Hans Larsson saw a complete mammal foot inside the rib cage of the small, feathered dinosaur, his jaw dropped. Of the many hundreds of carnivorous dinosaur skeletons, only 20 cases preserve their last meals. This new find makes 21.
“At first, I couldn’t believe it. There was a tiny rodent-like mammal foot about a centimeter long perfectly preserved inside a Microraptor skeleton. These finds are the only solid evidence we have about the food consumption of these long extinct animals — and they are exceptionally rare,” says Larsson, who came across the fossil while visiting museum collections in China.
Microraptor was not a picky eater
Fully feathered with wings on both its arms and legs, this dinosaur is closely linked to the origin of birds. Microraptor was about the size of a crow and one of the smallest dinosaurs. The first specimen was discovered in deposits in Liaoning, China, in the early 2000s.
“We already know of Microraptor specimens preserved with parts of fish, a bird, and a lizard in their bellies. This new find adds a small mammal to their diet, suggesting these dinosaurs were opportunistic and not picky eaters,” says Larsson who is a Professor of Biology at the Redpath Museum of McGill University.
“Knowing they were not specialized to any particular food is a big deal,” he adds. According to the team of researchers, this could be the first evidence of a generalist carnivore in dinosaur ecosystems. Generalist predators are important stabilizers in today’s ecosystems, like foxes and crows, because they can feed among several species that may have differing population abundances.
“Knowing that Microraptor was a generalist carnivore puts a new perspective on how ancient ecosystems may have worked and a possible insight into the success of these small, feathered dinosaurs,” says Larsson.
Reference:
David W. E. Hone, T. Alexander Dececchi, Corwin Sullivan, Xu Xing, Hans C. E. Larsson. Generalist diet of Microraptor zhaoianus included mammals. Journal of Vertebrate Paleontology, 2022; DOI: 10.1080/02724634.2022.2144337
Artist’s life reconstruction of adult and newly born Triassic ichthyosaurs Shonisaurus, 2022. Credit: Gabriel Ugueto.
Today’s marine giants — such as blue and humpback whales — routinely make massive migrations across the ocean to breed and give birth in waters where predators are scarce, with many congregating year after year along the same stretches of coastline. Now, new research from a team of scientists — including researchers with the Smithsonian Institution, Vanderbilt University, the Natural History Museum of Utah, the University of Utah, University of Nevada, Reno, University of Edinburgh, University of Texas at Austin, Vrije Universiteit Brussels and University of Oxford — suggests that nearly 200 million years before giant whales evolved, school bus-sized marine reptiles called ichthyosaurs may have been making similar migrations to breed and give birth together in relative safety.
The findings, published today in the journal Current Biology, examine a rich fossil bed in the renowned Berlin-Ichthyosaur State Park (BISP) in Nevada’s Humboldt-Toiyabe National Forest, where many 50-foot-long ichthyosaurs (Shonisaurus popularis)lay petrified in stone. Led by Neil Kelley, Vanderbilt University scientist and former Smithsonian’s National Museum of Natural History Peter Buck postdoctoral fellow, and co-authored by the museum’s curator of fossil marine mammals Nicholas Pyenson, the study offers a plausible explanation as to how at least 37 of these marine reptiles came to meet their ends in the same locality — a question that has vexed paleontologists for more than half a century.
“We present evidence that these ichthyosaurs died here in large numbers because they were migrating to this area to give birth for many generations across hundreds of thousands of years,” Pyenson said. “That means this type of behavior we observe today in whales has been around for more than 200 million years.”
Over the years, some paleontologists have proposed that BISP’s ichthyosaurs — predators resembling oversized chunky dolphins that have been adopted as Nevada’s state fossil — died in a mass stranding event such as those that sometimes afflicts modern whales, or that the creatures were poisoned by toxins from a nearby harmful algal bloom. The problem is that these hypotheses lack strong lines of scientific evidence to support them.
To try to solve this prehistoric mystery, the team combined newer paleontological techniques such as 3D scanning and geochemistry with traditional paleontological perseverance by poring over archival materials, photographs, maps, field notes and drawer after drawer of museum collections for shreds of evidence that could be reanalyzed.
Although most well-studied paleontological sites excavate fossils so they can be more closely studied by scientists at research institutions, the main attraction for visitors to the Nevada State Park-run BISP is a barn-like building that houses what researchers call Quarry 2, an array of ichthyosaurs that have been left embedded in the rock for the public to see and appreciate. Quarry 2 has partial skeletons from an estimated seven individual ichthyosaurs that all appear to have died around the same time.
“When I first visited the site in 2014, my first thought was that the best way to study it would be to create a full-color, high-resolution 3D model,” Kelley said. “A 3D model would allow us to study the way these large fossils were arranged in relation to one another without losing the ability to go bone by bone.”
To do this, Kelley, Pyenson and the research team collaborated with Jon Blundell, a member of the Smithsonian Digitization Program Office’s 3D Program team, and Holly Little, a long-time collaborator with Pyenson and the 3D Program’s team and currently the informatics manager in the museum’s Department of Paleobiology. While Pyenson and Kelley were physically measuring bones and studying the site using traditional paleontological techniques, Little and Blundell used digital cameras and a spherical laser scanner to take hundreds of photographs and millions of point measurements that were then stitched together using specialized software to create a 3D model of the fossil bed.
To further home in on what might have befallen these extinct marine reptiles, the team collected tiny samples of the rock surrounding the fossils and performed a series of geochemical tests to look for signs of environmental disturbance.
One test measured mercury, which often accompanies large-scale volcanic activity, and found no significantly increased levels. Other tests examined different types of carbon and determined that there was no evidence of sudden increases in organic matter in the marine sediments that would result in a dearth of oxygen in the surrounding waters (though, like whales, the ichthyosaurs breathed air).
These geochemical tests revealed no signs that these ichthyosaurs perished because of some cataclysm that would have seriously disturbed the ecosystem in which they died. Kelley, Pyenson and other colleagues on the research team continued to look beyond Quarry 2 to the surrounding geology and all the fossils that had previously been excavated from the area.
The geologic evidence indicates that when the ichthyosaurs died, their bones eventually sank to the bottom of the sea, rather than along a shoreline shallow enough to suggest stranding, ruling out another hypothesis. Even more telling, though the area’s limestone was chockfull of large adult Shonisaurus specimens, other marine vertebrates were scarce. The bulk of the other fossils at BISP come from small invertebrates such as clams and ammonites (spiral-shelled relatives of today’s squid).
“There are so many large, adult skeletons from this one species at this site and almost nothing else,” Pyenson said. “There are virtually no remains of things like fish or other marine reptiles for these ichthyosaursto feed on, and there are also no juvenile Shonisaurus skeletons.”
The researchers’ paleontological dragnet had eliminated some of the potential causes of death and started to provide intriguing clues about the type of ecosystem these marine predators were swimming in, but the evidence still did not clearly point to an alternative explanation.
The research team found a key piece of the puzzle when they discovered tiny ichthyosaur remains among new fossils collected at BISP and hiding within older museum collections. Careful comparison of the bones and teeth using micro-CT X-ray scans at Vanderbilt University revealed that these small bones were in fact embryonic and newborn Shonisaurus.
“Once it became clear that there was nothing for them to eat here, and there were large adult Shonisaurus along with embryos and newborns but no juveniles, we started to seriously consider whether this might have been a birthing ground,” Kelley said.
Further analysis of the various strata in which the different clusters of ichthyosaur bones were found also revealed that the ages of the many fossil beds of BISP were separated by at least hundreds of thousands of years, if not millions.
“Finding these different spots with the same species spread across geologic time with the same demographic pattern tells us that this was a preferred habitat that these large oceangoing predators returned to for generations,” Pyenson said. “This is a clear ecological signal, we argue, that this was a place that Shonisaurus used to give birth, very similar to today’s whales. Now we have evidence that this sort of behavior is 230 million years old.”
Kelley said the next step for this line of research is to investigate other ichthyosaur and Shonisaurus sites in North America with these new findings in mind to begin to recreate their ancient world — perhaps by looking for other breeding sites or for places with greater diversity of other species that could have been rich feeding grounds for this extinct apex predator.
The 3D scans of the site are now available for other researchers to study and for the public to explore via the open-source Smithsonian’s Voyager platform, which is developed and maintained by Blundell’s team members at the Digitization Program Office. An interactive digital experience about the research team’s study, including a 3D model of ichthyosaur sites analyzed, is also available on the Digitization Program Office’s website.
“Our work is public,” Blundell said. “We aren’t just scanning sites and objects and locking them up. We create these scans to open up the collection to other researchers and members of the public who can’t physically get to the Smithsonian.”
This research was conducted under research permits issued by the U.S. Forest Service and Nevada State Parks, and it was supported by funding from the Smithsonian, University of Nevada, Reno, Vanderbilt University and University of Utah.
Reference:
Neil P. Kelley, Randall B. Irmis, Paige E. dePolo, Paula J. Noble, Danielle Montague-Judd, Holly Little, Jon Blundell, Cornelia Rasmussen, Lawrence M.E. Percival, Tamsin A. Mather, Nicholas D. Pyenson. Grouping behavior in a Triassic marine apex predator. Current Biology, 2022; 32 (24): 5398 DOI: 10.1016/j.cub.2022.11.005
Dinosaur ancestors are shown in this artist’s conception of life in the Chañares formation approximately 235 million years. Credit: Victor O. Leshyk / www.paleovista.com
Climate change, rather than competition, played a key role in the ascendancy of dinosaurs through the Late Triassic and Early Jurassic periods.
According to new research, changes in global climate associated with the Triassic-Jurassic mass extinction — which wiped out many large terrestrial vertebrates such as the giant armadillo-like aetosaurs — actually benefitted the earliest dinosaurs.
In particular, sauropod-like dinosaurs, which became the giant herbivore species of the later Jurassic like Diplodocus and Brachiosaurus, were able to thrive and expand across new territories as the planet warmed up after the extinction event, 201 million years ago.
The new evidence is published in Current Biology, by an international team of palaeontologists led by the Universities of Birmingham and Bristol, in the UK, Friedrich-Alexander University Erlangen-Nu?rnberg (FAU), in Germany, and the University of São Paulo in Brazil.
The team compared computer models of prehistoric global climate conditions such as temperature and rainfall with data on the different locations of dinosaurs taken from sources such as the Paleobiology Database. They showed how the sauropods, and sauropod-like animals, with their long tails and necks and small heads, were the runaway success story of a turbulent period of evolution.
Dr Emma Dunne, now a lecturer in palaeontology at FAU, carried out the research while at the University of Birmingham. She said: “What we see in the data suggests that instead of dinosaurs being outcompeted by other large vertebrates, it was variations in climate conditions that were restricting their diversity. But once these conditions changed across the Triassic-Jurassic boundary, they were able to flourish.
“The results were somewhat surprising, because it turns out that sauropods were really fussy from the get-go: later in their evolution they continue to stay in warmer areas and avoid polar regions.”
Co-author on the paper, Professor Richard Butler, at the University of Birmingham, said: “Climate change appears to have been really important in driving the evolution of early dinosaurs. What we want to do next is use the same techniques to understand the role of climate in the next 120 million years of the dinosaur story.”
The research was funded by the Leverhulme Trust and the European Research Council.
Reference:
Emma M. Dunne, Alexander Farnsworth, Roger B.J. Benson, Pedro L. Godoy, Sarah E. Greene, Paul J. Valdes, Daniel J. Lunt, Richard J. Butler. Climatic controls on the ecological ascendancy of dinosaurs. Current Biology, 2022; DOI: 10.1016/j.cub.2022.11.064