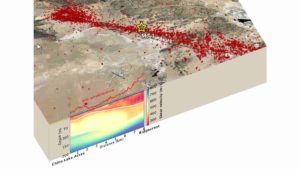
In July 2019, a series of earthquakes including two major shocks of magnitude 6.4 and 7.1 a day apart struck near Ridgecrest, CA, between Los Angeles and Las Vegas. For local residents, it was a violent interruption to the Fourth of July holiday. For seismologists, it was a rare opportunity to study how earthquakes damage the Earth’s crust.
The earthquake zone — which belongs to a network of faults called the Eastern California Shear Zone — is sparsely populated and arid, without much in the way of vegetation or buildings to obscure the surface. But it is also well-covered by satellite and remote imagery and accessible to geologists who could be on the scene well before evidence of crust damage disappeared.
UC Davis doctoral student Alba Rodríguez Padilla was among the scientists studying the site, along with Professor Mike Oskin, Department of Earth and Planetary Sciences, Christopher Milliner, California Institute of Technology and Andreas Plesch of Harvard University. They mapped the surface rupture from LIDAR data and aerial imagery collected by prior studies, and compared the rupture maps to other datasets to explore the distribution of rock damage from the earthquakes. Their findings are published Feb. 24 in Nature Geoscience.
“We not only have aridity helping here, improvements in imaging technique and resolution, together with collecting a large spatial data footprint, are what make the Ridgecrest coverage cutting edge,” Rodríguez Padilla said.
Inelastic deformation
The rock surrounding the fault suffered from “inelastic deformation,” meaning it was deformed and broken rather than returning to its original configuration. The deformation was highest within 100 meters of the fault, with widespread, low-intensity damage up to 20 kilometers (16 miles) away.
This deformation leaves the rock around the fault less rigid than before, softening the crust. This softening dissipates energy from future earthquakes, increases permeability and focuses deformation.
The study provides a better understanding of how damage from earthquakes accumulates and might affect future events, Rodríguez Padilla said.
The study was funded by the Southern California Earthquake Center, which is supported by NSF and the U.S. Geological Survey. Rodríguez Padilla was partly supported by a NASA fellowship.
Reference:
Alba M. Rodriguez Padilla, Michael E. Oskin, Christopher W. D. Milliner, Andreas Plesch. Accrual of widespread rock damage from the 2019 Ridgecrest earthquakes. Nature Geoscience, 2022; DOI: 10.1038/s41561-021-00888-w
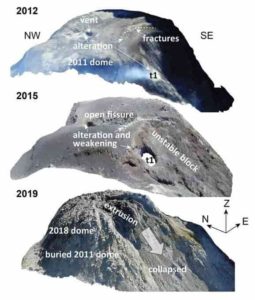
Nearly 10 yrs of drone surveys at Merapi volcano highlights the importance of hydrothermal weakening and structures hidden beneath younger lavas. A fracture system that formed in 2012 was subsequently buried under new lava in 2018. Only a year later, the new lava dome that formed in 2018 showed signs of instability and collapse along the previously buried fracture system, implying that hidden weaknesses may be a key factor in controlling hazardous volcano collapse. Credit: Darmawan et al., (2022)
Lava domes form at the top of many volcanoes when viscous lava erupts. When they become unstable, they can collapse and cause a hazard. An international team of researchers has analyzed summit dome instabilities at the Merapi Volcano, Indonesia. The researchers hope that by understanding the inner processes, volcano collapses can be better forecasted.
Catastrophic volcano collapses and associated explosions, like the famous collapse of Mt St Helens in 1980, are widely considered as unpredictable. This is because the physical properties, stress conditions, and internal structure of volcanoes and the lava domes on top of many volcanoes are not well understood and can change rapidly from one day to another.
A new study jointly led by Gadja Mata University in Yogyakarta Indonesia, Uppsala University in Sweden, and the German Research Center GFZ at Potsdam is now able to explain summit dome instabilities and associated pyroclastic flows at Merapi volcano, Indonesia. The study combines novel drone-based photogrammetry surveillance over several years with mineralogical, geochemical, and mechanical rock strength measurements.
The research demonstrated that a horseshoe-shaped fracture zone in the volcanoes summit region that formed in 2012 and which guided intense gas emission in the past was subsequently buried by renewed lava outpourings in 2018. The new lava dome that has been forming since 2018 started to show signs of instability in 2019 and the researchers were able to show that the summit dome of the volcano is currently collapsing along this now-hidden fracture zone. The research team then considered the changes that must have occurred along this now buried fracture zone from long term gas flux by measuring the composition and physical properties along similar fracture zones in the volcano’s summit region, and concludes that weakened rocks of the hidden fracture zone are likely the main cause for the location of the ongoing summit instabilities at Merapi.
This finding now offers an opportunity for monitoring teams at volcanoes to better forecast locations of potential volcano collapse by employing long-term remote sensing monitoring techniques to assess the hazards associated with summit dome and edifice failure and collapses at active volcanoes worldwide.
Reference:
Darmawan et al. Hidden mechanical weaknesses within lava domes provided by buried high-porosity hydrothermal alteration zones. Scientific Reports, DOI: 10.1038/s41598-022-06765-9
Note: The above post is reprinted from materials provided by Uppsala University.
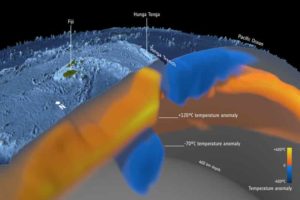
The astonishing force of the Tonga volcanic eruption in January 2022 shocked the world, but the fact that this underwater volcano actually erupted came as less of a surprise to geoscientists using satellite data to study changes in the temperature deep below Earth’s surface. As part of the effort to understand the complexities of Earth’s interior, scientists working within ESA’s Science for Society 3D Earth project, have developed a state-of-the art model of the lithosphere, which is a term to describe Earth’s brittle crust and the top part of the upper mantle, and the sub-lithospheric upper mantle down to 400 km depth. The model combines different satellite data, such as gravity data from ESA’s GOCE mission, with in-situ observations, primarily seismic tomography. The model that show differences in temperature, or thermal structures, indicated that the Tonga volcano was due to erupt at some point. Credit: ESA/Planetary Visions
The astonishing force of the Tonga volcanic eruption shocked the world, but the fact that this underwater volcano actually erupted came as less of a surprise to geoscientists using satellite data to study changes in the temperature deep below Earth’s surface.
The cataclysmic explosion of the Hunga Tonga-Hunga Ha’apai volcano in January is reported to have been the biggest eruption recorded anywhere on the planet in 30 years. It sent a plume of ash soaring into the sky, left the island nation of Tonga smothered in ash, sonic booms were heard as far away as Alaska and tsunami waves raced across the Pacific Ocean.
While the Tonga eruption was powerful but short, last year’s eruption of the Cumbre Vieja volcano on the Spanish Canary Island of La Palma was less explosive but lasted for almost three months.
Although different, both of these recent eruptions remind us all of how devastating nature can be. A better understanding of the natural processes that are occurring deep below our feet might bring the possibility of predicting eruptions a little closer.
This is one of the aims of ESA’s Science for Society 3D Earth project where an international group of geoscientists joined forces to develop a state-of-the art global model of the lithosphere, which is a term to describe Earth’s brittle crust, the top part of the upper mantle and the sub-lithospheric upper mantle down to 400 km depth. The model combines different satellite data, such as gravity data from ESA’s GOCE, with in-situ observations, primarily seismic tomography.
In their model that shows differences in temperature, or the thermal structure, of Earth’s upper mantle, the researchers could see that these volcanoes would erupt at some point. Predicting exactly when this would happen is, however, more difficult.
Javier Fullea, from Complutense University of Madrid, said, “Our WINTERC-G model, which uses in-situ tomographic and GOCE satellite gravity data, shows a branch of the Azores plume. It is visible from the surface down to a depth of 400 km, at the base of the upper mantle. The plume flows southeast towards Madeira and the Canary Islands surrounding the cold mantle beneath the north Atlantic’s African margin.
“Across the globe, we see that the Hunga Tonga volcano is located in a back arc basin, created by the subduction of the Tonga slab. Back arc volcanoes are associated with the cold slab being melted by the mantle as the slab slides down into the mantle.”
Sergei Lebedev, from the University of Cambridge in the UK, adds, “From such models and seismic tomography, we see structures rising from great depth beneath the Canary Islands. These anomalies reflect hot material rising to the surface of Earth and are referred to as hotspots or plumes and are a constant source for the volcanos at the surface.
“The origin of the Hunga Tonga-Hunga Ha’apai volcano is different. It is a part of the Tonga–Kermadec arc, where the edge of the Pacific tectonic plate dives beneath the Australian Plate. Here, our imaging shows the layer of hydrated, partially molten rock above the plunging Pacific Plate, which feeds the volcanoes of the arc.”
But where do these thermal anomalies come from?
The answer lies even deeper, at a depth of around 2800 km, and is associated with structures at the core–mantle boundary: the Large-Low Seismic Velocity Provinces (LLSVPs). These prominent continent-sized structures appear to have a big impact on how the surface behaves.
Clint Conrad, from Norway’s Centre for Earth Evolution Dynamics, said, “There is a link between the flow in the mantle, where convection cells drive plate tectonics, and major plume locations. The flow along the core–mantle boundary pushes plume material against the LLSVPs, forming the plumes. In models, this flow is driven by downwelling slabs that surround the two LLSVPs. The Canary Islands, for example, site above the edge of the African LLSVP.”
However, the exact origin and build-up of the LLSVPs remains elusive. At the recent 4D Earth Science meeting alternative concepts and ideas were discussed using satellite data and seismological models, which will hopefully lead to more detailed studies of Earth interior in the near future.
Bart Root from TU Delft, one of the organizers, summarizes, “Clearly a multidisciplinary approach is needed, where different types of satellite data are combined with seismological data in a common way to address the exact structure of Earth’s deep interior.”
ESA’s Diego Fernandez noted, “I’m happy to see that ESA’s FutureEO Science for Society project is yielding results that will further improve our understanding of the deep-lying sources of the events such as we’ve just seen in La Palma and Tonga.
“It is worth noting that data from the GOCE satellite has been key to this research. GOCE, which mapped variations in Earth’s gravity field with extreme detail and precision, completed its mission in orbit back in 2013—and scientists still rely on the data. This is another example of the benefits our satellite missions bring well beyond their life in orbit.”
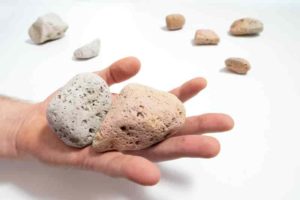
The pink pumice, and its thermal history, provides an insight into underwater eruptions.
In research published in the Nature portfolio journal Communications Earth and Environment, the researchers including Professor Scott Bryan, Dr Michael Jones and PhD candidate Joseph Knafelc, were intrigued by the occurrence of pink pumice within the massive pumice raft that resulted from the Havre 2012 deep-sea eruption.
The publication of the new research comes after the recent dramatic explosion of the Hunga Tonga Hunga Ha’apai volcano in Tonga, about 1200 km north of the Havre volcano, which has sharply brought the world’s attention to the explosive potential and hazards associated with submarine eruptions.
Professor Bryan, who has been studying pumice rafts for more than 20 years, said the pink pumice produced in the 2012 Havre eruption revealed insights into how magma can shoot out and up from underwater volcanoes.
“Unlike Hunga Tonga-Hunga Ha’apai, Havre is in a much more remote location. Its summit is 900m below sea level, and the nearest populated areas are around 800km away on the North Island of New Zealand,” Professor Bryan said.
When the volcano erupted in 2012, there was no one to see it happen. But the colour of the pumice tells the story of what happened.
Joseph Knafelc, lead author of the research, said the new model put forward in the research challenged the known depth limits for explosive eruptions.
“The common theory is that underwater eruptions, particularly in deep water such as at Havre, cannot be explosive and instead make lava flows on the seafloor,” Mr Knafelc said.
“But few submarine eruptions have been able to be observed, and past studies had failed to consider the existence of the pink pumice in the pumice raft.
“The colour in this case is critical — the pink to red colour tells us the pumice had to be ejected into the air at temperatures above 700 °C for tiny iron minerals to then oxidise and cause the reddening.
“The problem is that it was an underwater eruption that had to push up through nearly 1 km of ocean. The only way it can do this is if the eruption was very powerful and able to punch through the ocean water and produce an eruption column in the air.”
The research details how the core of the eruption was a powerful jet and able to be shielded from the surrounding water.
“The pink pumice and its thermal history tell us that the core of the eruption column was untouched by the cooling effects of the ocean water,” Professor Bryan said.
“An explosive eruption column could get hot pumice into the atmosphere in as little as a few seconds.
“This was a very powerful eruption. The problem is that previous studies had not recognised or downplayed the explosive potential of submarine eruptions even in very deep water and thus the hazards posed by submarine eruptions.
“As a timely reminder, we recently witnessed in Tonga the power of, and devastation and impact from, explosive submarine eruptions, the effects of which could be detected around the world.”
The research team included Professor Andrew Berry and Dr Guil Mallman from the Australian National University, Professor David Gust and Dr Henrietta Cathey from QUT, Dr Eric Ferré, from the University of Louisiana at Lafayette, and Daryl Howard from the Australian Synchrotron. QUT researchers are from the QUT Earth and Atmospheric School and the Central Analytical Research Facility (CARF).
Reference:
Joseph Knafelc, Scott E. Bryan, Michael W. M. Jones, David Gust, Guil Mallmann, Henrietta E. Cathey, Andrew J. Berry, Eric C. Ferré, Daryl L. Howard. Havre 2012 pink pumice is evidence of a short-lived, deep-sea, magnetite nanolite-driven explosive eruption. Communications Earth & Environment, 2022; 3 (1) DOI: 10.1038/s43247-022-00355-3
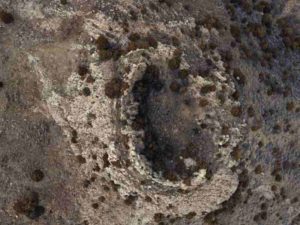
Drone images of craters formed at Sheep Mountain. Credit: Kent Sundell, Casper College.
Several dozen small impact craters, 10-70-m in size, have been discovered in southeastern Wyoming. A team of U.S. and German geoscientists found these ancient craters in exposed sedimentary layers from the Permian period (280 million years ago). After discovering the first craters, the team initially suspected that they are a crater-strewn field, formed by the breakup of an asteroid that entered the atmosphere. However, with the discovery of more and more craters over a wide area, this interpretation was ruled out.
Many of the craters are clustered in groups and are aligned along rays. Furthermore, several craters are elliptical, allowing the reconstruction of the incoming paths of the impactors. The reconstructed trajectories have a radial pattern.
“The trajectories indicate a single source and show that the craters were formed by ejected blocks from a large primary crater,” said project leader Thomas Kenkmann, professor of geology at the University of Freiburg, Germany. “Secondary craters around larger craters are well known from other planets and moons but have never been found on Earth,”
The team calculated the ballistic trajectories and used mathematical simulations to model the formation of the craters. All of the craters found so far are located 150-200 km from the presumed primary crater and were formed by blocks that were 4-8-m in size that struck the Earth at speeds of 700-1000 m/s. The team estimate that the source crater is about 50-65 km in diameter and should be deeply buried under younger sediments in the northern Denver basin near the Wyoming-Nebraska border.
Reference:
Thomas Kenkmann, Louis Müller, Allan Fraser, Doug Cook, Kent Sundell, Auriol S.P. Rae. Secondary cratering on Earth: The Wyoming impact crater field. GSA Bulletin, 2022; DOI: 10.1130/B36196.1
The Kumano Pluton in southern Japan appears as a red bulge (indicating dense rock) in the center of a new 3D visualization by The University of Texas at Austin. The pluton is large enough to interfere with the nearby Nankai subduction zone and the region’s earthquakes. Credit: Adrien Arnulf
Thanks to 20 years of seismic data processed through one of the world’s most powerful supercomputers, scientists have created the first complete, 3D visualization of a mountain-size rock called the Kumano Pluton buried miles beneath the coast of southern Japan. They can now see the rock could be acting like a lightning rod for the region’s megaquakes, diverting tectonic energy into points along its sides where several of the region’s largest earthquakes have happened.
Scientists have known about the pluton for years but were aware of only small portions of it. Thanks to new research by an international team of scientists led by The University of Texas at Austin, researchers now have a view of the entire subterranean formation and its effect on the region’s tectonics.
The findings will provide critical information for a major new Japanese government-funded project to find out whether another major earthquake is building in the Nankai subduction zone, where the pluton is located, said Shuichi Kodaira, director of the Japan Agency for Marine-Earth Science and Technology and a co-author of the study published Feb. 3 in the journal Nature Geoscience.
“We cannot predict exactly when, where, or how large future earthquakes will be, but by combining our model with monitoring data, we can begin estimating near-future processes,” said Kodaira, who was among the scientists who first spotted signs of the Kumano Pluton in 2006. “That will provide very important data for the Japanese public to prepare for the next big earthquake.”
The full extent of the Kumano Pluton was revealed using the LoneStar5 supercomputer at UT’s Texas Advanced Computing Center to piece together 20 years of seismic data into a single high-definition 3D model.
“The fact that we can make such a large discovery in an area that is already well studied is, I think, eye opening to what might await at places that are less well monitored,” said Adrien Arnulf, a research assistant professor at the University of Texas Institute for Geophysics and the study’s lead author.
The model shows the region around the Nankai subduction zone, with the Earth’s crust bending under the pluton’s weight. In another unexpected finding, the pluton was seen diverting buried groundwater into the Earth’s interior. The researchers think the pluton’s interference with the wider subduction zone is influencing the tectonic forces that cause earthquakes.
Seismic imaging uses sound waves to create pictures of the Earth’s subsurface. Over the years, Japan’s vast network of sensors has collected millions of seismic recordings from thousands of locations along the Nankai subduction zone. The sensors are primarily used to record earthquakes and tremors, but the team widened their search to include chance recordings of passing scientific surveys using a technique Arnulf and coauthor Dan Bassett, a research scientist at GNS Science, had perfected while working on small-scale projects in New Zealand. The researchers compiled the massive amounts of information into a single data set and turned it into a 3D model with the help of LoneStar5.
In addition to shedding light on how the pluton may be influencing how and where earthquakes occur, the study is a major demonstration of how big data could revolutionize earthquake science. Arnulf envisions the same methods being used to make regional-scale images in other areas, such as northeast Japan, New Zealand, and Cascadia in the U.S. Pacific Northwest — all of which have subduction zones known to host the Earth’s largest earthquakes.
The research was funded by the U.S. National Science Foundation. Additional co-authors include scientists at Scripps Institution of Oceanography at the University of California, San Diego. UTIG is a research unit of the UT Jackson School of Geosciences.
Reference:
Adrien F. Arnulf, Dan Bassett, Alistair J. Harding, Shuichi Kodaira, Ayako Nakanishi, Gregory Moore. Upper-plate controls on subduction zone geometry, hydration and earthquake behaviour. Nature Geoscience, 2022; DOI: 10.1038/s41561-021-00879-x
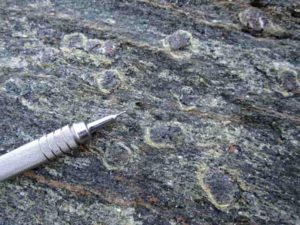
Minerals are visible in rock samples from the coast of Oman. Scientists said these rocks may reveal new information about subduction, an important tectonic process on Earth. Credit: Joshua Garber / Penn State.
Ancient rocks on the coast of Oman that were once driven deep down toward Earth’s mantle may reveal new insights into subduction, an important tectonic process that fuels volcanoes and creates continents, according to an international team of scientists.
“In a broad sense this work gives us a better understanding of why some subduction zones fail while others set up as long-term, steady-state systems,” said Joshua Garber, assistant research professor of geosciences at Penn State.
Subduction occurs when two tectonic plates collide, and one is forced under the other. Where oceanic and continental plates meet, the denser oceanic plates normally subduct and descend into the mantle, the scientists said.
Occasionally, oceanic plates move on top, or obduct, forcing continental plates down toward the mantle instead. But the buoyancy of the continental crust can cause the subduction to fail, carrying the material back toward the surface along with slabs of oceanic crust and upper mantle called ophiolites, the scientists said.
“The Samail Ophiolite on the Arabian Peninsula is one of the largest and best exposed examples on the surface of the Earth,” Garber said. “It’s one of the best studied, but there have been disagreements about how and when the subduction occurred.”
The team, led by Penn State scientists, investigated the timing of the subduction using nearby rocks from the Saih Hatat formation in Oman, which was subducted under the Samail Ophiolite, according to the researchers.
Heat and pressure from the process created garnet, zircon and rutile crystals in a key suite of highly metamorphosed rocks that saw the most extreme conditions during subduction. Using state-of-the-art dating techniques, including measuring isotopic dates and trace elements, the scientists determined these minerals all formed at roughly the same time 81 to 77 million years ago.
“What’s interesting about this is that they were all dated by slightly different methods, but they all gave us essentially the same results,” Garber said. “This tells us that all the minerals in the rocks have a coherent story. They all record the same metamorphic episode at the same time.”
The findings, published in the Journal of Geophysical Research: Solid Earth, dispute previous results that estimated the event began 110 million years ago and happened in separate phases, the scientists said.
“What our findings suggest is that this continental material was not subducted deep into the mantle a long time before the ophiolite formed as previously thought,” Garber said. “Our data supports a nice sequence of events that happened in a tighter window and that makes more geological sense.”
The scientists said the subduction of the continental margin occurred after the obduction of the Samail Ophiolite. The most deeply subducted continental material was likely anchored to more dense rocks, and when this anchor broke, the buoyant continental rocks exhumed, first quickly, and then slowly during a lengthy residence in the lower to middle crust. It eventually become exposed in tectonic windows through the ophiolite.
“Subduction is a really big part of plate tectonics on Earth,” Garber said. “It’s the major recycling mechanism for surface material to the deeper mantle, so understanding how they eventually evolve into stable subduction zones or how they end very quickly is of great interest. I think here we’ve nailed down why this subduction zone ended and the sequence of events that came with it.”
Also contributing to this work from Penn State was Andrew Smye, assistant professor of geosciences.
Matthew Rioux, assistant teaching professor, Bradley Hacker, professor emeritus, and Andrew Kylander-Clark, senior development engineer, at the University of California, Santa Barbara; Michael Searle, professor at Oxford University; Jeff Vervoort, professor at Washington State University; and Clare Warren, professor at the Open University also contributed.
The National Science Foundation and an ExxonMobil/Geological Society of America graduate student research grant provided funding.
Reference:
Joshua M. Garber, Matthew Rioux, Michael P. Searle, Andrew R. C. Kylander‐Clark, Bradley R. Hacker, Jeff D. Vervoort, Clare J. Warren, Andrew J. Smye. Dating Continental Subduction Beneath the Samail Ophiolite: Garnet, Zircon, and Rutile Petrochronology of the As Sifah Eclogites, NE Oman. Journal of Geophysical Research: Solid Earth, 2021; 126 (12) DOI: 10.1029/2021JB022715
Note: The above post is reprinted from materials provided by Penn State. Original written by Matthew Carroll.
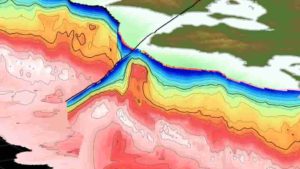
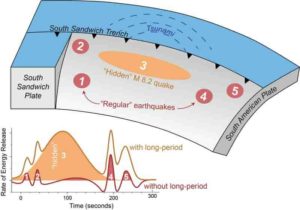
A magnitude 8.2 earthquake was “hidden” within a magnitude 7.5 earthquake in 2021, sending a mysterious tsunami around the world, according to a new study in Geophysical Research Letters. Credit: Zhe Jia and AGU
Scientists have uncovered the source of a mysterious 2021 tsunami that sent waves around the globe.
In August 2021, a magnitude 7.5 earthquake hit near the South Sandwich Islands, creating a tsunami that rippled around the globe. The epicenter was 47 kilometers below the Earth’s surface—too deep to initiate a tsunami—and the rupture was nearly 400 kilometers long, which should have generated a much larger earthquake.
Seismologists were puzzled and sought to understand what really happened that day in the remote South Atlantic.
A new study revealed the quake wasn’t a single event, but five, a series of sub-quakes spread out over several minutes. The third sub-quake was a shallower, slower magnitude 8.2 quake that hit just 15 kilometers below the surface. That unusual, “hidden” earthquake was likely the trigger of the worldwide tsunami.
The study was published in the AGU journal Geophysical Research Letters, which publishes short-format, high-impact papers with implications that span the Earth and space sciences.
Because the South Sandwich Islands earthquake was complex, with multiple sub-quakes, its seismic signal was difficult to interpret, according to lead study author Zhe Jia, a seismologist at the California Institute of Technology. The magnitude 8.2 quake was hidden within the tangle of seismic waves, which interfered with each other over the course of the event. The hidden quake’s signal wasn’t clear until Jia filtered the waves using a much longer period, up to 500 seconds. Only then did the 200-second-long quake, which Jia said accounted for over 70% of the energy released during the earthquake, become clear.
“The third event is special because it was huge, and it was silent,” Jia said. “In the data we normally look at [for earthquake monitoring], it was almost invisible.”
Predicting hazards for complex earthquakes can be difficult, as the South Sandwich Islands quake demonstrates. The USGS initially reported the magnitude 7.5 quake and only added the 8.2 event the following day, as the surprise tsunami lapped on shores up to 10,000 kilometers away from its point of origin.
“We need to rethink our way to mitigate earthquake-tsunami hazards. To do that, we need to rapidly and accurately characterize the true size of big earthquakes, as well as their physical processes,” Jia said.
Because this type of earthquake can result in unexpected tsunami, it’s critical to improve our predictions. “With these complex earthquakes, the earthquake happens and we think, ‘Oh, that wasn’t so big, we don’t have to worry.’ And then the tsunami hits and causes a lot of damage,” said Judith Hubbard, a geologist at the Earth Observatory of Singapore who was not involved in the study. “This study is a great example of how we can understand how these events work, and how we can detect them faster so we can have more warning in the future.”
Sneaky seismic signals
When an earthquake hits, it sends waves of vibration through the Earth. The global network of earthquake monitors uses those seismic waves to pinpoint the time, location, depth and magnitude of an earthquake. Common monitoring often focuses on short- and medium-periods of waves, Jia said, and longer periods can be left out. But even incorporating long periods into monitoring, on its own, isn’t enough to catch complex earthquakes with messy seismic signals.
“It’s hard to find the second earthquake because it’s buried in the first one,” Jia said. “It’s very seldom complex earthquakes like this are observed. … And if we don’t use the right dataset, we cannot really see what was hidden inside.”
A simple earthquake can easily be pinpointed and described, Jia said. But a messy one needs to be carefully broken down into its constituent parts, to find out what unique combination of simpler earthquakes built up the complex one.
Jia and his colleagues developed an algorithm to tease apart the seismic signals during those messy earthquakes. By “decomposing” complex earthquake signals into simpler forms, using waves over different periods (varying from 20 to 500 seconds long), the algorithm can identify the location and properties of different sub-earthquakes. It’s akin to someone with perfect pitch hearing five dissonant notes struck at once, yet being able to identify each individual note.
“I think a lot of people are daunted by trying to work on events like this,” said Hubbard. “That somebody was willing to really dig into the data to figure it out is really useful.”
Both Jia and Hubbard noted a long-term goal is to automate the detection of such complex earthquakes, as we can for simple earthquakes. For the 2021 quake, the tsunami was small by the time it reached shores, and most of the permanent residents of the remote, volcanic islands are penguins. But complex earthquakes can pose significant hazards if they generate larger tsunami or strike in a densely populated region.
Reference:
Zhe Jia et al, The 2021 South Sandwich Island M w 8.2 Earthquake: A Slow Event Sandwiched Between Regular Ruptures, Geophysical Research Letters (2022). DOI: 10.1029/2021GL097104
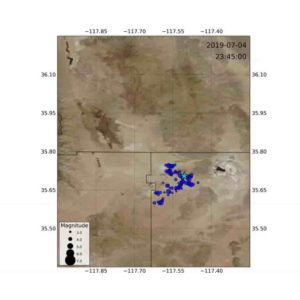
A series of earthquakes and aftershocks shook the Ridgecrest area in Southern California in 2019. Distributed acoustic sensing (DAS) using fiber-optic cables enables high-resolution subsurface imaging, which can explain the observed site amplification of earthquake shaking. Credit: Yang et al., 2022
How much the ground moves during an earthquake strongly depends on properties of rock and soil just beneath Earth’s surface. Modeling studies suggest that ground shaking is amplified in sedimentary basins, on which populated urban areas are often located. However, imaging near-surface structure around urban areas at high resolution has been challenging.
Yang et al. have developed a new approach of using distributed acoustic sensing (DAS) to construct a high-resolution image of near-surface structure. DAS is an emerging technique that can transform existing fiber-optic cables into seismic arrays. By monitoring changes in how light pulses scatter as they travel through the cable, scientists can calculate small strain changes in the material surrounding the fiber. In addition to recording earthquakes, DAS has proven useful in a variety of applications, such as naming the loudest marching band at the 2020 Rose Parade and uncovering dramatic changes in vehicular traffic during COVID-19 stay-at-home orders.
Prior researchers repurposed a 10-kilometer stretch of fiber to detect aftershocks following the magnitude 7.1 Ridgecrest earthquake in California in July 2019. Their DAS array detected about six times as many small aftershocks as conventional sensors did during a 3-month period.
In the new study, the researchers analyzed continuous seismic data produced by traffic. The DAS data allowed the team to develop a near-surface shear velocity model with a subkilometer resolution two orders of magnitude higher than typical models. This model revealed that along the length of the fiber, sites where aftershocks produced more ground motion generally corresponded with where shear velocity was lower.
Such fine-scale seismic hazard mapping could improve urban seismic risk management, especially in cities where fiber-optic networks may already be present, the authors suggest.
Reference:
Yan Yang et al, Sub‐Kilometer Correlation Between Near‐Surface Structure and Ground Motion Measured With Distributed Acoustic Sensing, Geophysical Research Letters (2021). DOI: 10.1029/2021GL096503
The edges of Earth’s tectonic plates, centered over the Pacific Ocean. Colors indicate whether plates are scraping past (yellow), diving under (green), or pulling away (red) from one another. Study site near New Zealand marks the location of a newly forming subduction zone. Credit: Brandon Shuck/University of Texas Institute for Geophysics
One longstanding enigma in geology is how one tectonic plate can break Earth’s rock-hard shell and begin diving under another in the process known as subduction.
Now, a new study describes how a small break in one tectonic plate was squeezed and pulled over millions of years until it unzipped and set in motion a runaway geologic process. The study, of an emerging subduction zone off New Zealand, was just published in the journal Nature Geoscience.
“We now know how subduction nucleated and how fast it’s growing,” said lead author Brandon Shuck. “That’s important to know because subduction is the main driver of plate tectonics. It builds mountains, forms new oceans and drives chemical cycling from the deep earth all the way to the atmosphere.” Shuck did the work for his doctoral thesis at the University of Texas Jackson School of Geosciences; he is now a postdoctoral research scientist at Columbia University’s Lamont-Doherty Earth Observatory.
Earth is believed to be the only planet in the Solar System to undergo subduction, which is key to the cycling of carbon that makes life possible here. “We do believe that subduction didn’t always happen on Earth, so understanding how [it] initiates today is a critical step to understanding how our world eventually became a habitable planet,” said the study’s coauthor Harm Van Avendonk, a senior research scientist at the University of Texas.
The research began in 2018 aboard Lamont-Doherty’s research vessel Marcus G. Langseth off New Zealand, where Shuck and his shipmates endured weeks of bad weather to gather detailed seismic images of the seafloor.
Onshore, Shuck matched the images with rock samples from other ocean expeditions. This provided a geologic timeline to reconstruct an unzipping plate. According to his reconstruction, a small break appeared in the Australian plate around 16 million years ago, which slowly grew as it collided with other tectonic plates. When the break had unzipped far enough, the heavier portion of the plate broke through the earth’s rocky shell (known as the lithosphere), setting it on a downward conveyor that has continued for the last 8 million years. Today, the new subducting margin is about 300 miles long.
“That’s pretty small at the scale of global tectonics,” Shuck said. “But it’s going to keep growing all the way down to Antarctica.” he predicted. “Once it gets that big, more than 1,000 miles long, it could change the motion of neighboring tectonic plates.”
For now, the only sign on the surface is a handful of volcanoes near New Zealand’s South Island. Most emerged in the last hundred thousand years. They are likely to grow into a longer volcanic chain as the split spreads south in the future, Shuck said.
Shuck’s study reconciles two opposing ideas about how subduction starts: with the gradual back and forth of plates bumping against one another, or by plates spontaneously and rapidly collapsing under their own weight. The new research suggests that sometimes the two ideas might both be part of the equation.
“The work shows that there may, instead, be multiple scenarios driving subduction initiation,” said Fabio Crameri, a Swiss geophysicist who wrote a Nature Geoscience commentary accompanying the study. “Even if the same scenario isn’t true for every subduction zone, their model challenges our current systems for classifying subduction zone initiation and highlights the need for 4D modeling.”
Reference:
Brandon Shuck et al, Stress transition from horizontal to vertical forces during subduction initiation, Nature Geoscience (2022). DOI: 10.1038/s41561-021-00880-4
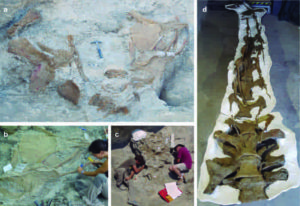
Images of different fossil remains of Abditosaurus kuehnei at the Orcau-1 site (a), the excavation process (b and c) and the neck after fossil preparation (d).
Researchers from the Institut Català de Paleontologia Miquel Crusafont (ICP), the Conca Dellà Museum (MCD), the Universitat Autònoma de Barcelona (UAB), the University of Zaragoza (UNIZAR) and the NOVA University of Lisbon (UNL) have described the new species of titanosaur dinosaur Abditosaurus kuehnei from the remains excavated at the Orcau-1 site, in the southern Pyrenees (Catalonia, Spain). The semiarticulated 70.5-million-year-old skeleton is the most complete specimen of this herbivorous group of dinosaurs discovered so far in Europe. Moreover, Abditosaurus is the largest titanosaur species found in the Ibero-Armorican island — an ancient region nowadays comprising Iberia and the south of France — representing a senescent individual estimated to be 17,5 meters in length with body mass of 14,000 kg.
The size of this giant is one of the most surprising facts to researchers. “Titanosaurs from the Upper Cretaceous of Europe tend to be small or medium-sized due to their evolution in insular conditions,” explained Bernat Vila, paleontologist at the ICP leading the research. During the Upper Cretaceous (between 83 and 66 million years ago), Europe was a large archipelago made up of dozens of islands. The species that evolved there tend to be relatively small, or even dwarves compared to their relatives living in large landmasses, due primarily to the limitation of food resources in islands. “It is a recurring phenomenon in the history of life on Earth, we have several examples worldwide in the fossil record of this evolutionary trend. That’s why we were astonished by the large dimensions of this specimen,” said Vila.
The fieldwork conducted over several decades unearthed 53 skeletal elements of the specimen. These include several teeth, vertebrae, ribs, and limb, scapular and pelvic bones, as well as a semiarticulated fragment of the neck formed by 12 cervical vertebrae. “We were really lucky, it is unusual to find such complete specimens in the Pyrenees due to its troubled geologic history,” explains Àngel Galobart, ICP researcher and director of the Conca Dellà Museum (Isona, Catalonia).
The excavation of the neck in 2014 was a technical challenge. Once prepared for extraction, the neck was encased in a large block of polyurethane foam, becoming one of the largest jackets ever excavated in Europe.
The history of the research that has led to the description of the new species dates back to 1954, when German paleontologist Walter Kühne collected the first remains and sent them to Madrid. The site fell into oblivion until 1986, when some more remains began to be extracted until a great storm forced the cancellation of the excavation. Subsequently, fieldwork on the site fell again into oblivion until a paleontologist from the ICP resumed systematic excavations in Orcau-1. The story of this finding was featured in the 2017 documentary “Europe’s last giant.” The generic name Abditosaurus means ‘forgotten reptile’ and the specific epithet kuehnei is a tribute to its discoverer.
A migrating dinosaur
In their article published in Nature Ecology & Evolution, researchers conclude that Abditosaurus belongs to a group of saltasaurine titanosaurs from South America and Africa, different from the rest of European titanosaurs that are characterized by a smaller size. These authors hypothesize that the Abditosaurus lineage reached the Ibero-Armorican island taking advantage of a global drop in sea level that reactivated ancient migration routes between Africa and Europe.
“Other evidence support the migration hypothesis,” explains Albert Sellés, paleontologist at the ICP and co-author of the article. “In the same site we have found eggshells of dinosaur species known to have inhabited Gondwana, the southernmost continent.”
The new finding is a major advance in the understanding of the evolution of sauropod dinosaurs at the end of the Cretaceous and brings a new perspective to the phylogenetic and paleobiogeographic puzzle of sauropods in the last 15 million years before their extinction.
In addition to Vila, Sellés and Galobart, Novella Razzolini (Institut Català de Paleontologia Miquel Crusafont and Conca Dellà Museum), Miguel Moreno (Museu de Lurinhã and NOVA University of Lisbon), Iñaki Canudo (Aragosaurus-IUCA Group, University of Zaragoza) and Alejandro Gil (Universitat Autònoma de Barcelona) participated in this study.
“During the Jurassic and Cretaceous, Iberia was the point of connection between Eurasia, Africa and North America. Studying how Abditosaurus relates to the fauna of these continents helps us to understand when there were connections between them, and when they became isolated,” says Miguel Moreno, researcher at the Museu de Lurinhã and NOVA University of Lisbon that has performed the paleobiogeographic study.
The large Cretaceous herbivores
Titanosaurs are a group of sauropod dinosaurs that become very diverse and abundant in the terrestrial ecosystems of the Cretaceous. All of them were quadrupeds and phytophagous. Titanosaurs had a small and pointed skull, with small nail-shaped teeth used to uproot vegetation. Their body was robust, with forelimbs shorter than the hindlimbs and a long necks and tails. Some species sported a skin covered with bony plates named osteoderms that may have served as a protective shield or as a reserve of calcium.
The paleontological sites within the Catalan Pyrenees have provided exceptional dinosaur fossils over the last century. Research is especially significant as its fossil record includes the last vertebrate faunas, including non-avian dinosaurs, that lived in Europe right before the global extinction event that took place 66 million years ago.
On the ICP: The Institut Català de Paleontologia Miquel Crusafont (ICP) is a CERCA center (Centres de Recerca de Catalunya, Generalitat de Catalunya) ascribed to to the Universitat Autònoma de Barcelona (UAB) and devoted to research in vertebrate and human paleontology at the highest international level, as well as the conservation and dissemination of the Catalan paleontological heritage. It is constituted as a public foundation with a board of trustees made up of the Government of Catalonia and the UAB.
Reference:
Bernat Vila, Albert Sellés, Miguel Moreno-Azanza, Novella L. Razzolini, Alejandro Gil-Delgado, José Ignacio Canudo, Àngel Galobart. A titanosaurian sauropod with Gondwanan affinities in the latest Cretaceous of Europe. Nature Ecology & Evolution, 2022; DOI: 10.1038/s41559-021-01651-5
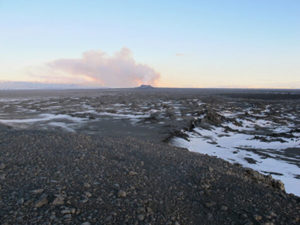
A view of the graben, which emerged near the Holuhraun lava field in Iceland. The western boundary of the graben is seen in the foreground, in the center-right portion of the image, where the land begins to dip down. Credit: Stephan Kolzenburg
At the boundaries between tectonic plates, narrow rifts can form as Earth’s crust slowly pulls apart.
But how, exactly, does this rifting happen?
Does pressure from magma rising from below ground force the land apart? Or is a rift just a rip, created mainly by the pulling motion of tectonic plates that are drifting away from each other?
A study in the journal Geology explores these questions and sheds new light on how this process works.
Past research has pointed to magma as a key driver in rifting events. But as the new findings highlight, “We have to be a bit more nuanced and acknowledge that rift processes do not have to operate identically across the entire globe,” says lead scientist Stephan Kolzenburg, Ph.D., assistant professor of geology in the University at Buffalo College of Arts and Sciences.
Study tells the story of a newly formed rift in Iceland
The new study was published in November 2021. It describes how a trench-like structure called a rift-graben opened in 2014 in Iceland near what is now known as the Holuhraun lava field, in a region that straddles the tectonic boundary between the North American and Eurasian plates. A graben forms when a chunk of land sags downward as the land on both sides of it moves away, creating a chasm called a rift.
The team concluded that in this particular case, the slow drift of tectonic plates, and not pressure from a magma chamber along the rift, was the driver.
The graben formed within a period of a few days, and then, “it just stayed like that, and it didn’t care about anything else that happened in the magmatic plumbing system,” Kolzenburg says. “The graben was remarkably stable even though lots of dynamic processes were happening underneath, such as pressure changes in the magmatic feeder system of the eruption.”
Magma leaked through the rift once it was open, but that magma didn’t appear to be the main force behind the initial creation of the rift, Kolzenburg says.
The study benefited from the work of an international group of scientists who had been closely monitoring Holuhraun and the surrounding region, documenting seismic activity and the volume of magma emerging during a period of unrest from 2014-15. Kolzenburg’s team compared this information to digital elevation models that detailed how the area’s topography changed over time, capturing the graben’s sudden appearance and tracking the landscape for nearly five years after the graben’s formation.
Not all rifts are created the same way
The findings apply specifically to the graben the team studied. In other rift zones, different dynamics may be at play, including in the Afar Region of Ethiopia, where magma is believed to play a more important role in driving rift formation, Kolzenburg says.
As he and co-authors write in their 2021 paper in Geology, “In concert, the data suggest that while some rifts may be magmatically controlled, not all rift zones require the presence of a deep-seated pressurized magma chamber to control their dynamics.”
The study was a collaboration between Kolzenburg, Julia Kubanek at the European Space Agency, Mariel Dirscherl and Ernst Hauber at the German Aerospace Center, Christopher W. Hamilton at the University of Arizona, Stephen. P. Scheidt at Howard University and Ulrich Münzer at Ludwig-Maximilians-Universität.
Reference:
S. Kolzenburg et al, Solid as a rock: Tectonic control of graben extension and dike propagation, Geology (2021). DOI: 10.1130/G49406.1
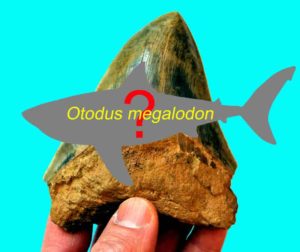
True body shape of the ancient Megalodon remains a mystery. (Phillip Sternes/UCR/DePaul)
A new study leaves large tooth marks in previous conclusions about the body shape of the Megalodon, one of the largest sharks that ever lived.
The study, which makes use of a pioneering technique for analyzing sharks, has now been published in the international journal Historical Biology.
Megalodons swam the Earth roughly 15 to 3.6-million years ago, and are often portrayed as super-sized monsters in films such as 2018’s “The Meg.” While there is no dispute that they existed or that they were gigantic, Otodus megalodon are known only from their fossilized teeth and vertebrae. Based on this evidence, studies suggest they reached lengths of up to 65 feet.
Unfortunately, additional fossil evidence from which to draw conclusions about their bodies, such as a complete skeleton, has not yet been discovered.
“The cartilage in shark bodies doesn’t preserve well, so there are currently no scientific means to support or refute previous studies on O. megalodon body forms,” said Phillip Sternes, a UCR organismal biologist and lead author on the study.
Traditionally, researchers have modeled Megalodon bodies on those of modern great white sharks. Great whites are partially warm blooded and belong to the lamniform shark order. Megalodons also belong to this order, and it is believed they shared this partial warm bloodedness with great whites.
It was previously thought having some warm blood is an advantage that could expand sharks’ swimming range, unlike other fish dependent on water temperature. However, it is now believed to increase swimming speed.
“Great whites are among the fastest swimming sharks, so Megalodons were likely also big, fast sharks you would not want to run into in the open ocean,” said Sternes.
There are eight families of Lamniformes, and 15 species. Previous research took five species of warm-blooded Lamniformes, averaged their fin and body shapes and proposed a general model for Megalodons.
Sternes and his colleagues wanted to understand whether the five species used to determine Megalodon’s shape differed somehow from the rest of the order, which includes some sharks that are cold blooded.
The researchers compared the five species to each other, and to the rest of the lamniform order. Using detailed field guide drawings, they performed quantitative comparisons of the sharks’ fin, head and body shapes.
They found no general patterns that would allow them to tease out body shape differences.
“Warm bloodedness does not make you a differently shaped shark,” Sternes said. “I encourage others to explore ideas about its body shape, and to search for the ultimate treasure of a preserved Megalodon fossil. Meanwhile, this result clears up some confusion about previous findings and opens the door to other ideas once again.”
While others typically use actual organisms or photos of organisms for such comparisons, Sternes pioneered the use of this two-dimensional drawing technique on sharks.
“The purpose of field guides is to identify a species, so the drawings must be accurate representations,” he said. “It’s a technique widely used in biology and works well for sharks since some specimens exist only in remote places.”
Sternes hopes that others use the technique to study snakes, birds and other animals with specimens that may be difficult to collect. He also hopes others will continue to search for a better understanding of the Megalodon.
“This study may appear to be a step backward in science,” said Kenshu Shimada, study co-author and DePaul University paleobiology professor. “But the continued mystery makes paleontology, the study of prehistoric life, a fascinating and exciting scientific field.”
Reference:
Phillip C. Sternes, Jake J. Wood, Kenshu Shimada. Body forms of extant lamniform sharks (Elasmobranchii: Lamniformes), and comments on the morphology of the extinct megatooth shark, Otodus megalodon, and the evolution of lamniform thermophysiology. Historical Biology, 2022; 1 DOI: 10.1080/08912963.2021.2025228
Traces of paleotsunami at the lowland of the Ube River, Noda Village. The Sanriku Coast has been hit by tsunamis throughout its history, leaving behind tsunami deposits. Credit: Tohoku University
A research group comprising members from Tohoku University, Hokkaido University and the University of Tokyo have developed a high-resolution radiocarbon dating method that can accurately date tsunami deposits, offering a vital window into past disasters and enabling scientists to better understand how frequently tsunamis occur.
Tsunami deposits offer scientists important information on tsunamis that struck before records began. They reveal the frequency and size of tsunamis. But sometimes the sediment has been washed away or is incomplete.
The 2011 Great East Japan Earthquake and Tsunami thrust the Tohoku region into the international spotlight. Yet the area has been prone to earthquakes and tsunamis throughout its history.
Still, scientists are divided on what tsunamis reached the Sanriku Coast — the stretch of northeastern coastline along present day Iwate and parts of Aomori and Miyagi. Inconclusive data rendered scientists unable to determine whether sediments from the Sanriku Coast belong to the 1611 Keicho Oshu Tsunami or the 1454 Kyotoku Tsunami.
Tohoku University assistant professor Takashi Ishizawa, who led the research group, and his team applied their radiocarbon dating method to a village situated in Iwate Prefecture.
“The village of Noda is strategic for two reasons,” says Ishizawa. “Tsunami deposits formed between the 14th and 17th centuries have been preserved there, and Noda has inland areas where only giant tsunamis are capable of inundating.”
Analyzing the data, in addition to comparing the tsunami records from the surrounding area, the researchers determined that sediment belonged to the 1611 Keicho Oshu Tsunami, not the 1454 Kyotoku Tsunami.
Moreover, they found the prevalence of giant tsunamis since the 1611 Keicho Oshu Tsunami occurred at intervals between 100 to 200 years.
Ishizawa and his team are looking to apply this method to other locations, including the Sendai Plain to reconstruct a more reliable history of tsunamis along the entire Japan Trench.
Reference:
Takashi Ishizawa, Kazuhisa Goto, Yuichi Nishimura, Yosuke Miyairi, Chikako Sawada, Yusuke Yokoyama. Paleotsunami history along the northern Japan trench based on sequential dating of the continuous geological record potentially inundated only by large tsunamis. Quaternary Science Reviews, 2022; 279: 107381 DOI: 10.1016/j.quascirev.2022.107381
University of Manchester research fellow David Legg, in collaboration with a team of international scientists from China, Switzerland, and Sweden, has today announced a new fossil that reveals the origin of gills in arthropods.
Arthropods, the group of animals that includes creepy crawlies like spiders and woodlice, are the largest phylum in the animal kingdom and are found everywhere from the deepest ocean trench to the top of Mount Everest.
Research published today shows the newest addition to the group is a 520-million-year-old (about 10 times as old as the dinosaurs) organism called Erratus sperare. Erratus sperare was discovered in the Chengjiang Fossil Site, a UNESCO World Heritage Site located in Yunnan, China. The Chengjiang Fossil Site preserves an ancient underwater ecosystem which included the relatives of some well-known arthropod fossils like trilobites and anomalocarids.
Modern water dwelling arthropods have biramous limbs, legs that have two parts — one for breathing and one for walking — but how such specialised limbs evolved was a mystery. Some of the earliest fossil arthropods, like Anomalocaris, had swimming flaps that may have doubled as gills, but until now researchers didn’t know how arthropods made the jump from these specialised flaps to the biramous limbs of modern arthropods.
Erratus sperare provides the missing link between arthropods that used such specialised flaps and arthropods with biramous limbs. It has both legs and flaps.
Dr David Legg, one of the authors of this study, said: “Fish aren’t the only organisms that have gills! Arthropods have gills too… they just have them on their legs. When it came to arthropods, however, we just weren’t sure where these gills came from.
“Thanks to this new fossil, Erratus sperare, we now have a much clearer idea. These gills also probably went on to evolve into the wings of insects and the lungs of terrestrial arthropods like spiders so were a very important innovation.”
Reference:
Dongjing Fu, David A. Legg, Allison C. Daley, Graham E. Budd, Yu Wu, Xingliang Zhang. The evolution of biramous appendages revealed by a carapace-bearing Cambrian arthropod. Philosophical Transactions of the Royal Society B: Biological Sciences, 2022; 377 (1847) DOI: 10.1098/rstb.2021.0034
When you walk about your yard on a wet day, do your shoes stick in the mud? Could you make ceramic pots out of the soil in your garden? If the answers are yes to both, odds are you have clay soil, one of the biggest challenges for the home gardener.
Clay soils in the Willamette Valley are the result of geologic actions that took place during the end of the last ice age—some 10,000–14,000 years ago, said Linda Brewer, senior faculty research assistant in Oregon State University’s College of Agricultural Sciences. Repeated flooding on an apocalyptic scale overflowed into what is today the Willamette Valley.
Very fine clay particles take far longer to settle out of water than larger sand and silt particles, Brewer explained. On average, these larger particles settled out further north in the valley, although clays can certainly be found in the Portland area. The largest clay particle is more than 1,000 times smaller than the smallest sand particle. Gravity causes these larger particles to settle out first.
Clay soils are difficult to work up and develop into a good seedbed. Dry clay tends to be very hard and, if wet, it tends to be very sticky and difficult to manage. But clay soils have their attributes, Brewer said. Clay particles are so small that they have slight electrical charges. These charges hold on to plant nutrients, far better than sand. Clay soils also store large amounts of water in the very fine spaces between their particles. This ability contributes to their stickiness and plasticity.
However, this water, held in such small pores, becomes difficult for plants to take up as the soil dries. Sandy soils drain readily because the spaces between the particles of sand are much larger.
Bark, manure, leaf mold and compost are among the organic amendments commonly used to improve clay soil, Brewer noted. Applied to the soil surface, these materials form a protective blanket that slows evaporation and reduces soil hardening.
It’s common for people to want to rototill or dig these materials into their garden beds, Brewer said, but experience has shown that the best and easiest way is to apply two or three inches of organic materials to garden beds, without trying to mix them in.
“Like diamonds, clay soils are highly structured at the atomic level,” Brewer said. “No amount of sand added to a clay soil will change its texture. The large sand particles provide a surface onto which the tiny clay particles adhere. The result can be more difficult to manage than the original clay.
“Think of the action of a potter’s hands on the clay as the potter’s wheel turns. The potter pulls the clay against the rotation of the wheel. In addition to shaping the clay, this action aligns the individual clay particles, and increases the strength of the clay. I emphatically recommend against rototilling sand or vermiculite into clay soils. The action of the tiller is like the action of the potter’s wheel.”
Organic matter serves as food for earthworms, insects, bacteria and fungi that transform it to soil nutrients and humus. These soil dwellers decompose and break down organic matter. Decomposer bacteria give off “glues” that aggregate soil particles, improving drainage and make the soil easier to work.
When a large amount of organic material is added to the soil under warm and moist conditions, microorganisms multiply rapidly. Since they construct their bodies from the same nutrients that plants use, in the short term, they compete with plants for nutrients. Composted materials have been at least partially broken down and may have more nutrients available when applied.
To overcome the temporary lack of nutrients, gardeners might try adding low-nitrogen organic material like wood chips to the soil in the autumn, or smaller amounts at a time in the spring, when warm weather will hasten break down. Or apply a complete organic fertilizer as a source of nutrients.
Remember that nitrogen is highly soluble in water, Brewer said. Manures, which are high in nitrogen, should be added only when there are actively growing roots able to take up nitrogen. Applying manure in the autumn is a wasted effort. In areas with high-rainfall winters, the nitrogen will have run off or leached below the rooting zone by spring.
Gypsum—calcium sulfate—is an amendment that improves clay soils. After exposure to water, the calcium sulfate molecule will dissociate. Free calcium ions have a positive charge that attracts the negatively charged clay particles, encouraging aggregation. Ammonium lauryl sulfate is a surfactant that can encourage infiltration of water into dried clay, and may make it easier to mechanically aerate clay soils. Their commercial reputation as a “spray on aerator” is an exaggeration, Brewer said.
Fertile soil with good tilth does not come about with a single or even several additions of organic material, but from a consistent soil-building program.
“Repeated additions of organic matter do change clay soils, but these additions must be at least annual in order to maintain the changes,” Brewer said. “And the soil will remain clay—forever.”
Rapid erosion of supermountains released large amounts of nutrients, which were eventually carried into the oceans. Photo: Peter Campbell
Giant mountain ranges at least as high as the Himalayas and stretching up to 8,000 kilometres across entire supercontinents played a crucial role in the evolution of early life on Earth, according to a new study by researchers at The Australian National University (ANU).
The researchers tracked the formation of these supermountains throughout Earth’s history using traces of zircon with low lutetium content — a combination of mineral and rare earth element only found in the roots of high mountains where they form under intense pressure.
The study found the most giant of these supermountains only formed twice in Earth’s history — the first between 2,000 and 1,800 million years ago and the second between 650 and 500 million years ago. Both mountain ranges rose during periods of supercontinent formation.
Lead author, ANU PhD candidate Ziyi Zhu, said there are links between these two instances of supermountains and the two most important periods of evolution in Earth’s history.
“There’s nothing like these two supermountains today. It’s not just their height — if you can imagine the 2,400 km long Himalayas repeated three or four times you get an idea of the scale,” she said.
“We call the first example the Nuna Supermountain. It coincides with the likely appearance of eukaryotes, organisms that later gave rise to plants and animals.
“The second, known as the Transgondwanan Supermountain, coincides with the appearance of the first large animals 575 million years ago and the Cambrian explosion 45 million years later, when most animal groups appeared in the fossil record.”
Co-author Professor Jochen Brocks said: “What’s stunning is the entire record of mountain building through time is so clear. It shows these two huge spikes: one is linked to the emergence of animals and the other to the emergence of complex big cells.”
When the mountains eroded they provided essential nutrients like phosphorus and iron to the oceans, supercharging biological cycles and driving evolution to greater complexity.
The supermountains may also have boosted oxygen levels in the atmosphere, needed for complex life to breathe.
“The early Earth’s atmosphere contained almost no oxygen. Atmospheric oxygen levels are thought to have increased in a series of steps, two of which coincide with the supermountains,” Ms Zhu said.
“The increase in atmospheric oxygen associated with the erosion of the Transgondwanan Supermountain is the largest in Earth’s history and was an essential prerequisite for the appearance of animals.”
There is no evidence of other supermountains forming at any stage between these two events, making them even more significant.
“The time interval between 1,800 and 800 million years ago is known as the Boring Billion, because there was little or no advance in evolution,” co-author Professor Ian Campbell said.
“The slowing of evolution is attributed to the absence of supermountains during that period, reducing the supply of nutrients to the oceans.
“This study gives us markers, so we can better understand the evolution of early, complex life.”
Reference:
Ziyi Zhu, Ian H. Campbell, Charlotte M. Allen, Jochen J. Brocks, Bei Chen. The temporal distribution of Earth’s supermountains and their potential link to the rise of atmospheric oxygen and biological evolution. Earth and Planetary Science Letters, 2022; 580: 117391 DOI: 10.1016/j.epsl.2022.117391
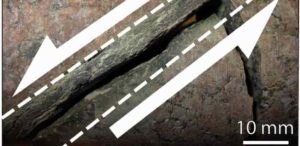
Fault zone with broken rock inside stippled lines and faulting directions of each rock segment outlined by half arrows. Photo credit: Henrik Drake. Illustration: Mikael Tillberg.
In a new paper recently published in the journal Geology, researchers at the University of Massachusetts Amherst unveiled a physical model that yields an unprecedented, high-resolution look at the slip rates of faults, which determine the likelihood of earthquakes.
When most of us picture a fault line, we imagine a giant crack in the earth where two tectonic plates smash into each other. When geologists think of faults, however, they see a branching system made up of thousands of individual faults. “The closer you look,” says Michele Cooke, one of the paper’s co-authors and a professor of geosciences at UMass Amherst, “the more you find, and when you look in detail, the picture gets very complicated.”
Such complexity makes it difficult to accurately understand what is happening at any given place in the system — let alone to predict when an earthquake will occur, and where. To blur the picture even more, the vast majority of individual faults are buried under feet of dirt or obscured by vegetation, and so can’t be directly observed. Finally, fault systems evolve over the course of thousands, tens of thousands, or even millions of years. Therefore, geologists have traditionally generated generalized slip rates for entire fault systems and theorized broadly about how fault systems evolve.
In a new study, the authors used a physical model, “about the size of a kitchen sink,” says Hanna Elston, the paper’s lead author and a graduate student in geosciences at UMass Amherst, and filled it with a carefully composed kaolin clay, “about the consistency of Greek yogurt,” that behaves much like the earth’s crust. At the bottom of the model are two plates that can be precisely moved. Elston and her co-authors then carefully cut the clay, to form a fault, and, over the course of four hours, which simulated a million years, moved the plates 12 centimeters, all the while taking pictures with an array of overhead cameras, which they could then analyze to uncover the slip rates and mechanics of their modeled faults.
The precision of the first-of-its-kind technique that Elston and her co-authors developed allows them to track slip rates at specific locations along faults, with an unprecedented fidelity, which can then provide a record that researchers can directly compare to field studies to estimate the slip rate at any particular point along a fault.
Not only does the model perform in ways that mirror real-life faults, it allowed Elston and her colleagues, including Cooke and Alex Hatem, now at the U.S. Geological Survey, to observe two different phenomena that no one else has seen before. First, the model shows that slip rates can change at a particular site on the fault as that fault evolves. Second, the team showed that slip rates are interactive: the rate can change at many different points along one fault in response to changing slip rates at other, nearby faults.
“This study gives us the finest-grained picture yet into how faults evolve, which could be used to help the assessments of seismic hazards,” says Elston — and it’s only the start. The research in this paper, which was supported by the National Science Foundation, represents a proof-of-concept for the team’s analytical techniques. Future will detail make 3D reconstructions of different faults’ evolution.
Reference:
Hanna Elston, Michele Cooke, Alex Hatem. Non-steady-state slip rates emerge along evolving restraining bends under constant loading. Geology, 2022; DOI: 10.1130/G49745.1
Scientists have identified a mechanism through which important metals, crucial to the manufacturing of renewable energy technologies, are passed from the Earth’s mantle to the crust.
The team, including researchers from Cardiff University, has discovered a ‘Goldilocks zone’ at the base of the Earth’s crust where the temperate is just right at around 1000°C for metals to be transported to shallower levels near the surface, where they can be mined.
The metals in question — most notably copper, cobalt, tellurium and platinum — are highly-sought after due to their use in electrical wiring and technologies such as battery storage devices, solar panels and fuel cells.
Publishing their findings today in the journal Nature Communications, the team is hopeful that the results can lead to more targeted, less costly, and more environmentally friendly practices to explore for and extract the key metals.
The metals are primarily stored in the Earth’s mantle — a thick layer of rock that sits between the Earth’s core and crust — at depths of more than 25km, making them inaccessible for exploitation.
Yet in certain parts of the world, nature can bring these metals to the surface through the flow of liquid rock, known as magma, that originates in the Earth’s mantle and rises upwards into the crust.
However, up until now the journey of metals to their final deposition site has been uncertain.
In the new study, the team identified a temperature dependant zone, located at the base of the Earth’s crust, which acts like a valve and intermittently allows the metals to pass upwards to reach the upper crust.
Co-author of the study Dr Iain McDonald said: “When magmas reach the base of the crust the critical metals often get trapped here and cannot reach the surface if the temperature is either too hot or too cold.
“As with Goldilocks, we have discovered that if the temperature is ‘just right’ at around 1000°C, then metals like copper, gold and tellurium can escape the trap and rise up towards the surface to form ore deposits.”
The study forms a component of the NERC-funded FAMOS project (From Arc Magmas to Ore Systems), and involved collaborators from Cardiff University, Leicester University, the University of Western Australia and the international mining company BHP.
Professor Jamie Wilkinson, of the Natural History Museum, London, is Principal Investigator for the FAMOS project, and added: “This paper represents a fantastic piece of work from the project team that sheds new light on magmatic processes that operate deep in the Earth’s crust but which exert a first-order control on the accessibility of critical metals for humankind. The results will enable more targeted mineral exploration, thus lowering the environmental footprint associated with the discovery and extraction of green metals.”
Reference:
David A. Holwell, Marco L. Fiorentini, Thomas R. Knott, Iain McDonald, Daryl E. Blanks, T. Campbell McCuaig, Weronika Gorczyk. Mobilisation of deep crustal sulfide melts as a first order control on upper lithospheric metallogeny. Nature Communications, 2022; 13 (1) DOI: 10.1038/s41467-022-28275-y
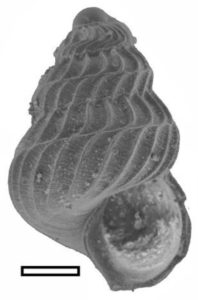
A 250-million-year-old fossil of a marine snail shell in pristine condition. The shell was one of the thousands examined in the study. Scale bar = 100 µm. Credit: William Foster et al.
A collection of fossil shells from marine snails and clams is challenging a theory that says the world’s deadliest mass extinction was accompanied by severe ocean acidification.
Instead of showing damage or signs of repair—which would be expected if the mollusk was surviving in acidic conditions—the shells were in excellent shape, according to a study that was published on Jan. 24, 2022, in Scientific Reports.
William Foster, a scientist at the University of Hamburg and former postdoctoral researcher at The University of Texas at Austin Jackson School of Geosciences, led the research.
The study is the first to use shells from fossilized mollusks to investigate ocean chemistry, demonstrating a new tool that scientists can use to study the conditions of the planet’s deep past.
“For events that occurred millions of years ago, we have to rely on evidence such as the chemistry of marine rocks and fossils,” said co-author Rowan Martindale, an associate professor at the Jackson School. “Sometimes these proxies give conflicting results, so we need multiple, independent measures of ocean conditions.”
The world’s deadliest mass extinction wiped out about 90% of living species about 252 million years ago at the end of Permian Period. The extinction was triggered by huge volcanic eruptions in present-day Siberia, which released large amounts of carbon dioxide into the atmosphere in relatively short amount of time, causing rapid global warming.
When atmospheric carbon dioxide is high, the ocean can absorb some of the gas and become more acidic. However, the geologic record is inconclusive about whether this occurred during the end Permian extinction event.
“Some previous studies based on chemical analyses of rocks had suggested that the world’s seas were acidic at that time, but other geochemical evidence suggested the opposite,” said Foster.
The analysis of the mollusk shells offers a more thorough perspective, Foster said, because they capture the chemical state of the ocean shortly after the extinction event from top to bottom, not just where sediment settled. The s tested for acidification in surface waters by analyzing larval shells and tested for seafloor acidification by analyzing adult shells.
The research entailed examining more than 2,300 fossil shells from marine snails and bivalves from under a microscope. And although a handful of shells record some growth impairment, there were no signs of patched holes, a tell-tale sign of mollusks living in an acidic environment.
“None show repair marks that would indicate severe acidification in surface waters or on the seafloor,” Foster said.
The fossils were collected from a site in what is now Svalbard, Sweden. When the animals were alive, the site was covered by a shallow sea and the Earth contained just a single massive continent.
“It was really exciting to study organisms that lived when Pangea was a supercontinent,” said co-author Jaime Hirtz, who recently earned a master’s degree from the Jackson School but started working on these fossils when she was an undergraduate student.
Marine animals with shells made of aragonite (a type of calcium carbonate mineral) are particularly susceptible to ocean acidification. Scientists use shells from “sea butterflies,” a type of swimming sea snail, to study ocean acidification in the present and recent past. This study shows that shells from fossilized mollusk species can be analyzed in a similar manner, opening the door to more extensive research on ocean chemistry in Earth’s past and its connection to climatic events.
“One of the exciting aspects of this research is that we now know we can use fossil shells of aragonitic marine animals from millions of years ago as bioindicators of past ocean acidification,” said co-author Richard Twitchett, a professor at the Natural History Museum, London.
The study’s additional co-authors are Maria Reistroffer, who conducted the research while earning a bachelor’s degree from the Jackson School, and Conor Farrell, an undergraduate student at University College Dublin.
Reference:
William J. Foster et al, Bioindicators of severe ocean acidification are absent from the end-Permian mass extinction, Scientific Reports (2022). DOI: 10.1038/s41598-022-04991-9