New FSU study says some is sitting on the Gulf floor
After 200 million gallons of crude oil spilled into the Gulf of Mexico in April 2010, the government and BP cleanup crews mysteriously had trouble locating all of it.
Now, a new study led by Florida State University Professor of Oceanography Jeff Chanton finds that some 6 million to 10 million gallons are buried in the sediment on the Gulf floor, about 62 miles southeast of the Mississippi Delta.
“This is going to affect the Gulf for years to come,” Chanton said. “Fish will likely ingest contaminants because worms ingest the sediment, and fish eat the worms. It’s a conduit for contamination into the food web.”
The article, published in the latest edition of the journal Environmental Science & Technology, details how oil caused particles in the Gulf to clump together and sink to the ocean floor.
The researchers used carbon 14, a radioactive isotope as an inverse tracer to determine where oil might have settled on the floor. Oil does not have carbon 14, so sediment that contained oil would immediately stand out.
Chanton then collaborated with Tingting Zhao, associate professor of geography at Florida State, to use geographic information system mapping to create a map of the oiled sediment distribution on the sea floor.
Chanton said in the short term, the oil sinking to the sea floor might have seemed like a good thing because the water was clarified, and the oil was removed from the water. But, in the long term, it’s a problem, he said.
Less oxygen exists on the sea floor relative to the water column, so the oiled particles are more likely to become hypoxic, meaning they experience less oxygen. Once that happens, it becomes much more difficult for bacteria to attack the oil and cause it to decompose, Chanton said.
Chanton’s research is supported by the Florida State University-headquartered Deep-C Consortium as well as the Ecogig consortium, centered at the University of Mississippi. The work was funded by the Gulf of Mexico Research Institute created to allocate the money made available to support scientific research by BP.
His previous research examined how methane-derived carbon from the oil spill entered the food web.
In addition to Chanton and Zhao, the other authors are Samantha Bosman of Florida State, Brad E. Rosenheim and David Hollander from University of South Florida and Samantha Joye from University of Georgia. Charlotte Brunner, Kevin Yeager and Arne Diercks of University of Southern Mississippi also contributed.
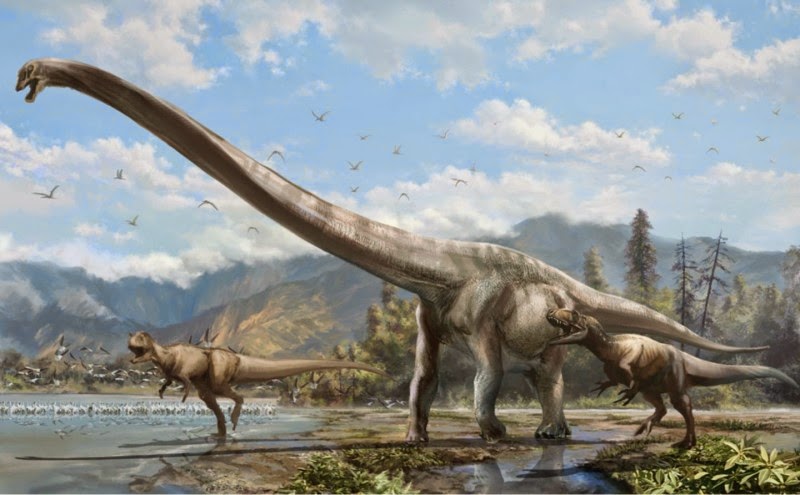
This illustration shows what the newly discovered long-necked dinosaur may have looked like. Credit: Xing Lida
University of Alberta paleontologists including PhD student Tetsuto Miyashita, former MSc student Lida Xing and professor Philip Currie have discovered a new species of a long-necked dinosaur from a skeleton found in China. The findings have been published in a new paper in the Journal of Vertebrate Paleontology.
Qijianglong (pronounced “CHI-jyang-lon”) is about 15 metres in length and lived about 160 million years ago in the Late Jurassic. The name means “dragon of Qijiang,” for its discovery near Qijiang City, close to Chongqing. The fossil site was found by construction workers in 2006, and the digging eventually hit a series of large neck vertebrae stretched out in the ground. Incredibly, the head of the dinosaur was still attached. “It is rare to find a head and neck of a long-necked dinosaur together because the head is so small and easily detached after the animal dies,” explains Miyashita.
The new species belongs to a group of dinosaurs called mamenchisaurids, known for their extremely long necks sometimes measuring up to half the length of their bodies. Most sauropods, or long-necked dinosaurs, have necks only about one third the length of their bodies.
Unique among mamenchisaurids, Qijianglong had neck vertebrae that were filled with air, making their necks relatively lightweight despite their enormous size. Interlocking joints between the vertebrae also indicate a surprisingly stiff neck that was much more mobile bending vertically than sideways, similar to a construction crane.
“Qijianglong is a cool animal. If you imagine a big animal that is half-neck, you can see that evolution can do quite extraordinary things.” says Miyashita.
Mamenchisaurids are only found in Asia, but the discovery of Qijianglong reveals that there could be as many differences among mamenchisaurids as there are between long-necked dinosaurs from different continents.
“Qijianglong shows that long-necked dinosaurs diversified in unique ways in Asia during Jurassic times–something very special was going on in that continent,” says Miyashita. “Nowhere else we can find dinosaurs with longer necks than those in China. The new dinosaur tells us that these extreme species thrived in isolation from the rest of the world.”
Miyashita believes that mamenchisaurids evolved into many different forms when other long-necked dinosaurs went extinct in Asia. “It is still a mystery why mamenchisaurids did not migrate to other continents,” he says. It is possible that the dinosaurs were once isolated as a result of a large barrier such as a sea, and lost in competition with invading species when the land connection was restored later.
The Qijianglong skeleton is now housed in a local museum in Qijiang. “China is home to the ancient myths of dragons,” says Miyashita, “I wonder if the ancient Chinese stumbled upon a skeleton of a long-necked dinosaur like Qijianglong and pictured that mythical creature.”
Reference:
Lida Xing, Tetsuto Miyashita, Jianping Zhang, Daqing Li, Yong Ye, Toru Sekiya, Fengping Wang, Philip J. Currie. A new sauropod dinosaur from the Late Jurassic of China and the diversity, distribution, and relationships of mamenchisaurids. Journal of Vertebrate Paleontology, 2015; e889701 DOI: 10.1080/02724634.2014.889701 Note : The above story is based on materials provided by University of Alberta. The original article was written by Kristy Condon.
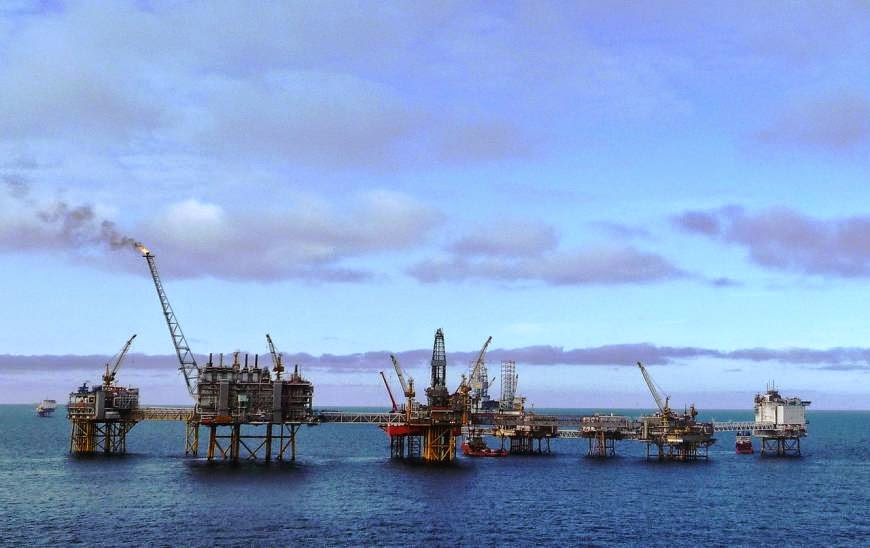
A new technique for passively probing the seafloor using weak seismic waves generated by ocean waves was tested at the Ekofisk oil field in the North Sea. Credit: Wikipedia /Creative Commons
A technology developed by Stanford scientists for passively probing the seafloor using weak seismic waves generated by the ocean could revolutionize offshore oil and natural gas extraction by providing real-time monitoring of the subsurface while lessening the impact on marine life.
“We’ve shown that we can generate images of the subsurface nearly every day instead of taking snapshots just two or three times a year,” said Biondo Biondi, professor of geophysics at Stanford’s School of Earth Sciences.
Currently, many energy companies use a technique called time-lapse reflection seismology to monitor offshore oil and gas deposits to optimize production and look for hazards such as hidden gas pockets. Reflection seismology involves ships towing arrays of “air guns” that explode every 10 to 15 seconds to produce loud sound pulses. The pulses bounce off the seafloor and geological formations beneath, then journey back to the surface, where they are recorded by hydrophones. The data are then deciphered to reveal details about subsurface structures.
Each survey can cost tens of millions of dollars, and as a result they are only conducted two to three times a year. Environmental groups and marine biologists have expressed concerns about the use of air guns for contributing to noise pollution in the ocean that can disturb or even injure marine animals, including humpback whales and giant squid.
The new technique developed by Biondi and Sjoerd de Ridder, a student of Biondi’s who is now a postdoctoral scientist at the University of Edinburgh, is different. It exploits naturally occurring seismic waves generated by Earth’s oceans that are several orders of magnitude weaker than those produced by earthquakes.
Ambient seismicity
As ocean waves collide with one another, they create pressures on the sea floor, where they generate seismic waves that then propagate in every direction. Scientists have known about this “ambient seismic field” for nearly a century, but it was only recently that they understood ways to harness it.
“We knew the ambient seismic energy was there, but we didn’t know what we could do with it,” De Ridder said. “That understanding has only been developed in recent years. Our technique provides the first large-scale application to harness it for oil and gas production.”
The technique that Biondi and De Ridder developed, called ambient seismic field noise-correlation tomography, or ASNT, uses sensors embedded in the seafloor. The sensors, which are typically installed by robotic submersibles, are connected to one another by cables and arranged into parallel rows that can span several kilometers of the seafloor. Another cable connects the sensor array to a platform in order to collect data in real time.
The sensors record ambient seismic waves traveling through Earth’s crust. The waves are ubiquitous, continuously generated and traveling in every direction, but using careful signal-processing schemes they developed, Biondi and De Ridder can digitally isolate only those waves that are passing through one sensor and then another one downstream. When this is done repeatedly, and for multiple sensors in the network, what emerges is a “virtual” seismic wave pattern that is remarkably similar to the kind generated by air guns.
Less disruptive
Because the ASNT technique is entirely passive, meaning it does not require a controlled explosion or a loud air gun blast to create a seismic wave signature, it can be performed for a fraction of the cost of an active-reflection-seismology survey and should be far less disruptive to marine life, the scientists say.
Since 2007, Biondi and De Ridder have been testing and refining their technique in a real-world laboratory in Europe. The scientists worked with the energy companies BP and ConocoPhillips to study recordings from existing sensor arrays in the Valhall and Ekofisk oil fields in the North Sea that are capable of recording ambient seismic waves.
The proof-of-concept experiment has been successful, and the scientists have demonstrated that they can image the subsurface at Valhall down to a depth of nearly 1,000 feet. “We’ve now shown that our technique can very reliably and repeatedly retrieve an image of the near-surface,” De Ridder said. “Our hope is that they can also reveal changes in the rocks that could signal an impending problem.”
The Stanford scientists outlined their technique and detailed some of their results from Valhall, as well as from Ekofisk, in a series of technical papers, the latest of which was recently published in the journal Geophysical Research Letters.
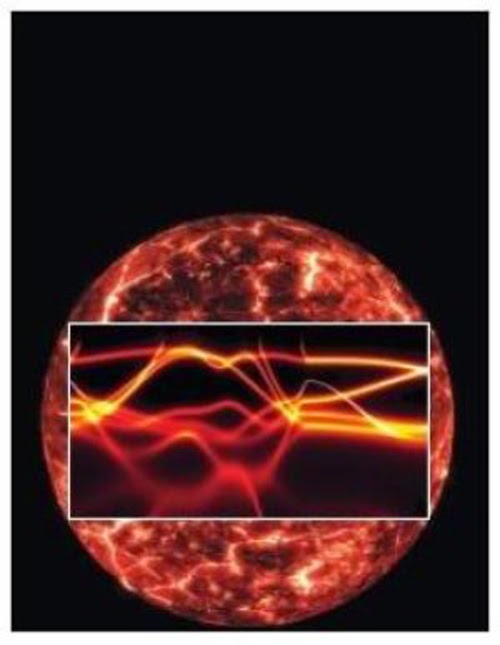
This is a conception of Earth’s core overlaid by the electronic structure of iron; the width (fuzziness) of the lines results from the electron-electron scattering. Image courtesy of Ronald Cohen. Credit: Ronald Cohen
Earth’s magnetic field is crucial for our existence, as it shields the life on our planet’s surface from deadly cosmic rays. It is generated by turbulent motions of liquid iron in Earth’s core. Iron is a metal, which means it can easily conduct a flow of electrons that makes up an electric current. New findings from a team including Carnegie’s Ronald Cohen and Peng Zhang shows that a missing piece of the traditional theory explaining why metals become less conductive when they are heated was needed to complete the puzzle that explains this field-generating process. Their work is published in Nature.
The center of the Earth is very hot, and the flow of heat from the planet’s center towards the surface is thought to drive most of the dynamics of the Earth, ranging from volcanoes to plate tectonics. It has long been thought that heat flow drives what is called thermal convection — the hottest liquid becomes less dense and rises, as the cooler, more-dense liquid sinks — in Earth’s liquid iron core and generates Earth’s magnetic field. But recent calculations called this theory into question, launching new quests for its explanation.
In their work, Cohen and Zhang, along with Kristjan Haule of Rutgers University, used a new computational physics method and found that the original thermal convection theory was right all along. Their conclusion hinges on discovering that the classic theory of metals developed in the 1930’s was incomplete.
The electrons in metals, such as the iron in Earth’s core, carry current and heat. A material’s resistivity impedes this flow. The classic theory of metals explains that resistivity increases with temperature, due to atoms vibrating more as the heat rises. The theory says that at high temperatures resistivity happens when electrons in the current bounce off of vibrating atoms. These bounced electrons scatter and resist the current flow. As temperature increases, the atoms vibrate more, and increasing the scattering of bounced electrons. The electrons not only carry charge, but also carry energy, so that thermal conductivity is proportional to the electrical conductivity.
The work that had purportedly thrown the decades-old prevailing theory on the generation of Earth’s magnetic field out the window claimed that thermal convection could not drive magnetic-field generation. The calculations in those studies said that the resistivity of the molten metal in Earth’s core, which is generated by this electron scattering process, would be too low, and thus the thermal conductivity too high, to allow thermal convection to generate the magnetic field.
Cohen, Zhang, and Haule’s new work shows that the cause of about half of the resistivity generated was long neglected: it arises from electrons scattering off of each other, rather than off of atomic vibrations.
“We uncovered an effect that had been hiding in plain sight for 80 years,” Cohen said. “And now the original dynamo theory works after all!”
Reference:
Peng Zhang, R. E. Cohen, K. Haule. Effects of electron correlations on transport properties of iron at Earth’s core conditions. Nature, 2015; 517 (7536): 605 DOI: 10.1038/nature14090
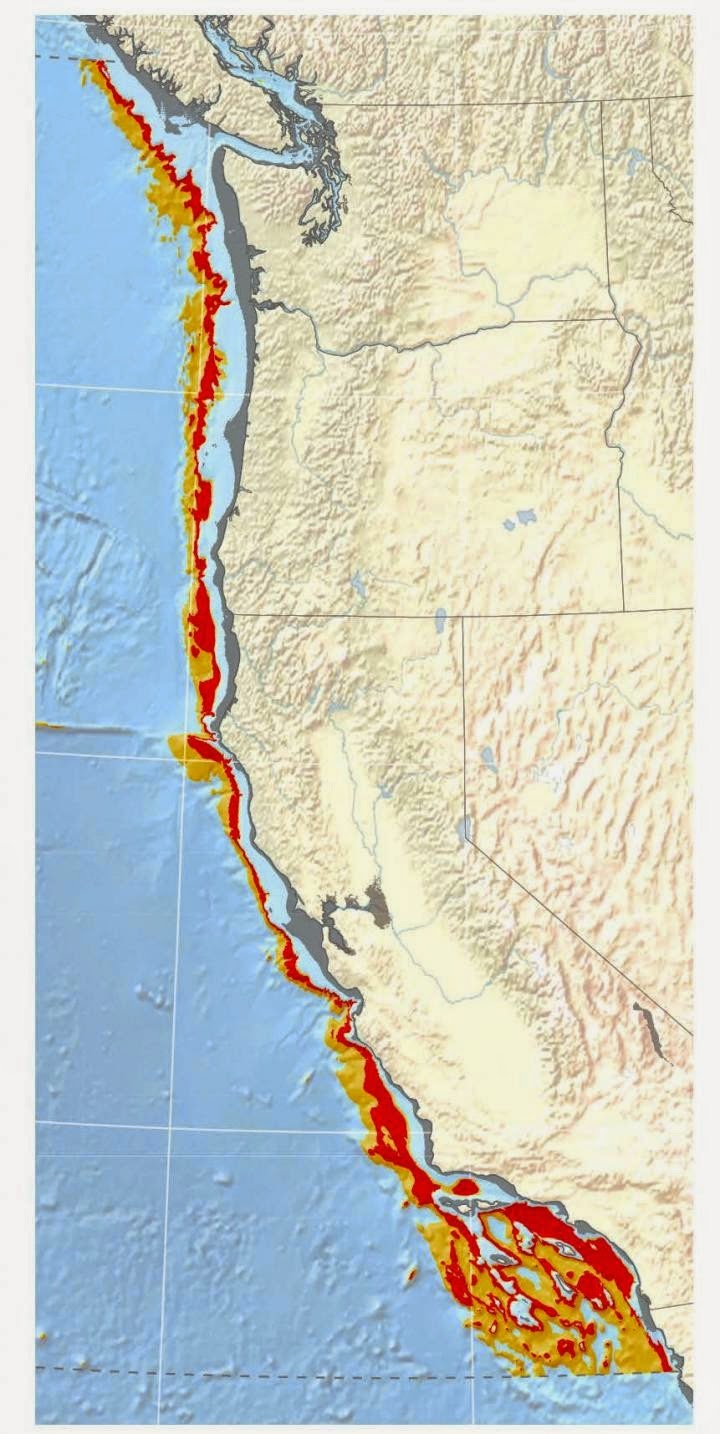
This map of the California Current shows the extent of the low-oxygen seafloor. Yellow indicates intermediate hypoxia, while red zones are areas of severe oxygen loss. Credit: UC Davis
Seafloor sediment cores reveal abrupt, extensive loss of oxygen in the ocean when ice sheets melted roughly 10,000-17,000 years ago, according to a study from the University of California, Davis. The findings provide insight into similar changes observed in the ocean today.
In the study, published in the journal PLOS ONE, researchers analyzed marine sediment cores from different world regions to document the extent to which low oxygen zones in the ocean have expanded in the past, due to climate change.
From the subarctic Pacific to the Chilean margins, they found evidence of extreme oxygen loss stretching from the upper ocean to about 3,000 meters deep. In some oceanic regions, such loss took place over a time period of 100 years or less.
“This is a global story that knits these regions together and shows that when you warm the planet rapidly, whole ocean basins can lose oxygen very abruptly and very extensively,” said lead author Sarah Moffitt, a postdoctoral scholar with the UC Davis Bodega Marine Laboratory and formerly a Ph.D. student with the Graduate Group in Ecology.
Marine organisms, from salmon and sardines to crab and oysters, depend on oxygen to exist. Adapting to an ocean environment with rapidly dropping oxygen levels would require a major reorganization of living things and their habitats, much as today polar species on land are retreating to higher, cooler latitudes.
The researchers chose the deglaciation period because it was a time of rising global temperatures, atmospheric carbon dioxide and sea levels — many of the global climate change signs the Earth is experiencing now.
“Our modern ocean is moving into a state that has no precedent in human history,” Moffitt said. “The potential for our oceans to look very, very different in 100-150 years is real. How do you use the best available science to care for these critical resources in the future? Resource managers and conservationists can use science like this to guide a thoughtful, precautionary approach to environmental management.”
The study’s co-authors include: Russell Moffitt with the Marine Conservation Institute; Tessa Hill, professor in the UC Davis Department of Earth and Planetary Sciences and at the Bodega Marine Laboratory; Wilson Sauthoff and Catherine Davis of the Department of Earth and Planetary Sciences; and Kathryn Hewett, UC Davis Department of Civil and Environmental Engineering.
The study arose from a graduate level course that was taught at UC Davis in winter 2013 by Hill. The research was supported by the National Science Foundation.
Reference:
Sarah E. Moffitt, Russell A. Moffitt, Wilson Sauthoff, Catherine V. Davis, Kathryn Hewett, Tessa M. Hill. Paleoceanographic Insights on Recent Oxygen Minimum Zone Expansion: Lessons for Modern Oceanography. PLOS ONE, 2015; 10 (1): e0115246 DOI: 10.1371/journal.pone.0115246
Pieces of sediment from the Cretaceous period encased in lava floated to the surface with the underwater eruption of El Hierro in 2011, bringing scientists valuable data on the islands’ ocean floor. The analysis of the materials matches the origin of the Canary Islands archipelago to the model of how Hawaii was formed and confirms that the oldest islands are found to the east and the youngest to the west.
In July 2011, the island of El Hierro experienced the first signs of a possible volcanic eruption with low intensity but unusually numerous earthquakes. The seismicity became ever more intense, culminating in the underwater eruption two kilometres south of the village of La Restinga on 10 October 2011.
As part of research published in Scientific Reports, from the group Nature, scientists from centres in Sweden, Spain and Portugal have studied the volcanic material which floated to the surface of the sea after the eruption. The nannofossils that they contain confirm that the islands were formed from east to west. This data sheds light on the origin and life cycle of oceanic islands, which has been debated since the beginnings of geology.
“Our study confirms, for the first time, that the underwater activity which starts off the construction of the islands follows the pattern of the known age progression of subaerial volcanic activity (the emerging part of the islands) with older ages to the east of the archipelago, Fuerteventura and Lanzarote, and the youngest to the west, El Hierro and La Palma,” as Vicente Soler, researcher at the Volcanological Station of the Canary Islands (CSIC) tells SINC.
The new finding brings the origin of the Canaries closer to the Hawaiian model, given that the Canary Islands archipelago is not located in an area where plates meet, but in the middle of the African plate. This also occurs with Hawaii; its islands are in the middle of the Pacific plate and are located in an almost straight line.
“With the Canary Islands, a string of islands was formed as the oceanic plate shifted over a deep set magmatic source, contrary to the theory which attributes the origin of the archipelago to regional tectonics, which are responsible, amongst other things, for the formation of the neighbouring Atlas mountains in northern Morocco,” the scientist points out.
The origin of the volcanic materials
Soler explains that these floating volcanic materials are better known as ‘restingolites’, while in scientific literature they have been given the confusing name of ‘xeno pumice’.
“There is much scientific controversy regarding what restingolites are and where they come from. The materials of interest for this study were collected floating on the sea during the first days of eruption and a week later after their arrival ashore,” he adds.
Due to the small fossils they contain, they are attributed to the Cretaceous period, in full formation of the Atlantic ocean with America, on separating from what are today Europe and Africa.
According to the researchers who participated in this study, including Valentín R. Troll, from Uppsala University and Juan Carlos Carracedo from the University of Las Palmas de Gran Canaria, these fragments must be pieces of pre-island sediments ‘reworked’ by the column of magma where the eruption occurred while en-route to the surface.
“Also, due to the silica content, they would seem to be rhyolites, rocks related to a potentially dangerous type of volcanic activity. Yet the existence of nannofossils inside the restingolites is a compelling argument in favour of the first hypothesis,” concludes Soler.
Reference:
Kirsten Zacze, Valentin R. Troll, Mario Cachao, Jorge Ferreira, Frances M. Deegan, Juan Carlos Carracedo, Vicente Soler, Fiona C. Meade y Steffi Burchardt. “Nannofossils in 2011 El Hierro eruptive products reinstate plume model for Canary Islands” Scientific Report 5: 7945 | DOI: 10.1038/srep07945 . January 2014.
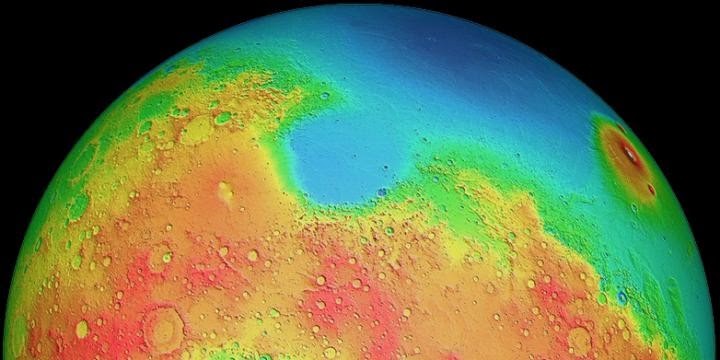
Mars has two differently shaped hemispheres: the lowlands of the northern hemisphere and the volcanic highlands (yellow to red regions) of the southern hemisphere. A “giant impact” on the southern pole is suspected to be the reason for this. Credit: MOLA Science Team
The two hemispheres of Mars are more different from any other planet in our solar system. Non-volcanic, flat lowlands characterise the northern hemisphere, while highlands punctuated by countless volcanoes extend across the southern hemisphere. Although theories and assumptions about the origin of this so-called and often-discussed Mars dichotomy abound, there are very few definitive answers. ETH Zurich geophysicists under Giovanni Leone are now providing a new explanation. Leone is the lead author of a paper recently published in the journal Geophysical Research Letters.
Using a computer model, the scientists have concluded that a large celestial object must have smashed into the Martian south pole in the early history of the Solar System. Their simulation shows that this impact generated so much energy that it created a magma ocean, which would have extended across what is today’s southern hemisphere. The celestial body that struck Mars must have been at least one-tenth the mass of Mars to be able to unleash enough energy to create this magma ocean. The molten rock eventually solidified into the mountainous highlands that today comprise the southern hemisphere of Mars.
Volcanic activity over three billion years
In their simulation, the researchers assumed that the celestial body consisted to a large degree of iron, had a radius of at least 1,600 kilometres, and crashed into Mars at a speed of five kilometres per second. The event is estimated to have occurred around 4 to 15 million years after the Red Planet was formed. Mars’ crust must have been very thin at that time, like the hard, caramelised surface of a crème brûlée. And, just like the popular dessert, hiding beneath the surface was a liquid interior.
When the celestial object impacted, it added more mass to Mars, particularly iron. But the simulation also found that it triggered strong volcanic activity lasting three billion years. Around the equator in particular, numerous mantle plumes were generated as a consequence of the impact, which migrated to the south pole where they ended. Mantle plumes are magma columns that transport liquid material from the mantle to the surface.
In the model, the researchers found that activity on Mars died down after around three billion years, after which time the Red Planet experienced neither volcanic activity nor a magnetic field — this is consistent with observations and measurements.
Volcanic activity and topography modelled under realistic conditions
Earlier theories posited the opposite, namely that there must have been a gigantic impact or many smaller strikes against the northern hemisphere. The most important theory about the origin of the Mars dichotomy was formulated by two American researchers in 1984 in an article in the journal Nature. They postulated that a large celestial object struck the Martian north pole. In 2008 a different team revived this idea and published it once again in Nature.
This theory did not convince Leone: “Our scenarios more closely reflect a range of observations about Mars than the theory of a northern hemisphere impact,” states Leone. The volcanoes on Mars are very unevenly distributed: they are common and widespread on the southern hemisphere, but are rare and limited to only a few small regions in the northern hemisphere. “Our model is an almost identical depiction of the actual distribution of volcanic identity,” asserts Leone. According to the researcher, no other model has been able to portray or explain this distribution before.
Their simulation was also able to reproduce the different topographies of the two hemispheres in an extremely realistic manner, says Leone. And he goes on to explain that the model — depending on the composition of the impact body chosen — is a virtually perfect representation of the size and shape of the hemispheres. One condition, however, is that the celestial body impacting Mars consist of 80 per cent iron; when the researchers simulated the impact with a celestial body made of pure silicate rock, the resulting image did not correspond to the reality of the dichotomy.
Magnetic field tipped the balance
Lastly, the model developed by the ETH researchers confirmed the date on which the magnetic field on Mars ceased to exist. The date calculated by the model corresponds to around 4.1 billion years ago, a figure previously proven by other scientists. The model also demonstrates why it ceased: a sharp decrease in heat flow from the core into the mantle and the crust in the first 400 million years after the impact. After a billion years, the heat flow was only one-tenth its initial value, which was too low to maintain even the volcanism. The model’s calculations closely match previous calculations and mineralogical explorations.
The volcanic activity is related to the heat flow, explains Leone, though the degree of volcanic activity could be varied in the simulation and influenced by the strength of the impact. This, he states, is in turn linked to the size and composition of the celestial object. In other words, the larger it is, the stronger the volcanic activity is. Nevertheless, after one billion years the volcanic vents were extinguished — regardless of the size of the impact.
It has become increasingly clear to Giovanni Leone that Mars has always been an extremely hostile planet, and he considers it almost impossible that it ever had water. “Since the beginning of time, this planet was characterised by intense heat and volcanic activity, which would have evaporated any possible water and made the emergence of life highly unlikely,” asserts the planet researcher.
Reference:
Giovanni Leone, Paul J. Tackley, Taras V. Gerya, Dave A. May, Guizhi Zhu. Three-dimensional simulations of the southern polar giant impact hypothesis for the origin of the Martian dichotomy. Geophysical Research Letters, 2014; 41 (24): 8736 DOI: 10.1002/2014GL062261
Note : The above story is based on materials provided by ETH Zurich.
Artist’s conception of three of the four newly identified ancient snakes: (top left) Portugalophis lignites (Upper Jurassic) in a gingko tree, from coal swamp deposits at Guimarota, Portugal; (top right) Diablophis gilmorei (Upper Jurassic), hiding in a ceratosaur skull, from the Morrison Formation in Fruita, Colorado; (bottom) Parviraptor estesi (Upper Jurassic/Lower Cretaceous) swimming in freshwater lake with snails and algae, from the Purbeck Limestone in Swanage, England. Credit: Julius Csotonyi
Fossilized remains of four ancient snakes between 140 and 167 million years old are changing the way we think about the origin of snakes, and how and when it happened.
The discovery by an international team of researchers, including University of Alberta professor Michael Caldwell, rolls back the clock on snake evolution by nearly 70 million years.
“The study explores the idea that evolution within the group called ‘snakes’ is much more complex than previously thought,” says Caldwell, professor in the Faculty of Science and lead author of the study published today in Nature Communications. “Importantly, there is now a significant knowledge gap to be bridged by future research, as no fossils snakes are known from between 140 to 100 million years ago.”
New knowledge from ancient serpents
The oldest known snake, from an area near Kirtlington in Southern England, Eophis underwoodi, is known only from very fragmentary remains and was a small individual, though it is hard to say how old it was at the time it died. The largest snake, Portugalophis lignites, from coal deposits near Guimarota in Portugal, was a much bigger individual at about a metre long. Several of these ancient snakes (Eophis, Portugalophis and Parviraptor) were living in swampy coastal areas on large island chains in western parts of ancient Europe. The North American species, Diablophis gilmorei, was found in river deposits from some distance inland in western Colorado.
This new study makes it clear that the sudden appearance of snakes some 100 million years ago reflects a gap in the fossil record, not an explosive radiation of early snakes. From 167 to 100 million years ago, snakes were radiating and evolving toward the elongated, limb-reduced body shape characterizing the now well known, ~100-90 million year old, marine snakes from the West Bank, Lebanon and Argentina, that still possess small but well-developed rear limbs.
Caldwell notes that the identification of definitive snake skull features reveals that the fossils — previously associated with other non-snake lizard remains — represent a much earlier time frame for the first appearance of snakes.
“Based on the new evidence and through comparison to living legless lizards that are not snakes, the paper explores the novel idea that the evolution of the characteristic snake skull and its parts appeared long before snakes lost their legs,” he explains.
He adds that the distribution of these newly identified oldest snakes, and the anatomy of the skull and skeletal elements, makes it clear that even older snake fossils are waiting to be found.
Video:
Reference:
Michael W. Caldwell, Randall L. Nydam, Alessandro Palci, Sebastián Apesteguía. The oldest known snakes from the Middle Jurassic-Lower Cretaceous provide insights on snake evolution. Nature Communications, 2015; 6: 5996 DOI: 10.1038/ncomms6996
Note : The above story is based on materials provided by University of Alberta. The original article was written by Julie Naylor.
Water-filled micropores in hot rock may have acted as the nurseries in which life on Earth began. A team at Ludwig-Maximilians-Universitaet (LMU) in Munich has now shown that temperature gradients in pore systems promote the cyclical replication and emergence of nucleic acids.
How and in what habitats did the first life-forms arise on the young Earth? One crucial precondition for the origin of life is that comparatively simple biomolecules must have had opportunities to form more complex structures, which were capable of reproducing themselves and could store genetic information in a chemically stable form. But this scenario requires some means of accumulating the precursor molecules in highly concentrated form in solution.
In the early oceans, such compounds would have been present in vanishingly low concentrations. But LMU physicists led by Professor Dieter Braun now describe a setting which provides the necessary conditions. They show experimentally that pore systems on the seafloor that were heated by volcanic activity could have served as reaction chambers for the synthesis of RNA molecules, which serve as carriers of hereditary information in the biosphere today.
“The key requirement is that the heat source be localized on one side of the elongated pore, so that the water on that side is significantly warmer than that on the other,” says Braun. Preformed biomolecules that are washed into the pore can then be trapped, and concentrated, by the action of the temperature gradient — thus fulfilling a major prerequisite for the formation and replication of more complex molecular structures. The molecular trapping effect is a consequence of thermophoresis: Charged molecules in a temperature gradient preferentially move from the warmer to the cooler region, allowing longer polymers in particular to be securely trapped. This is an important factor in the evolution of nucleic acids such as RNA and DNA, simply because longer molecules can store more genetic information.
Recreating rock pores in the laboratory
Braun and his colleagues have shown that this mechanism works in the laboratory: “We used tiny glass capillary tubes to construct an analog of the natural pores found in rock, heated the pore from one side and allowed water containing dissolved fragments of linear DNA of varying lengths to percolate through it. Under such conditions, the long strands are indeed trapped within the pore,” Braun explains. “Pores that were exposed to heat are frequently found in igneous rock formations, and they were certainly common in rocks of volcanic origin on the early Earth. So this scenario is quite realistic. And the temperature effect is enhanced by the presence of metal inclusions within the rock, which conduct heat at rates 100 times higher than water.”
Temperature gradients and replication
Not only are nucleic acids retained in the pore, they are also capable of replication under these conditions. In the hotter zone, double-stranded strands are separated into its component strands within minutes. The single strands can then be transported by convection — cyclical flow along the pore perpendicular to the orientation of temperature gradient — back to the colder region of the pore. Here they encounter the chemical precursors from which each DNA strand is built, which are fed into the pore by a continuous inflow. The preformed strands then act as templates for the polymerization of complementary strands. This cycle makes it possible not only to replicate the strands but also to elongate them by stitching fragments together. When the nucleic acids accumulate to levels beyond the storage capacity of the pore, newly replicated molecules can escape and colonize neighboring pore systems.
Thus, the LMU group has succeeded in constructing a system which permits autonomous and continuous Darwinian evolution of ever more complex biomolecules — thus defining realistic conditions under which life could in principle have evolved. “Life is fundamentally a thermodynamic non-equilibrium phenomenon. That is why the emergence of the first life-forms requires a local imbalance driven by an external energy source — for example, by a temperature difference imposed from outside the system,” Dieter Braun explains. “That this can be achieved in such a simple and elegant way was surprising even to us. The success of the project is a tribute to the close cooperation between all members of the team.”
Reference:
Moritz Kreysing, Lorenz Keil, Simon Lanzmich, Dieter Braun. Heat flux across an open pore enables the continuous replication and selection of oligonucleotides towards increasing length. Nature Chemistry, 2015; DOI: 10.1038/nchem.2155
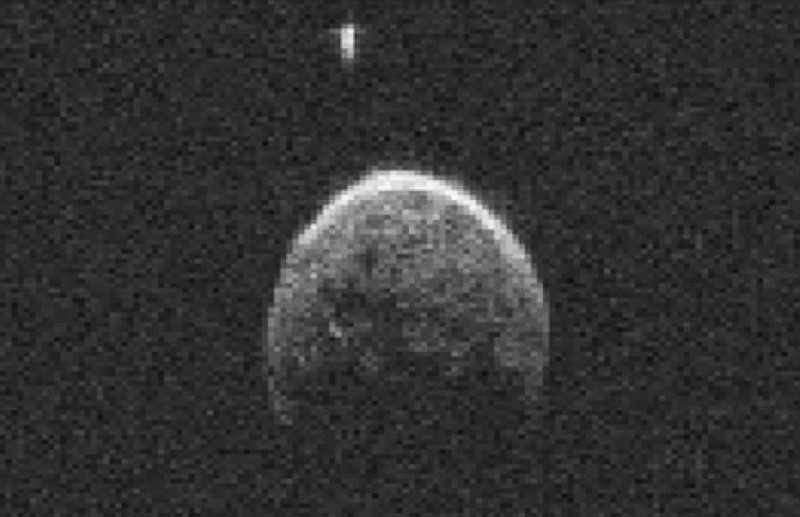
Asteroid 2004 BL86, which safely flew past Earth on Jan. 26, 2015. Image Credit: NASA/JPL-Caltech
Scientists working with NASA’s 230-foot-wide (70-meter) Deep Space Network antenna at Goldstone, California, have released the first radar images of asteroid 2004 BL86. The images show the asteroid, which made its closest approach on Jan. 26, 2015 at 8:19 a.m. PST (11:19 a.m. EST) at a distance of about 745,000 miles (1.2 million kilometers, or 3.1 times the distance from Earth to the moon), has its own small moon.
The 20 individual images used in the movie were generated from data collected at Goldstone on Jan. 26, 2015. They show the primary body is approximately 1,100 feet (325 meters) across and has a small moon approximately 230 feet (70 meters) across. In the near-Earth population, about 16 percent of asteroids that are about 655 feet (200 meters) or larger are a binary (the primary asteroid with a smaller asteroid moon orbiting it) or even triple systems (two moons). The resolution on the radar images is 13 feet (4 meters) per pixel.
The trajectory of asteroid 2004 BL86 is well understood. Monday’s flyby was the closest approach the asteroid will make to Earth for at least the next two centuries. It is also the closest a known asteroid this size will come to Earth until asteroid 1999 AN10 flies past our planet in 2027.
Asteroid 2004 BL86 was discovered on Jan. 30, 2004, by the Lincoln Near-Earth Asteroid Research (LINEAR) survey in White Sands, New Mexico.
This GIF shows asteroid 2004 BL86, which safely flew past Earth on Jan. 26, 2015. Image Credit: NASA/JPL-Caltech
Radar is a powerful technique for studying an asteroid’s size, shape, rotation state, surface features and surface roughness, and for improving the calculation of asteroid orbits. Radar measurements of asteroid distances and velocities often enable computation of asteroid orbits much further into the future than if radar observations weren’t available.
NASA places a high priority on tracking asteroids and protecting our home planet from them. In fact, the U.S. has the most robust and productive survey and detection program for discovering near-Earth objects (NEOs). To date, U.S. assets have discovered over 98 percent of the known NEOs.
In addition to the resources NASA puts into understanding asteroids, it also partners with other U.S. government agencies, university-based astronomers, and space science institutes across the country, often with grants, interagency transfers and other contracts from NASA, and also with international space agencies and institutions that are working to track and better understand these objects.
NASA’s Near-Earth Object Program at NASA Headquarters, Washington, manages and funds the search, study and monitoring of asteroids and comets whose orbits periodically bring them close to Earth. JPL manages the Near-Earth Object Program Office for NASA’s Science Mission Directorate in Washington. JPL is a division of the California Institute of Technology in Pasadena.
In 2016, NASA will launch a robotic probe to one of the most potentially hazardous of the known NEOs. The OSIRIS-REx mission to asteroid (101955) Bennu will be a pathfinder for future spacecraft designed to perform reconnaissance on any newly discovered threatening objects. Aside from monitoring potential threats, the study of asteroids and comets enables a valuable opportunity to learn more about the origins of our solar system, the source of water on Earth, and even the origin of organic molecules that led to the development of life.
NASA’s Goddard Space Flight Center in Greenbelt, Maryland, will provide overall mission management, systems engineering, and safety and mission assurance for OSIRIS-REx. Lockheed Martin Space Systems in Denver will build the spacecraft. OSIRIS-REx is the third mission in NASA’s New Frontiers Program. NASA’s Marshall Space Flight Center in Huntsville, Alabama, manages New Frontiers for the agency’s Science Mission Directorate in Washington.
NASA also continues to advance the journey to Mars through progress on the Asteroid Redirect Mission (ARM), which will test a number of new capabilities needed for future human expeditions to deep space, including to Mars. This includes advanced Solar Electric Propulsion — an efficient way to move heavy cargo using solar power, which could help pre-position cargo for future human missions to the Red Planet. As part of ARM, a robotic spacecraft will rendezvous with a near-Earth asteroid and redirect an asteroid mass to a stable orbit around the moon. Astronauts will explore the asteroid mass in the 2020’s, helping test modern spaceflight capabilities like new spacesuits and sample return techniques. Astronauts at NASA’s Johnson Space Center in Houston have already begun to practice the capabilities needed for the mission.
More information about asteroids and near-Earth objects is available at:
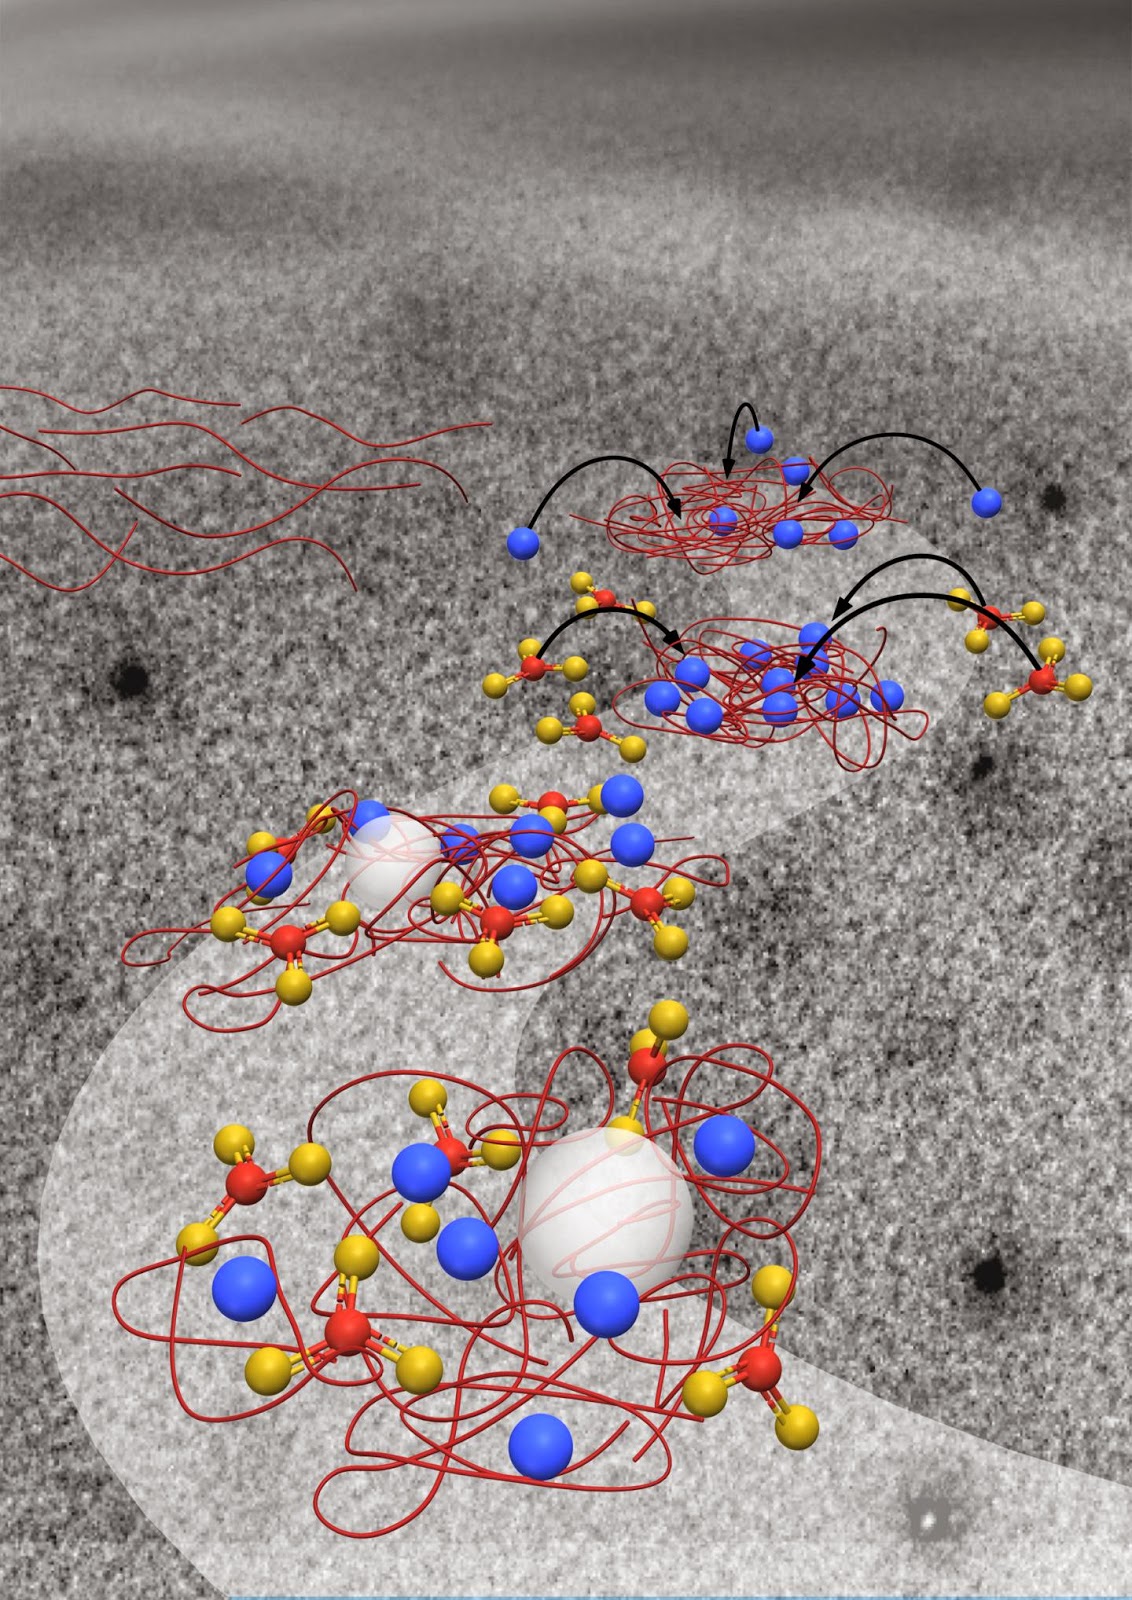
Nature packs away carbon in chalk, shells and rocks made by marine organisms that crystallize calcium carbonate. Now, research suggests that the soft, organic scaffolds in which such crystals form guide crystallization by soaking up the calcium like an “ion sponge,” according to new work in Nature Materials. Understanding the process better may help researchers develop advanced materials for energy and environmental uses, such as for removing carbon dioxide from the atmosphere.
Using a powerful microscope that lets researchers see the formation of crystals in real time, a team led by the Department of Energy’s Pacific Northwest National Laboratory found that negatively charged molecules — such as carbohydrates found in the shells of mollusks — control where, when, and how calcium carbonate forms.
These large macromolecules do so by directing where calcium ions bind in the scaffold. The negative charge on the macromolecules attract the positively charged calcium ions, placing them in the scaffold through so-called ion binding. Rather than these chemical interactions, researchers had previously thought the scaffold guides crystallization by providing the best energetic environment for the crystal.
“This whole story is different from what we had believed to be the case,” said lead researcher Jim De Yoreo at PNNL. “Ion binding defines a completely different mechanism for controlling crystallization than does making a perfect interface between the crystal and the scaffold. And it is one that should provide us with considerable control.”
Missing Piece
Previous work showed that calcium carbonate takes multiple routes to becoming a mineral. All of the common crystal forms, including calcite (found in limestone), aragonite (found in mother-of-pearl), and vaterite (found in gallstones), crystallized from solution, often at the same time. But in some cases, droplet-like particles of uncrystallized material known as amorphous calcium carbonate, or ACC, formed first and then transformed into either aragonite or vaterite.
Those experiments, however, lacked a crucial element found in the biological world, where minerals form within an organic scaffold. For example, pearls develop in the presence of negatively charged carbohydrates and proteins from the oyster.
In addition, biologically built minerals often start out as ACC. De Yoreo and his colleagues wondered what role macromolecules — carbs, proteins or other large molecules with a negative charge — play.
To find out, De Yoreo and team allowed calcium carbonate to mineralize under a specialized transmission electron microscope at the Molecular Foundry, a DOE Office of Science User Facility at DOE’s Lawrence Berkeley National Laboratory. Collaborators also hailed from Eindhoven University of Technology in The Netherlands.
But this time they added a negatively charged macromolecule, a polymer called polystyrene sulfonate. Without the polymer, they saw crystals of vaterite and a little calcite forming randomly under the microscope. With the polymer, however, ACC always appeared first and vaterite formed much later.
Because the polymer interfered with vaterite formation, the team looked a little closer at what the polymer was doing. When they mixed the polymer with the calcium first before introducing carbonate, they found globules of the polymer forming in the solution. They determined that the polymer had soaked up more than half of the calcium to form the globules.
When the researchers then added carbonate to the experimental chamber, ACC formed instead and it only appeared within these globules. The ACC grew in size until the supply of calcium ran out. The researchers concluded that calcium binding to the polymer is the key to forming the ACC and controlling where it forms.
Mineral Motivation
The team realized that controlling crystallization by attracting calcium ions to the macromolecules was not the way researchers had long thought it happened.
There are two main ways that calcium carbonate molecules might be persuaded to come together to form a mineral. One is by providing an environment where the atoms assemble in the crystal in the least energetic way possible, sort of like organizing a classroom full of schoolchildren by having them sit in seats arranged neatly in rows side-by-side in the corner of the room.
Another is via chemical binding — negatively or positively charged atoms or molecules called ions attract one another, sort of like waving popsicles in front of those kids to gather them in one spot.
Researchers had long suspected that organic scaffolds caused calcium carbonate to mineralize and find its most stable form, calcite, by creating low energy surfaces where the ions could easily arrange themselves in rows side-by-side. In fact, scientists had seen this previously with highly organized films of organic molecules.
But in this study, the polymer, like the popsicle, pulls in the calcium before minerals can form and turns it into ACC. This showed the researchers that ion binding can completely overwhelm any lower-energy advantage that crystallization on or outside of the polymer might confer.
“This is definitely another means of controlling nucleation,” said De Yoreo. “Carbonate ions follow the calcium into the globules. They don’t crystallize outside the globules because there’s not enough calcium there to make a mineral. It’s like bank robbers out for a heist. They go where the money is.”
“This work opens new avenues for the investigation of biomineralization. Can we extend these experiments beyond the simple polymers we used here? To what extent can we rebuild parts of the biological machinery inside the microscope?” said co-author Prof. Nico Sommerdijk of Eindhoven University of Technology. “Answering these questions may eventually allow us to understand the biological mineral formation and apply its principles to design green, sustainable routes for the production of advanced materials.”
Reference :
This work was supported by the U.S. Department of Energy Office of Science and the Dutch Science Foundation.
Reference: Paul J.M. Smeets, Kang Rae Cho, Ralph G.E. Kempen, Nico A.J.M. Sommerdijk, & James J. De Yoreo. Calcium carbonate nucleation driven by ion binding in a biomimetic matrix revealed by In situ electron microscopy, Nature Materials Month Day, Year, DOI: 10.1038/NMAT4193.
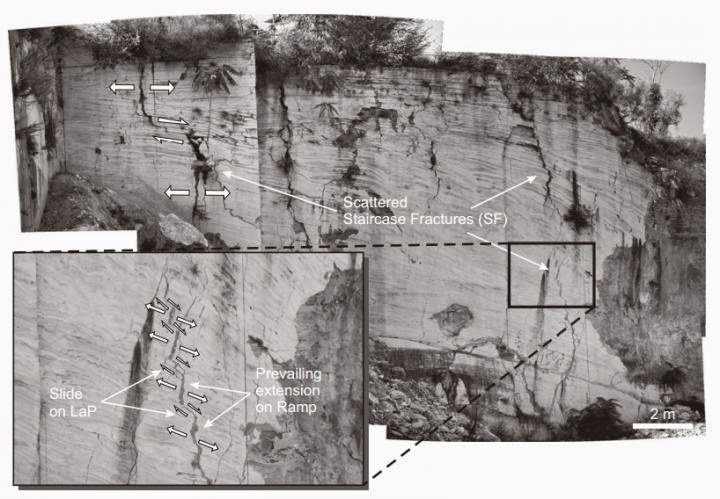
Figure 7 from Maggi et al.: Examples of gentle slope deposits are shown. Scattered fractures with staircase geometry show prevailing extension in the ramps and sliding along the lamination/layer parallel (LaP) segments. Credit: GSA Bulletin and Maggi et al.
Boulder, Colo., USA – Matteo Maggi and colleagues from Italy and Brazil present a new model of the development of fractures showing a stairway trajectory, commonly occurring in finely laminated rock, such microbialites and travertines. These fractures strongly enhance permeability by connecting several highly porous zones enveloped in tight impermeable levels. Understanding and predicting this fracture pattern geometry, distribution, and interconnection is valuable not only for locating water supplies, but also for oil, gas, and geothermal exploration.
Major discoveries of hydrocarbon have recently been made in continental (lacustrine) microbial carbonates in the Brazilian South Atlantic margin, some of which exhibit a texture similar to those usually observed in travertines. Understanding of these lacustrine carbonates is still at an early stage. Given that in modern rift settings, vent-related thermal (travertine) and non-thermal (tufa) carbonates are a major component, the proposed conceptual model of staircase fracture localization contributes to the preparation of a model for the occurrence of high-permeability pathways in hydrocarbon and geothermal microbial reservoirs.
Reference:
Staircase fractures in microbialites and the role of lamination-related mechanical anisotropy: The example of the Acquasanta Terme travertine deposits (central Italy)
M. Maggi et al., Università degli Studi Roma Tre, Roma, Italy. Published online ahead of print on 22 Jan. 2015; http://dx.doi.org/10.1130/B31163.1.
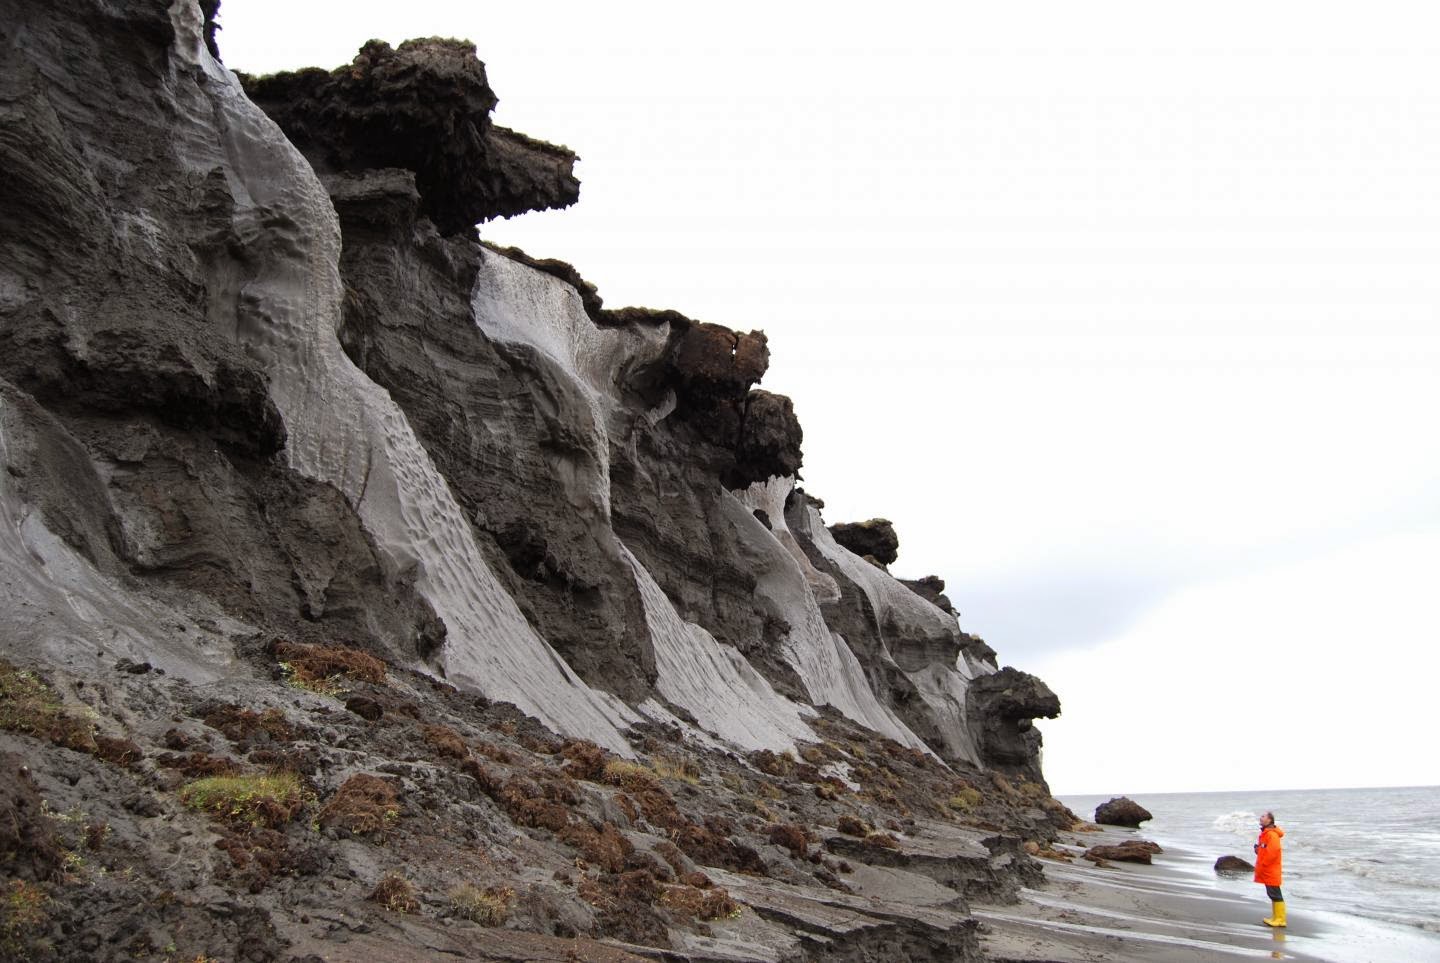
Exposed ice wedges at the coast of the Siberian island Muostakh. With this picture in mind, one can understand, why early researchers thought ice wedges could be nothing else than buried glaciers. Credit Photo: Thomas Opel, Alfred-Wegener-Institut
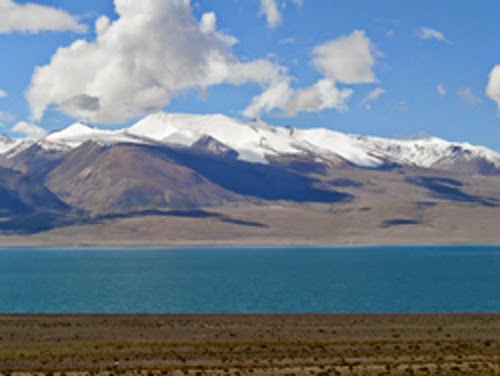
For the first time, researchers at the Alfred Wegener Institute have successfully decoded climate data from old permafrost ground ice and reconstructed the development of winter temperatures in Russia’s Lena River Delta. Their conclusions: over the past 7,000 years, winter temperatures in the Siberian permafrost regions have gradually risen. The study will be published today on Nature Geoscience’s website.
You won’t find any glaciers in Russia’s Lena River Delta. Unlike in Antarctica or Greenland, in the Siberian tundra ice doesn’t form above ground on hillsides or elevated plains. Rather, it forms directly underground as ice wedges.
“Ice wedges are a typical feature of permafrost regions. They are formed when the permanently frozen soil contracts in response to intensively cold winter temperatures, causing it to crack. When the snow melts in spring, the melt water fills these cracks. Since the ground temperature is roughly minus ten degrees Celsius, the water refreezes immediately. If this process repeats itself winter after winter, over the decades and centuries an ice body shaped like a giant wedge is formed,” explains Dr Hanno Meyer, a permafrost researcher at the AWI Potsdam and first author of the study.
With a depth of up to 40 metres and a width of up to six metres, the ice wedges of the Siberian Arctic may not be as physically impressive as Antarctic glaciers. However the ice wedges, some of which are more than 100,000 years old, store climate information in much the same way, allowing scientists to investigate them using glacier research methods. “The melt water always comes from the snowfall of a single winter. Therefore, when it freezes in these frost cracks, information on the winter temperatures in that specific year is also preserved. We have now succeeded for the first time in using oxygen isotope analysis to access the temperature information stored in the ice and compile it into a climate curve for the past 7,000 years,” states AWI researcher and co-author Dr Thomas Opel.
The new information represents the first well dated winter-temperature data from the Siberian permafrost regions and indicates a clear trend: “Over the past 7,000 years, the winters in the Lena River Delta have steadily warmed – a trend we haven’t seen in almost any other Arctic climate archive,” says Hanno Meyer. As the permafrost expert explains, the likely reason is: “To date, primarily fossilised pollen, diatoms and tree rings from the Arctic have been used to reconstruct the climate of the past. But they mostly record temperature information from the summer, when the plants grow and bloom. Ice wedges are among the few archives that can exclusively record winter data.”
Further, the new data will allow the researchers to fill an important gap: “Most climate models indicate a long-term cooling in the summer and long-term warming in the winter for the Arctic over the past 7,000 years. But until now, there has been no temperature data to support the second claim, essentially because the majority of climate archives record information from the summer. Now we can finally demonstrate that ice wedges contain similar winter-temperature information as predicted by climate models,” says AWI modeller and co-author Dr Thomas Laepple.
At this point, the researchers can’t exactly determine yet how many degrees the Arctic winters have warmed. As Thomas Opel explains, “The results of the oxygen isotope analysis can only tell us whether and how the isotopic composition has changed. If it rises, it indicates a warming. But the exact extent of warming is something we can’t yet make a statement on.”
Nevertheless, the researchers found clear indications for the causes of this warming.
According to Hanno Meyer: “The curve shows a clear partitioning. Up to the dawn of industrialisation around 1850, we can attribute the development to changes in the Earth’s position relative to the sun. In other words, the duration and intensity of the solar radiation increased from winter to winter, causing temperatures to rise. But with industrialisation and the strong increase in the emissions of greenhouse gases like carbon dioxide, this was supplemented by the anthropogenic greenhouse effect. Starting at that point, our data curve shows a major increase that clearly differs from the gradual warming in the previous phase.”
In a next step, the researchers will investigate whether the same indicators for a gradual rise in winter temperatures in the Arctic can also be found in other permafrost regions around the globe. As Thomas Opel elaborates: “We already have data from an area 500 kilometres east of the Lena River Delta that supports our findings. But we don’t know how it looks for example in the Canadian Arctic. We suppose the development was similar there, but don’t yet have evidence to back up that assumption.”
The data for the new Lena River Delta temperature curve comes from 42 ice samples, which AWI researchers collected over the course of several expeditions from 13 ice wedges that the river had uncovered during flooding. “For the purposes of the study, we only included samples for which we could clearly determine the age. Fortunately, for ice wedges this is relatively simple as a large number of plant remains and other organic material enters the ground ice during snow melt- and we can use the radiocarbon method to precisely determine the age of this material,” says Hanno Meyer.
Reference :
The study was supported by the Alfred Wegener Institute, the German Research Foundation and the Initiative and Networking Fund of the Helmholtz Association (grant VG-900NH).
The paper is going to be published on the 26th of January 2015 on Nature Geoscience’s website under following title: Hanno Meyer, Thomas Opel, Thomas Laepple, Alexander Yu Dereviagin, Kirstin Hoffmann und Martin Werner (2015): Long-term winter warming trend in the Siberian Arctic during the mid- to late Holocene, Nature Geoscience, Vol 8, DOI: 10.1038/ngeo2349
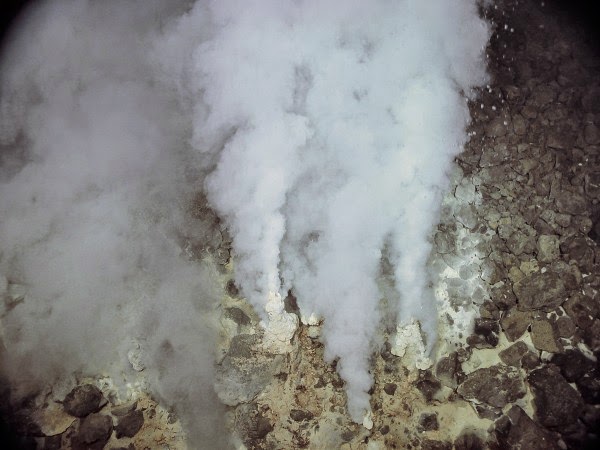
The unique temperature conditions of hydrothermal vents like this one could have favored the evolution of complex life. Credit : NOAA
On ancient Earth, the earliest life encountered a paradox. Chains of RNA—the ancestor of DNA—were floating around, haphazardly duplicating themselves. Scientists know that eventually, these RNA chains must have become longer and longer, setting the stage for the evolution of complex life forms like amoebas, worms, and eventually humans. But under all current models, shorter RNA molecules, having less material to copy, would have reproduced faster, favoring the evolution of primitive organisms over complex ones. Now, new research offers a potential solution: Longer RNA chains could have hidden out in porous rocks near volcanic sites such as hydrothermal ocean vents, where unique temperature conditions might have helped complex organisms evolve.
Hydrothermal vents are fissures in Earth’s crust that pump out superheated water. They would have been common on early Earth, which was more tectonically active than the planet is today, says Dieter Braun, an experimental biophysicist at Ludwig Maximilian University in Munich, Germany. The water in hydrothermal vents is particularly rich in nutrients, making them promising sites for the origin of life.
To figure out if hydrothermal vents could have given the evolution of complex life a boost, Braun and his colleagues examined the physics of a theoretical single pore in the rock surrounding a vent. The pore is open at the top and at the bottom and filled with a dilute solution of RNA molecules of various lengths. The solution on the hot side—the one closer to the stream of superheated water—would become less dense and rise up through the pore. Some of it would escape at the top, to be replenished by more nutrient-rich fluid entering at the bottom. The remainder would diffuse across to the cold side of the pore and drop back down. A complex physical effect called thermophoresis causes charged molecules in a solution to accumulate in colder water, and the longer chains, having more charge, would do this more often than shorter chains. Therefore, the shorter RNA chains would be more likely to escape out of the top of the pore, whereas the longer ones would stay trapped inside where, continually fed by nutrients, they could reproduce. Better still, Braun says, the continuous temperature cycling could actually help split the RNA double helix apart, making it easier for it to reproduce.
To test this elaborate hypothesis, Braun and his colleagues constructed a simulated piece of porous rock from a network of tiny glass capillary tubes heated on one side. They allowed dissolved fragments of DNA to be washed into the tubes from the bottom. Ideally, they would have used RNA, but Braun explains that there’s no good way to reproduce RNA in a lab, whereas it’s easy to reproduce DNA with a standard laboratory process called PCR. “All the thermophoresis and the characteristics of the trapping mechanism are the same for DNA and RNA,” he says. Once they let the experiment run, the researchers found that longer chains of DNA were more likely to accumulate inside the tubes than shorter chains were. As a result, the longer strands reproduced much better inside the pores and their populations grew, whereas the shorter strands were diluted so much that they went extinct, the team reports online today in Nature Chemistry.
It’s “nice chemistry,” says marine chemist Jeffrey Bada of the University of California (UC), San Diego, but he is not convinced that hydrothermal vents, or any other likely habitat on early Earth, could have provided the conditions created in the lab: “The processes outlined are not likely to take place on a significant scale on the Earth or elsewhere.” Biochemist Irene Chen of UC Santa Barbara disagrees and even thinks the research opens a door to studying environments beyond just volcanic ones. She suggests rock pores hotter on one side than the other could result from solar, as well as hydrothermal, heating, expanding the types of environments that could have favored the evolution of complex life. A physical environment that could plausibly have existed on the early Earth “actually selects for longer RNA sequences,” she says. “The extra length is basically room for biological creativity.”
Dramatic time lapse video captured by local media showed the moment when Mexico’s Colima volcano, known locally as the ‘Fire Volcano’ erupted, sending a large plume of ash and gases into the air on Wednesday.
In the most comprehensive study of its kind, University of Kansas geologists have unraveled one of the geologic mysteries of Tibet. The research, recently published online in Nature Geoscience, shows that it is the northward movement of India, thrusting under Tibet’s surface like a shovel pushing through a winter’s snow, that is causing the largest and thickest mountains on Earth to stretch in the east-west direction.
The paper is the work of Mike Taylor, associate professor of geology, and two of his former students, Richard Styron and Kurt Sundell. The lead author, Styron, now heads Earth Analysis, a consulting firm in Seattle.
“Understanding how north-trending rift valleys formed within the Tibetan plateau is something that has puzzled geoscientists for over three decades,” Taylor said. “I’ve sought the answer myself since I was a first-year graduate student 14 years ago. It’s been an extremely satisfying experience to be part of the group of KU geologists who have brought it all together.”
At 1,000 kilometers in width and 1,500 kilometers in east-west length, the Tibetan plateau is the largest continental mountain belt on Earth. The plateau is bordered to the south by the Himalayas, which include the Earth’s tallest mountains. Geoscientists have puzzled over the mechanism that created the two and how they began to stretch and move today, but many factors have hampered research, including the region’s remote location. To reach their research sites, KU geoscientists traveled to Lhasa, the capital of Tibet, then made a two-week drive by jeep farther into country’s interior.
The team studied the mechanism that formed and continues to mold the mountains by collecting and analyzing rock samples. Sometimes hiking nearly 14 miles across a single mountain range and back, they collected more than 60 samples from a long rift valley that cuts the Tibetan plateau and forms large mountains with extensive granite exposures.
Granite is an igneous rock that forms when magma cools and solidifies at relatively deep depths. By analyzing a common mineral found in granite called zircon, the team determined when the rock cooled, which allowed them to date when the formation of the mountains exhumed the zircon from the Earth’s hot interior and brought it to cooler regions near the planet’s surface.
The geoscientists found that the zircon samples began to cool about 15 million years ago, which is when Tibet began “stretching” in the east-west direction. By running thousands of computer models on their data, they discovered that the modern rift valley first formed in the south and then propagated northward, much like a zipper ripping open. The rate at which this massive zipper tore Tibet apart was 15 millimeters per year and continues today, a rate that is strikingly similar to the rate at which India is being shoved under the Himalayas. By comparing their work to previous geophysical studies of Tibet’s deep interior, the authors concluded that the acceleration of the rifting could be attributed to the insertion of India underneath the Tibetan plateau.
“The current elevation and the pattern of the rift valleys and mountains can be explained as Tibet’s response to the insertion of India,” Taylor said. “The whole process of mountain building is essentially driven by India’s northward motion.”
Taylor’s team is now focusing its research efforts on Nepal and the Andes. The National Science Foundation, American Chemical Society and the General Research Fund of the University of Kansas funded the Tibet project.
Reference:
“Accelerated extension of Tibet linked to the northward underthrusting of Indian crust.” Nature Geoscience (2015) DOI: 10.1038/ngeo2336
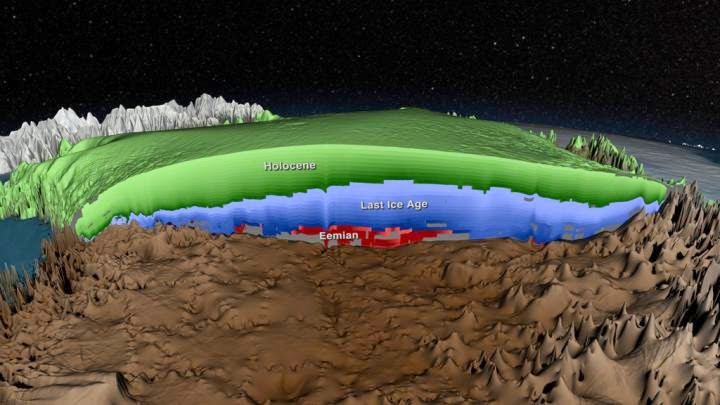
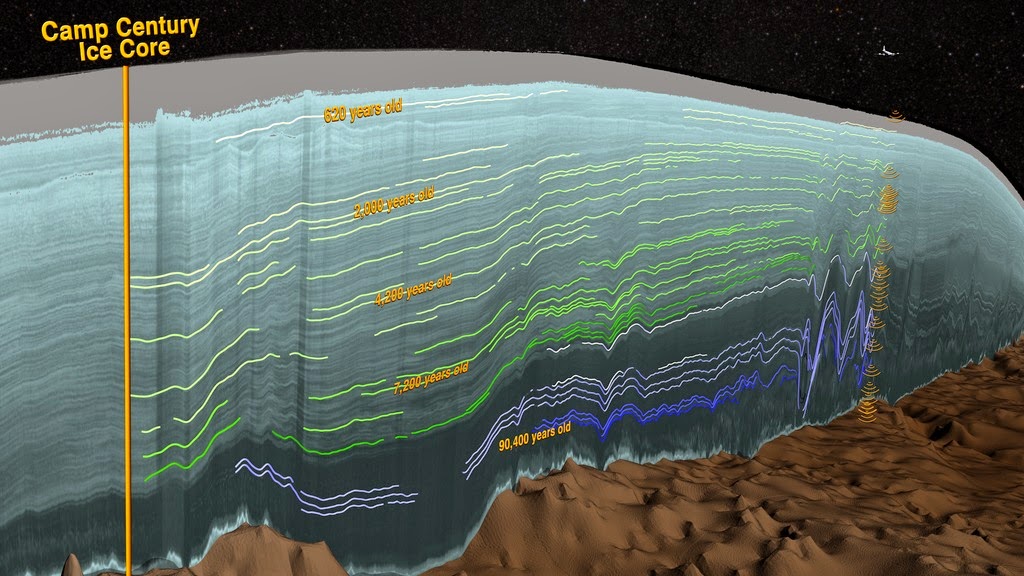
This is a cross-section of the age of the Greenland Ice Sheet. Layers determined to be from the Holocene period, formed during the past 11,700 years, are shown in… view more Credit: NASA
Scientists using ice-penetrating radar data collected by NASA’s Operation IceBridge and earlier airborne campaigns have built the first comprehensive map of layers deep inside the Greenland Ice Sheet, opening a window on past climate conditions and the ice sheet’s potentially perilous future.
This new map allows scientists to determine the age of large swaths of the second largest mass of ice on Earth, an area containing enough water to raise ocean levels by about 20 feet.
“This new, huge data volume records how the ice sheet evolved and how it’s flowing today,” said Joe MacGregor, the study’s lead author, a glaciologist at The University of Texas at Austin Institute for Geophysics (UTIG), a unit of the Jackson School of Geosciences.
Greenland’s ice sheet has been losing mass during the past two decades, a phenomenon accelerated by warming temperatures. Scientists are studying ice from different climate periods in the past to better understand how the ice sheet might respond in the future.
Ice cores offer one way of studying the distant past. These cylinders of ice drilled from the ice sheet hold evidence of past snow accumulation and temperature and contain impurities such as dust and volcanic ash compacted over hundreds of thousands of years. These layers are visible in ice cores and can be detected with ice-penetrating radar.
Ice-penetrating radar works by sending radar signals into the ice and recording the strength and return time of reflected signals. From those signals, scientists can detect the ice surface, sub-ice bedrock and layers within the ice.
Researchers have developed 3-D maps of the age of the ice within the Greenland Ice Sheet. The new research will help scientists determine what may happen to the ice sheet as the climate changes.
New techniques used in this study allowed scientists to efficiently pick out these layers in radar data. Prior studies had mapped internal layers, but not at the scale made possible by these newer, faster methods.
Another major factor in this study was the scope of Operation IceBridge’s measurements across Greenland, which included flights that covered distances of tens of thousands of kilometers across the ice sheet.
“IceBridge surveyed previously unexplored parts of the Greenland Ice Sheet and did it using state-of-the-art CReSIS radars,” said study co-author Mark Fahnestock, an IceBridge science team member and glaciologist from the Geophysical Institute at the University of Alaska Fairbanks (UAF-GI).
CReSIS is the Center for Remote Sensing of Ice Sheets, a National Science Foundation science and technology center headquartered at the University of Kansas in Lawrence, Kansas.
IceBridge’s flight lines often intersect ice core sites where other scientists have analyzed the ice’s chemical composition to map and date layers in the ice. These core data provide a reference for radar measurements and provide a way to calculate how much ice from a given climate period exists across the ice sheet, something known as an age volume. Scientists are interested in knowing more about ice from the Eemian period, a time from 115,000 to 130,000 years ago that was about as warm as today. This new age volume provides the first data-driven estimate of where Eemian ice may remain.
Comparing this age volume to simple computer models helped the study’s team better understand the ice sheet’s history. Differences in the mapped and modeled age volumes point to past changes in ice flow or processes such as melting at the ice sheet’s base. This information will be helpful for evaluating the more sophisticated ice sheet models that are crucial for projecting Greenland’s future contribution to sea-level rise.
“Prior to this study, a good ice-sheet model was one that got its present thickness and surface speed right. Now, they’ll also be able to work on getting its history right, which is important because ice sheets have very long memories,” said MacGregor.
Video:
Reference :
This study was published online on Jan. 16, 2015, in Journal of Geophysical Research: Earth Surface. It was a collaboration among scientists at UTIG, UAF-GI, CReSIS and the Department of Earth System Science at the University of California, Irvine. It was supported by NASA’s Operation IceBridge and the National Science Foundation’s Arctic Natural Sciences.
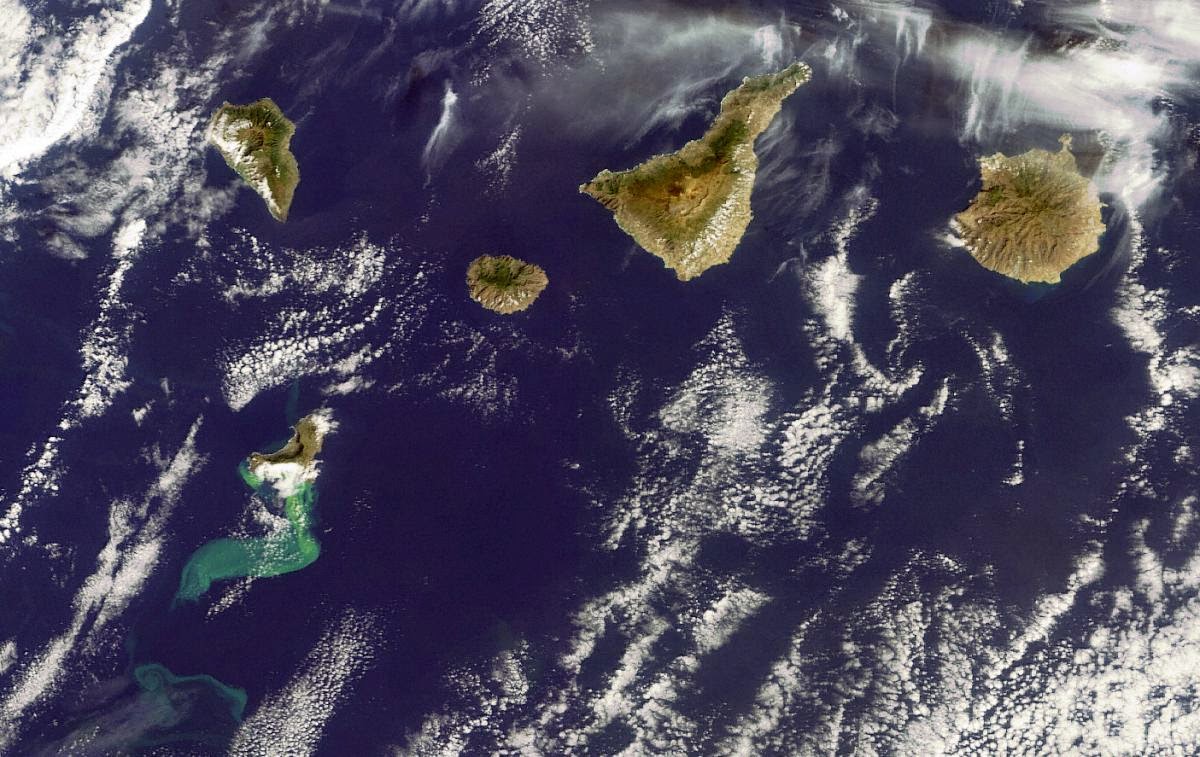
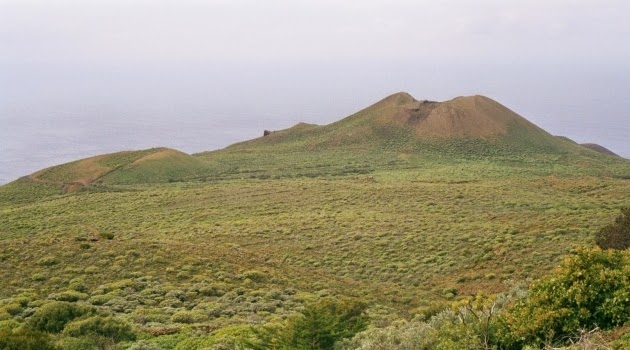
El Hierro, the westernmost of the Canary Islands. Photograph: Eckhard Pecher
The most recent eruption on the Canary Islands – at El Hierro in 2011 – produced spectacularly enigmatic white ‘floating rocks’ that originated from the layers of oceanic sedimentary rock underneath the island. An international team of researchers, led from Uppsala University, use microscopic fossils found in the rocks to shed new light on the long-standing puzzle about the origin of the Canary Islands.
Despite being violently transported through the volcano, some of the rocks produced by the El Hierro eruption contain microscopic fossils of delicate single-celled marine organisms, making the survival of these fossils all the more extraordinary.
A new study published today in Scientific Reports, an open access journal of the Nature Publishing Group, by a team of scientists from the universities of Uppsala, Las Palmas de Gran Canaria, Lisbon, and the Research Council of Spain, uses these fossil time-travellers to date the sedimentary layers beneath El Hierro and, in turn, shed new light on the long-standing puzzle about the origin of the Canary Islands.
The origin and life cycle of oceanic volcanoes, such as the Canary Islands, has long been a source of debate among natural scientists. There are two competing models for the origin of the Canaries – one in which ocean floor fractures control the location of volcanic activity, and another in which an anomalously hot plume of molten rock from the Earth’s mantle feeds island growth from below.
A cornerstone of the debate concerns the validity of an age-progression along the island chain. A fixed mantle plume under the roughly eastwards moving African tectonic plate would cause the islands and the pre-volcanic ocean sediments underlying them to become progressively younger towards the westernmost island of El Hierro. The fracture model, in turn, would give rise to randomly distributed island ages.
‘Fossils and volcanoes are not usually compatible with each other, which is what makes these samples so special’, says Valentin Troll, professor at the Department of Earth Sciences at Uppsala University, who led the study that is now being published in Scientific Reports.
The study offers a unique perspective on the plume versus fracture model debate for the origin of the Canary Islands. The fossils are de facto witnesses of the pre-island environment. Researchers can now place constraints on the ages of the sedimentary strata present before island-building and, indeed, on the initiation of island-building itself. In combination with known sediment ages from the east of the archipelago, it is now clear that the oceanic sediments become younger towards the west of the island chain, thus verifying an age-progression among the islands. These findings are in strong agreement with the mantle plume model for the origin of the Canary Islands and thus contribute to our wider understanding of ocean island volcano genesis.
Reference:
Kirsten Zaczek, Valentin R. Troll, Mario Cachao, Jorge Ferreira, Frances M. Deegan, Juan Carlos Carracedo, Vicente Soler, Fiona C. Meade, Steffi Burchardt. Nannofossils in 2011 El Hierro eruptive products reinstate plume model for Canary Islands. Scientific Reports, 2015; 5: 7945 DOI: 10.1038/srep07945
Note : The above story is based on materials provided by Uppsala Universitet. The original article was written by Linda Koffmar.
New laser-driven shock compression experiments on stishovite, a high-density form of silica, provide thermodynamic and electrical conductivity data at unprecedented conditions and reveal the unusual properties of rocks deep inside large exoplanets and giant planets. Credit: Photo by E. Kowaluk, LLE
New laser-driven compression experiments reproduce the conditions deep inside exotic super-Earths and giant planet cores, and the conditions during the violent birth of Earth-like planets, documenting the material properties that determined planet formation and evolution processes.
The experiments, reported in the Jan. 23 edition of Science, reveal the unusual properties of silica — the key constituent of rock — under the extreme pressures and temperatures relevant to planetary formation and interior evolution.
Using laser-driven shock compression and ultrafast diagnostics, Lawrence Livermore National Laboratory (LLNL) physicist Marius Millot and colleagues from Bayreuth University (Germany), LLNL and the University of California, Berkeley were able to measure the melting temperature of silica at 500 GPa (5 million atmospheres), a pressure comparable to the core-mantle boundary pressure for a super-Earth planet (5 Earth masses), Uranus and Neptune. It also is the regime of giant impacts that characterize the final stages of planet formation.
“Deep inside planets, extreme density, pressure and temperature strongly modify the properties of the constituent materials,” Millot said. “How much heat solids can sustain before melting under pressure is key to determining a planet’s internal structure and evolution, and now we can measure it directly in the laboratory.”
In combination with prior melting measurements on other oxides and on iron, the new data indicate that mantle silicates and core metal have comparable melting temperatures above 300-500 GPa, suggesting that large rocky planets may commonly have long-lived oceans of magma — molten rock — at depth. Planetary magnetic fields can be formed in this liquid-rock layer.
“In addition, our research suggests that silica is likely solid inside Neptune, Uranus, Saturn and Jupiter cores, which sets new constraints on future improved models for the structure and evolution of these planets,” Millot said.
Those advances were made possible by a breakthrough in high-pressure crystal growth techniques at Bayreuth University in Germany. There, Natalia Dubrovinskaia and colleagues managed to synthesize millimeter-sized transparent polycrystals and single crystals of stishovite, a high-density form of silica (SiO2) usually found only in minute amounts near meteor-impact craters.
Those crystals allowed Millot and colleagues to conduct the first laser-driven shock compression study of stishovite using ultrafast optical pyrometry and velocimetry at the Omega Laser Facility at the University of Rochester’s Laboratory for Laser Energetics.
“Stishovite, being much denser than quartz or fused-silica, stays cooler under shock compression, and that allowed us to measure the melting temperature at a much higher pressure,” Millot said. “Dynamic compression of planetary-relevant materials is a very exciting field right now. Deep inside planets hydrogen is a metallic fluid, helium rains, fluid silica is a metal and water may be superionic.”
In fact, the recent discovery of more than 1,000 exoplanets orbiting other stars in our galaxy reveals the broad diversity of planetary systems, planet sizes and properties. It also sets a quest for habitable worlds hosting extraterrestrial life and shines new light on our own solar system. Using the ability to reproduce in the laboratory the extreme conditions deep inside giant planets, as well as during planet formation, Millot and colleagues plan to study the exotic behavior of the main planetary constituents using dynamic compression to contribute to a better understanding of the formation of the Earth and the origin of life.
Reference:
M. Millot, N. Dubrovinskaia, A. ernok, S. Blaha, L. Dubrovinsky, D. G. Braun, P. M. Celliers, G. W. Collins, J. H. Eggert, R. Jeanloz. Shock compression of stishovite and melting of silica at planetary interior conditions. Science, 2015; 347 (6220): 418 DOI: 10.1126/science.1261507
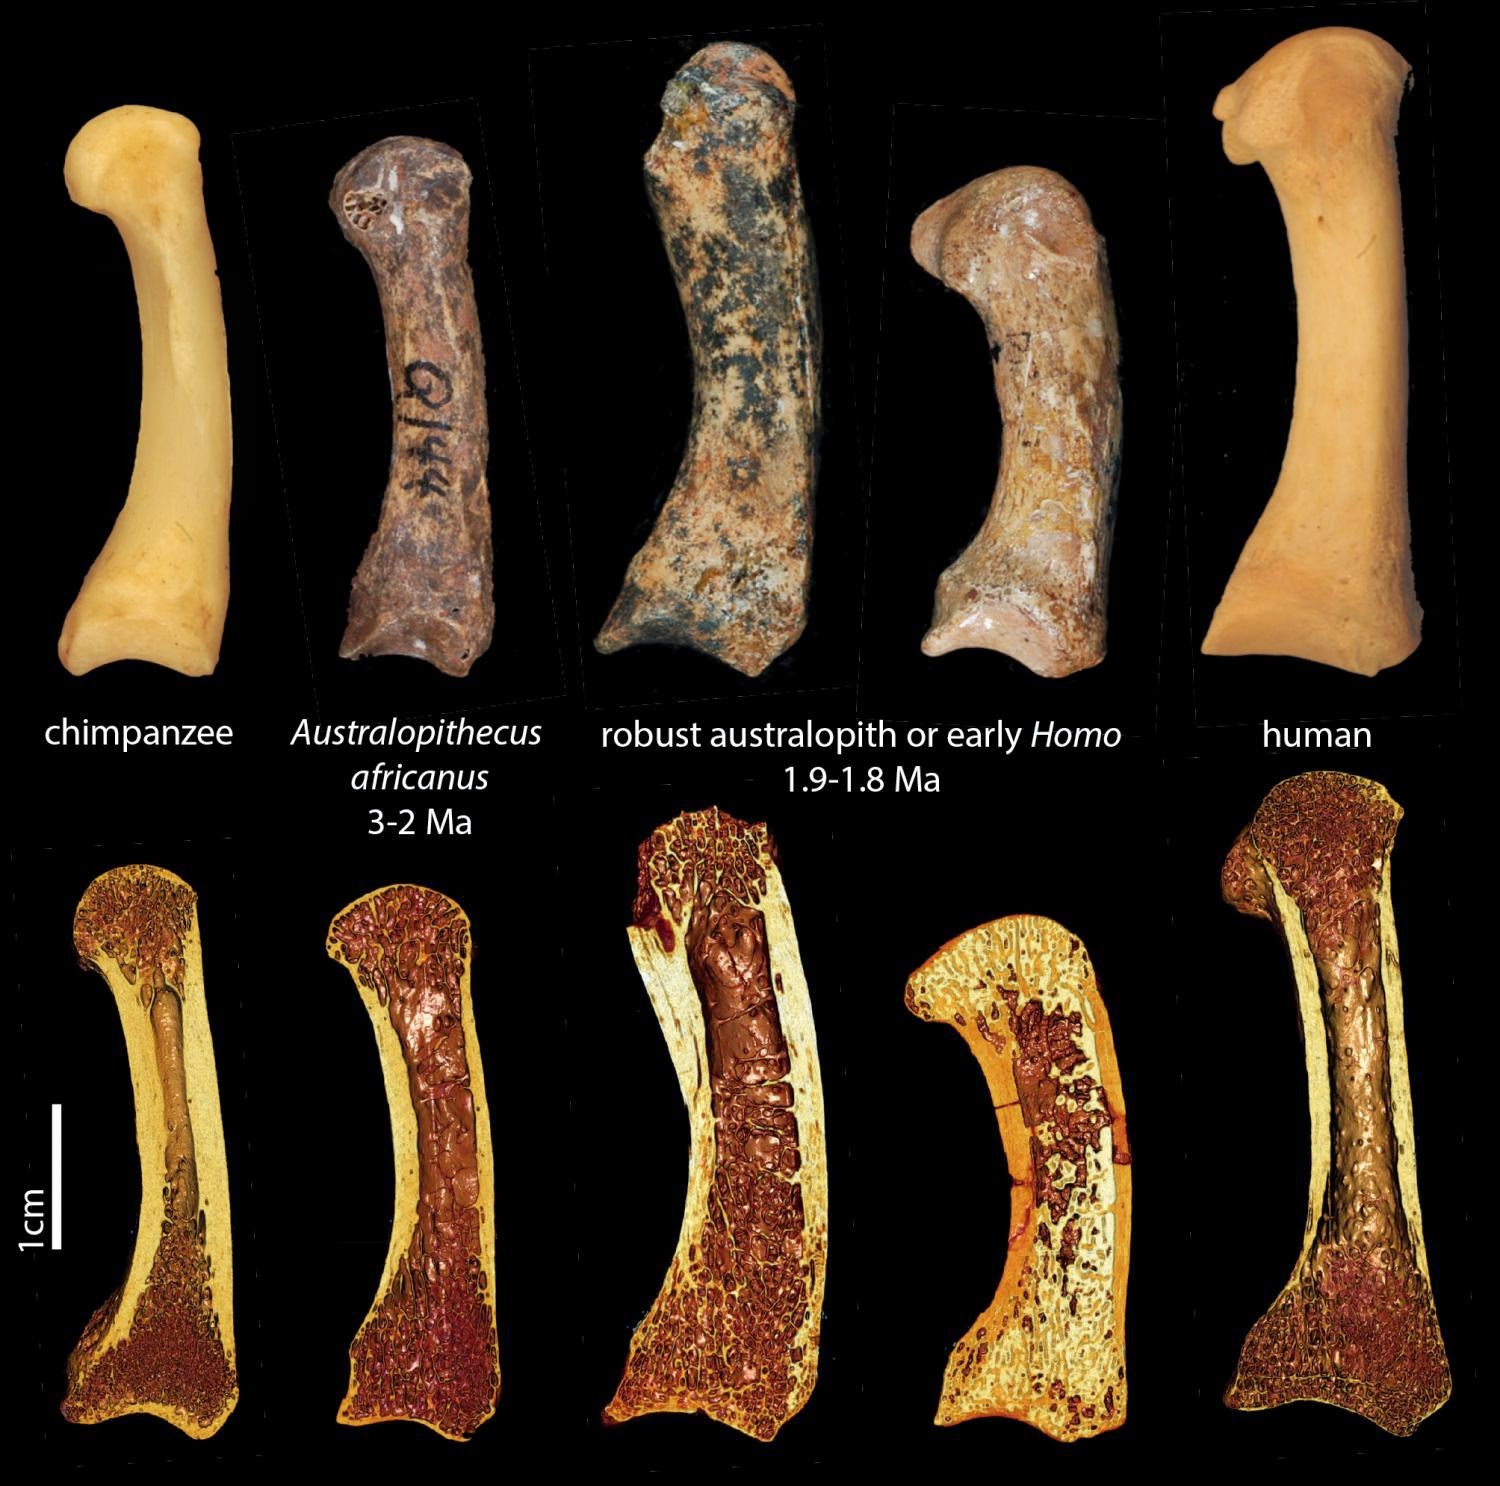
Top row: First metacarpals of the thumb in (from left to right) a chimpanzee, fossil hominins Australopithecus africanus (StW 418) and two specimens belonging to either a robust australopiths or early Homo (SKX 5020 and SK 84), and a human. The bottom row shows 3D renderings from the microCT scans of the same specimens, showing a cross-section of the trabecular structure inside. Ma, million years ago. Credit: T.L. Kivell
New research suggests pre-Homo human ancestral species, such as Australopithecus africanus, used human-like hand postures much earlier than was previously thought.
Anthropologists from the University of Kent, working with researchers from University College London, the Max Planck Institute for Evolutionary Anthropology in Leipzig (Germany) and the Vienna University of Technology (Austria), have produced the first research findings to support archaeological evidence for stone tool use among fossil australopiths 3-2 million years ago.
The distinctly human ability for forceful precision (e.g. when turning a key) and power “squeeze” gripping (e.g. when using a hammer) is linked to two key evolutionary transitions in hand use: a reduction in arboreal climbing and the manufacture and use of stone tools. However, it is unclear when these locomotory and manipulative transitions occurred.
Dr Matthew Skinner, Senior Lecturer in Biological Anthropology and Dr Tracy Kivell, Reader in Biological Anthropology, both of Kent’s School of Anthropology and Conservation, used new techniques to reveal how fossil species were using their hands by examining the internal spongey structure of bone called trabeculae. Trabecular bone remodels quickly during life and can reflect the actual behaviour of individuals in their lifetime.
The researchers first examined the trabeculae of hand bones of humans and chimpanzees. They found clear differences between humans, who have a unique ability for forceful precision gripping between thumb and fingers, and chimpanzees, who cannot adopt human-like postures. This unique human pattern is present in known non-arboreal and stone tool-making fossil human species, such as Neanderthals.
The research, titled “Human-like hand use in Australopithecus africanus, shows that Australopithecus africanus,” a 3-2 million-year-old species from South Africa traditionally considered not to have engaged in habitual tool manufacture, has a human-like trabecular bone pattern in the bones of the thumb and palm (the metacarpals) consistent with forceful opposition of the thumb and fingers typically adopted during tool use.
These results support previously published archaeological evidence for stone tool use in australopiths and provide skeletal evidence that our early ancestors used human-like hand postures much earlier and more frequently than previously considered.
Reference:
M. M. Skinner, N. B. Stephens, Z. J. Tsegai, A. C. Foote, N. H. Nguyen, T. Gross, D. H. Pahr, J.-J. Hublin, T. L. Kivell. Human-like hand use in Australopithecus africanus. Science, 2015; 347 (6220): 395 DOI: 10.1126/science.1261735
Note: The above story is based on materials provided by University of Kent.