back to top
27.8 C
New York
Sunday, April 20, 2025
Home Blog Page 249

Doubt cast on global firestorm generated by dino-killing asteroid

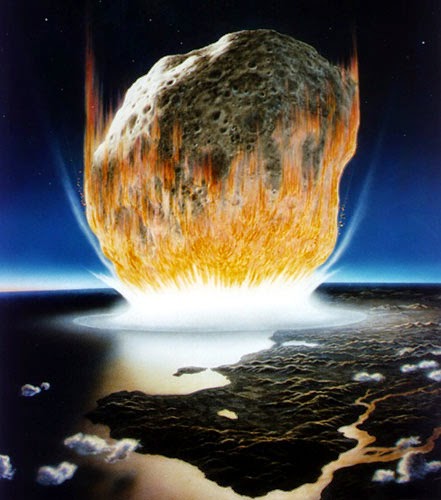
Pioneering new research has debunked the theory that the asteroid that is thought to have led to the extinction of dinosaurs also caused vast global firestorms that ravaged planet Earth.

A team of researchers from the University of Exeter, University of Edinburgh and Imperial College London recreated the immense energy released from an extra-terrestrial collision with Earth that occurred around the time that dinosaurs became extinct. They found that the intense but short-lived heat near the impact site could not have ignited live plants, challenging the idea that the impact led to global firestorms.

These firestorms have previously been considered a major contender in the puzzle to find out what caused the mass extinction of life on Earth 65 million years ago.

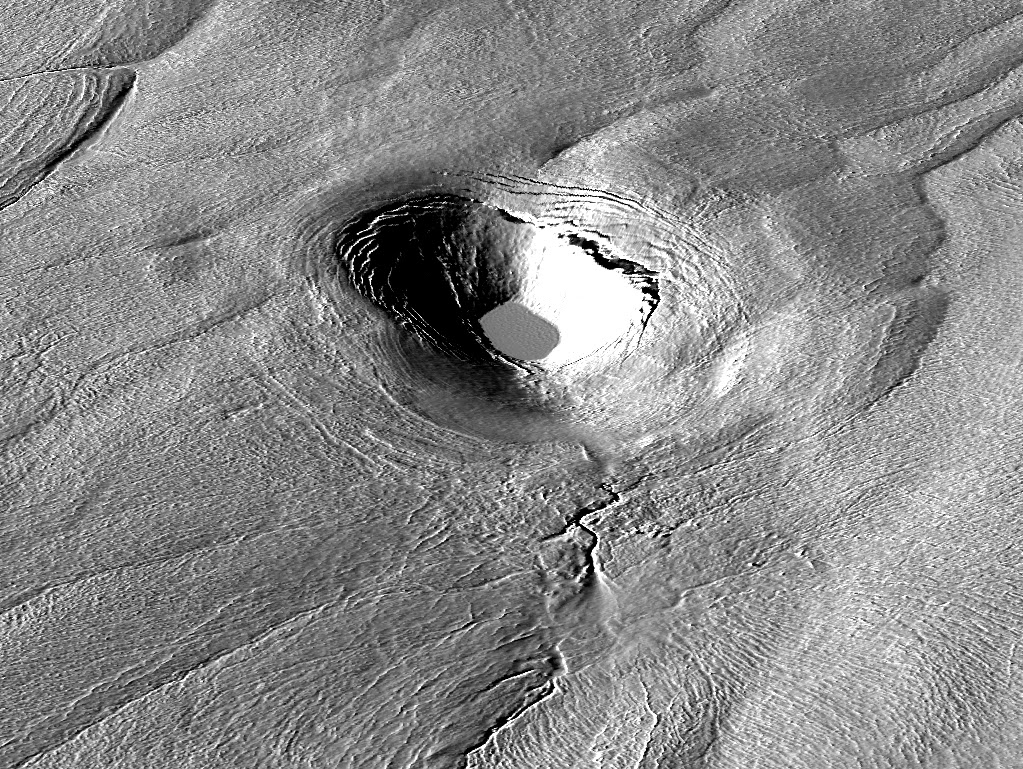
The researchers found that close to the impact site, a 200 km wide crater in Mexico, the heat pulse — that would have lasted for less than a minute — was too short to ignite live plant material. However they discovered that the effects of the impact would have been felt as far away as New Zealand where the heat would have been less intense but longer lasting — heating the ground for about seven minutes — long enough to ignite live plant matter.

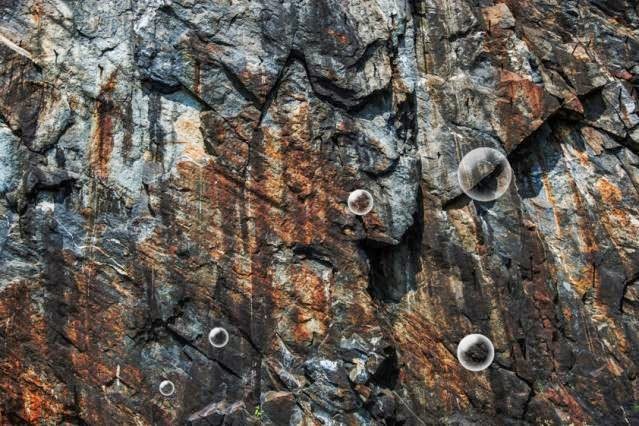
The experiments were carried out in the laboratory and showed that dry plant matter could ignite, but live plants including green pine branches, typically do not.

Dr Claire Belcher from the Earth System Science group in Geography at the University of Exeter said: “By combining computer simulations of the impact with methods from engineering we have been able to recreate the enormous heat of the impact in the laboratory. This has shown us that the heat was more likely to severely affect ecosystems a long distance away, such that forests in New Zealand would have had more chance of suffering major wildfires than forests in North America that were close to the impact. This flips our understanding of the effects of the impact on its head and means that palaeontologists may need to look for new clues from fossils found a long way from the impact to better understand the mass extinction event.”

Plants and animals are generally resistant to localised fire events — animals can hide or hibernate and plants can re-colonise from other areas, implying that wildfires are unlikely to be directly capable of leading to the extinctions. If however some animal communities, particularly large animals, were unable to shelter from the heat, they may have suffered serious losses. It is unclear whether these would have been sufficient to lead to the extinction of species.

Dr Rory Hadden from the University of Edinburgh said: “This is a truly exciting piece of inter-disciplinary research. By working together engineers and geoscientists have tackled a complex, long-standing problem in a novel way. This has allowed a step forward in the debate surrounding the end Cretaceous impact and will help Geoscientists interpret the fossil record and evaluate potential future impacts. In addition, the methods we developed in the laboratory for this research have driven new developments in our current understanding of how materials behave in fires particularly at the wildland-urban-interface, meaning that we have been able to answer questions relating to both ancient mass extinctions at the same time as developing understanding of the impact of wildfires in urban areas today.”

The results of the study are published in the Journal of the Geological Society.

The research was supported by a European Research Council Starter Grant, a Marie Curie Career Integration Grant, the Leverhulme Trust, the EPSRC and the Austrian Science Fund.

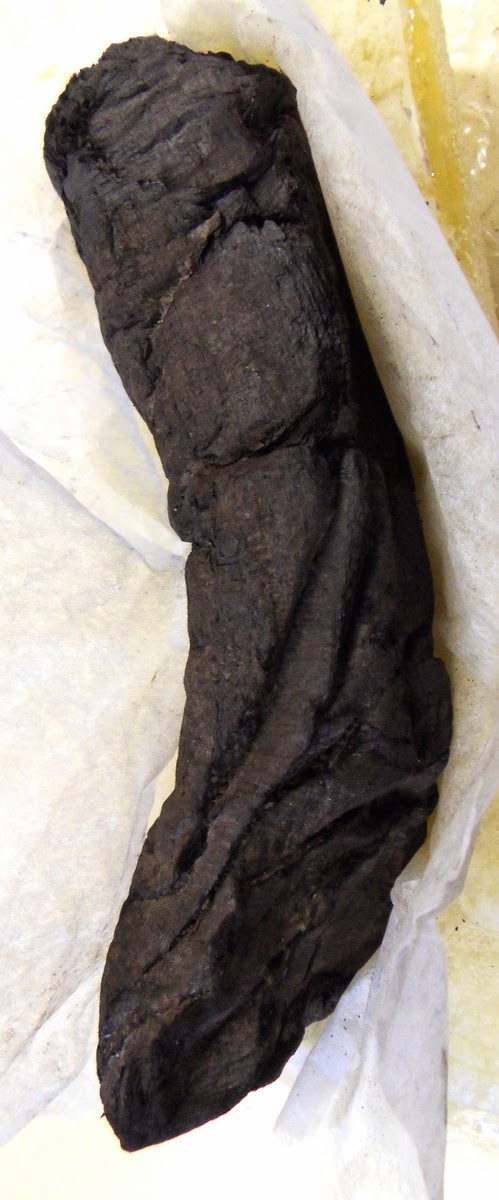
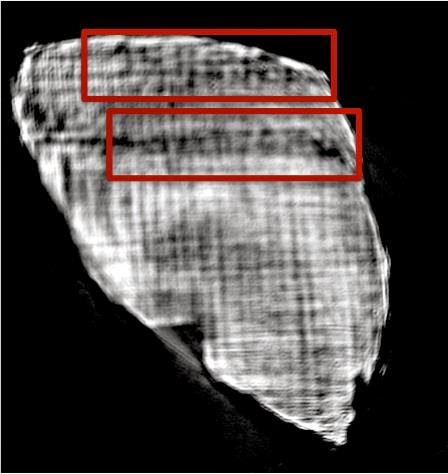
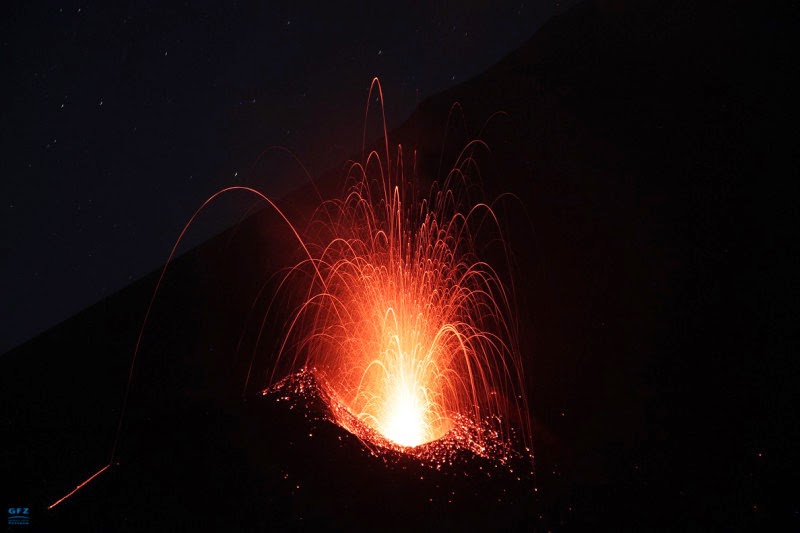
Flaming ignition of dry plant material.

Reference:
Claire M. Belcher, Rory M. Hadden, Guillermo Rein, Joanna V. Morgan, Natalia Artemieva, and Tamara Goldin. An experimental assessment of the ignition of forest fuels by the thermal pulse generated by the Cretaceous–Palaeogene impact at Chicxulub. Journal of the Geological Society, January 22, 2015 DOI: 10.1144/jgs2014-082

Note : The above story is based on materials provided by University of Exeter.

Going with the flow

Sites where flow frequency and channel capacity effects reinforce and offset one another are indicated by filled and open circles, respectively. Red represents net increases and blue net decreases in flood hazard frequency. Credit : UCSB

Millions of Americans live in flood-prone areas. In 2012 alone, the cost of direct flood damage hit nearly half a billion dollars. However, because the factors contributing to flood risk are not fully understood, river basin management — and even the calculation of flood insurance premiums — may be misguided.

A new study by UC Santa Barbara’s Michael Singer and colleagues presents a paradigm shift in flood hazard analysis that could change the way such risk is assessed in the future. The results are published in the journal Geophysical Research Letters.

Existing analyses attribute flood hazard to how often high water flows occur. They don’t, however, take into account the ability of river channels to accommodate them. The researchers present a novel method that compares the effects of channel capacity and stream flow on flood hazard frequency. They also document how flood hazard has changed over time in more than 400 streams across the United States.

“Our results demonstrate that changes in river channel boundaries directly impact flood hazard trends across the U.S.,” said Singer, an associate researcher at UCSB’s Earth Research Institute. “We show that in order to accurately calculate flood hazard and insurance premiums for river basins, channel capacity needs to be considered jointly with stream flow.”

Lead author Louise Slater, a Ph.D. student at the University of St. Andrews in Scotland, gathered recently digitized U.S. Geological Survey (USGS) data. Using sophisticated filtering processes, she whittled down the original dataset of 11,000 stations to 401 that were well distributed across the country and developed a procedure for separating the effects of hydrology and geomorphology on flood hazard. On average, the study data spanned about 40 to 60 years for each location.

In order to find relative magnitudes of two data components — water quantity as well as channel size and condition — the researchers separated these factors and then investigated how they might interact with each other. Water quantity is also known as the flow frequency effect; channel size and conditions (morphology) is referred to as the channel capacity.

“If there’s more water coming from the watershed but the channel gets enlarged somehow, that would offset the increased water flow,” Singer explained. “These two factors potentially interacting could have no change or they could increase the amount of change in one direction or another.”

The findings revealed that important trends in channel morphology through time were three times more common than those related to water quantity, indicating that changes in the channel’s geometry tend to offset increases in water flow. “That raised alarm bells,” Singer said. “It suggests that a lot of areas that we might not have considered to have trends in flood risk actually do.”

For example, in the Pacific Northwest the increase in flood hazard is associated with the channel capacity effect because channels are filling in with sediment or vegetation that impede the flow of water. “The channel morphology has a big impact on flood hazard, making this an area where flood hazard has been underestimated,” Singer noted.

“The opposite is happening in the Mississippi River Valley,” he added. “This is an area where people might overestimate the impact of increased stream flow because the channels are adjusting to accommodate an accelerated hydrologic cycle.”

The study demonstrates that 10-year trends in channel capacity significantly impact long-term flooding frequency and that flood hazard is changing substantially at the majority of the sites studied. “Based on our analysis, we argue that in order to develop appropriate management strategies or to set flood insurance premiums for any location, you need to consider both the flow frequency and channel capacity effects of flood hazard,” Singer concluded.

Note : The above story is based on materials provided by University of California.

Two lakes beneath the ice in Greenland, gone within weeks

In April 2014, researchers flew over a site in southwest Greenland to find that a sub-glacial lake had drained away. This photo shows the crater left behind, as well as a deep crack in the ice. Credit: Photo by Stephen Price, Los Alamos National Laboratory, courtesy of The Ohio State University.

Researchers who are building the highest-resolution map of the Greenland Ice Sheet to date have made a surprising discovery: two lakes of meltwater that pooled beneath the ice and rapidly drained away.

One lake once held billions of gallons of water and emptied to form a mile-wide crater in just a few weeks. The other lake has filled and emptied twice in the last two years.

Researchers at The Ohio State University published findings on each lake separately: the first in the open-access journal The Cryosphere and the second in the journal Nature.

Ian Howat, associate professor of earth sciences at Ohio State, leads the team that discovered the cratered lake described in The Cryosphere. To him, the find adds to a growing body of evidence that meltwater has started overflowing the ice sheet’s natural plumbing system and is causing “blowouts” that simply drain lakes away.

“The fact that our lake appears to have been stable for at least several decades, and then drained in a matter of weeks — or less — after a few very hot summers, may signal a fundamental change happening in the ice sheet,” Howat said.

The two-mile-wide lake described in Nature was discovered by a team led by researcher Michael Willis of Cornell University. Michael Bevis, Ohio Eminent Scholar in Geodynamics and professor of earth sciences at Ohio State, is a co-author of the Nature paper, and he said that the repeated filling of that lake is worrisome.

Researchers at The Ohio State University were creating the highest-resolution maps of the Greenland Ice Sheet made to date, when they discovered a crater, shown here, which had once been the site of a sub-glacial lake. Image made by Ian Howat, using a Worldview image copyright DigitalGlobe Inc

Each time the lake fills, the meltwater carries stored heat, called latent heat, along with it, reducing the stiffness of the surrounding ice and making it more likely to flow out to sea, he said.

Bevis explained the long-term implications.

“If enough water is pouring down into the Greenland Ice Sheet for us to see the same sub-glacial lake empty and re-fill itself over and over, then there must be so much latent heat being released under the ice that we’d have to expect it to change the large-scale behavior of the ice sheet,” he said.

Howat’s team was first to detect the cratered lake described in The Cryosphere, on a spot about 50 kilometers (31 miles) inland from the southwest Greenland coast earlier in 2014. There, previous aerial and satellite imagery indicates that a sub-glacial lake pooled for more than 40 years. More recent images suggest that the lake likely emptied through a meltwater tunnel beneath the ice sheet some time in 2011.

The crater measures 2 kilometers (1.2 miles) across and around 70 meters (230 feet) deep. Researchers calculated that the lake that formed it likely contained some 6.7 billion gallons of water.

That’s not a large lake by most reckoning, but it’s roughly the same size as the combined reservoirs that supply water to the Columbus, Ohio metropolitan area’s 1.9 million residents. And it disappeared in a single season — remarkably quickly by geologic standards. Howat characterized the sudden drainage as “catastrophic.”

Researchers suspect that, as more meltwater reaches the base of the ice sheet, natural drainage tunnels along the Greenland coast are cutting further inland, Howat explained. The tunnels carry heat and water to areas that were once frozen to the bedrock, potentially causing the ice to melt faster.

“Some independent work says that the drainage system has recently expanded to about 50 kilometers inland of the ice edge, which is exactly where this lake is,” he added.

It’s possible that the lake was tapped by one of the invading tunnels. It’s also possible that thousands of such lakes dot the Greenland coast. They are hard to detect with radar, and researchers don’t know enough about why and how they form. In contrast to Antarctica, researchers know much less about what’s happening under the ice in Greenland.

“Until we get a good map of the bed topography where this lake was, we have no idea whatsoever how many lakes could be out there,” Howat said. “There may be something really weird in the bed in this particular spot that caused water to accumulate. But, if all you need is a bumpy surface a bit inland from the coast, then there could be thousands of little lakes.”

Howat and his team flew over the site in southwest Greenland in April 2014, after they realized that detection of the crater, nestled in the midst of a flat ice expanse, was not just an error in the high-resolution surface data they’ve been collecting. Using DigitalGlobe Inc.’s Worldview satellites, they’re assembling a Greenland ice map with 2-meter (approximately 6.5-feet) resolution.

Bevis and his colleagues discovered the lake described in Nature under similar circumstances in March 2013. They were gathering data to supplement their long-standing efforts to weigh the Greenland Ice Sheet with GPS and spotted the mitten-shaped lake by accident.

Using data from Worldview and NASA’s Operation IceBridge, the Cornell-led team calculated that the lake filled and emptied twice since 2012, at one point experiencing a sub-surface blowout that drove water from the lake at a volume of 215 cubic meters (nearly 57,000 gallons — close to the volume of a 30-foot-by-50-foot backyard swimming pool) every second.

Though researchers have long known of the existence of sub-glacial lakes, never before have they witnessed any draining away. The sudden discovery of two — one of which seems to be refilling and draining repeatedly — signals to Bevis that Greenland ice loss has likely reached a milestone.

“It’s pretty telling that these two lakes were discovered back to back,” he said. “We can actually see the meltwater pour down into these holes. We can actually watch these lakes drain out and fill up again in real time. With melting like that, even the deep interior of the ice sheet is going to change.”

Coauthors on the paper in The Cryosphere include Myoung-Jong Noh, a postdoctoral researcher, and Seongsu Jeong, a doctoral student, both of earth sciences at Ohio State; Claire Porter of the Polar Geospatial Center at the University of Minnesota; and Ben Smith of the Polar Science Center of the University of Washington.

Coauthors on the paper in Nature include Bradley Herried of the University of Minnesota and Robin Bell of Columbia University. Willis holds a joint appointment at the University of North Carolina, Chapel Hill.

These projects were funded by NASA and the National Science Foundation.

References:
Michael J. Willis, Bradley G. Herried, Michael G. Bevis, Robin E. Bell. Recharge of a subglacial lake by surface meltwater in northeast Greenland. Nature, 2015; DOI: 10.1038/nature14116

I. M. Howat, C. Porter, M. J. Noh, B. E. Smith, S. Jeong. Brief Communication: Sudden drainage of a subglacial lake beneath the Greenland Ice Sheet. The Cryosphere, 2015; 9 (1): 103 DOI: 10.5194/tc-9-103-2015

Note : The above story is based on materials provided by Ohio State University. The original article was written by Pam Frost Gorder.

Death of a dynamo: A hard drive from space

Hidden magnetic messages contained within ancient meteorites are providing a unique window into the processes that shaped our solar system, and may give a sneak preview of the fate of the Earth’s core as it continues to freeze.

The dying moments of an asteroid’s magnetic field have been successfully captured by researchers, in a study that offers a tantalising glimpse of what may happen to the Earth’s magnetic core billions of years from now.

Using a detailed imaging technique, the research team were able to read the magnetic memory contained in ancient meteorites, formed in the early solar system over 4.5 billion years ago. The readings taken from these tiny ‘space magnets’ may give a sneak preview of the fate of the Earth’s magnetic core as it continues to freeze. The findings are published today (22 January) in the journal Nature.

Using an intense beam of x-rays to image the nanoscale magnetisation of the meteoritic metal, researchers led by the University of Cambridge were able to capture the precise moment when the core of the meteorite’s parent asteroid froze, killing its magnetic field. These ‘nano-paleomagnetic’ measurements, the highest-resolution paleomagnetic measurements ever made, were performed at the BESSY II synchrotron in Berlin.

The researchers found that the magnetic fields generated by asteroids were much longer-lived than previously thought, lasting for as long as several hundred million years after the asteroid formed, and were created by a similar mechanism to the one that generates the Earth’s own magnetic field. The results help to answer many of the questions surrounding the longevity and stability of magnetic activity on small bodies, such as asteroids and moons.

“Observing magnetic fields is one of the few ways we can peek inside a planet,” said Dr Richard Harrison of Cambridge’s Department of Earth Sciences, who led the research. “It’s long been assumed that metal-rich meteorites have poor magnetic memories, since they are primarily composed of iron, which has a terrible memory — you wouldn’t ever make a hard drive out of iron, for instance. It was thought that the magnetic signals carried by metal-rich meteorites would have been written and rewritten many times during their lifetime, so no-one has ever bothered to study their magnetic properties in any detail.”

The particular meteorites used for this study are known as pallasites, which are primarily composed of iron and nickel, studded with gem-quality silicate crystals. Contained within these unassuming chunks of iron however, are tiny particles just 100 nanometres across — about one thousandth the width of a human hair — of a unique magnetic mineral called tetrataenite, which is magnetically much more stable than the rest of the meteorite, and holds within it a magnetic memory going back billions of years.

“We’re taking ancient magnetic field measurements in nanoscale materials to the highest ever resolution in order to piece together the magnetic history of asteroids — it’s like a cosmic archaeological mission,” said PhD student James Bryson, the paper’s lead author.

The researchers’ magnetic measurements, supported by computer simulations, demonstrate that the magnetic fields of these asteroids were created by compositional, rather than thermal, convection — meaning that the field was long-lasting, intense and widespread. The results change our perspective on the way magnetic fields were generated during the early life of the solar system.

These meteorites came from asteroids formed in the first few million years after the formation of the Solar System. At that time, planetary bodies were heated by radioactive decay to temperatures hot enough to cause them to melt and segregate into a liquid metal core surrounded by a rocky mantle. As their cores cooled and began to freeze, the swirling motions of liquid metal, driven by the expulsion of sulphur from the growing inner core, generated a magnetic field, just as the Earth does today.

“It’s funny that we study other bodies in order to learn more about the Earth,” said Bryson. “Since asteroids are much smaller than the Earth, they cooled much more quickly, so these processes occur on shorter timescales, enabling us to study the whole process of core solidification.”

Scientists now think that the Earth’s core only began to freeze relatively recently in geological terms, maybe less than a billion years ago. How this freezing has affected the Earth’s magnetic field is not known. “In our meteorites we’ve been able to capture both the beginning and the end of core freezing, which will help us understand how these processes affected the Earth in the past and provide a possible glimpse of what might happen in the future,” said Harrison.

However, the Earth’s core is freezing rather slowly. The solid inner core is getting bigger, and eventually the liquid outer core will disappear, killing the Earth’s magnetic field, which protects us from the Sun’s radiation. “There’s no need to panic just yet, however,” said Harrison. “The core won’t completely freeze for billions of years, and chances are, the Sun will get us first.”

The research was funded by the European Research Council (ERC) and the Natural Environment Research Council (NERC).

Reference:
James F. J. Bryson, Claire I. O. Nichols, Julia Herrero-Albillos, Florian Kronast, Takeshi Kasama, Hossein Alimadadi, Gerrit van der Laan, Francis Nimmo, Richard J. Harrison. Long-lived magnetism from solidification-driven convection on the pallasite parent body. Nature, 2015; 517 (7535): 472 DOI: 10.1038/nature14114

Note : The above story is based on materials provided by University of Cambridge.

Sequestration on shaky ground

A new study finds a natural impediment to the long-term sequestration of carbon dioxide. Credit: Christine Daniloff/MIT

Carbon sequestration promises to address greenhouse-gas emissions by capturing carbon dioxide from the atmosphere and injecting it deep below the Earth’s surface, where it would permanently solidify into rock. The U.S. Environmental Protection Agency estimates that current carbon-sequestration technologies may eliminate up to 90 percent of carbon dioxide emissions from coal-fired power plants.

While such technologies may successfully remove greenhouse gases from the atmosphere, researchers in the Department of Earth, Atmospheric and Planetary Sciences at MIT have found that once injected into the ground, less carbon dioxide is converted to rock than previously imagined.

The team studied the chemical reactions between carbon dioxide and its surroundings once the gas is injected into the Earth — finding that as carbon dioxide works its way underground, only a small fraction of the gas turns to rock. The remainder of the gas stays in a more tenuous form.

“If it turns into rock, it’s stable and will remain there permanently,” says postdoc Yossi Cohen. “However, if it stays in its gaseous or liquid phase, it remains mobile and it can possibly return back to the atmosphere.”

Cohen and Daniel Rothman, a professor of geophysics in MIT’s Department of Earth, Atmospheric, and Planetary Sciences, detail the results this week in the journal Proceedings of the Royal Society A.

Current geologic carbon-sequestration techniques aim to inject carbon dioxide into the subsurface some 7,000 feet below the Earth’s surface, a depth equivalent to more than five Empire State Buildings stacked end-to-end. At such depths, carbon dioxide may be stored in deep-saline aquifers: large pockets of brine that can chemically react with carbon dioxide to solidify the gas.

Cohen and Rothman sought to model the chemical reactions that take place after carbon dioxide is injected into a briny, rocky environment. When carbon dioxide is pumped into the ground, it rushes into open pockets within rock, displacing any existing fluid, such as brine. What remains are bubbles of carbon dioxide, along with carbon dioxide dissolved in water. The dissolved carbon dioxide takes the form of bicarbonate and carbonic acid, which create an acidic environment. To precipitate, or solidify into rock, carbon dioxide requires a basic environment, such as brine.

The researchers modeled the chemical reactions between two main regions: an acidic, low-pH region with a high concentration of carbon dioxide, and a higher-pH region filled with brine, or salty water. As each carbonate species reacts differently when diffusing or flowing through water, the researchers characterized each reaction, then worked each reaction into a reactive diffusion model — a simulation of chemical reactions as carbon dioxide flows through a briny, rocky environment.

When the team analyzed the chemical reactions between regions rich in carbon dioxide and regions of brine, they found that the carbon dioxide solidifies — but only at the interface. The reaction essentially creates a solid wall at the point where carbon dioxide meets brine, keeping the bulk of the carbon dioxide from reacting with the brine.

“This can basically close the channel, and no more material can move farther into the brine, because as soon as it touches the brine, it will become solid,” Cohen says. “The expectation was that most of the carbon dioxide would become solid mineral. Our work suggests that significantly less will precipitate.”

Cohen and Rothman point out that their theoretical predictions require experimental study to determine the magnitude of this effect.

“Experiments would help determine the kind of rock that would minimize this clogging phenomenon,” Cohen says. “There are many factors, such as the porosity and connectivity between pores in rocks, that will determine if and when carbon dioxide mineralizes. Our study reveals new features of this problem that may help identify the optimal geologic formations for long-term sequestration”

Note : The above story is based on materials provided by Massachusetts Institute of Technology. The original article was written by Jennifer Chu.

UNL drillers help make new Antarctic discoveries

WISSARD drillers set in place an ultraviolet light collar, used for purification, at the borehole site near the Whillans Ice Stream grounding zone in Antarctica. Credit: Frank Rack, UNL Science Management Office

Using a hot-water drill and an underwater robotic vehicle designed, built and operated by a University of Nebraska-Lincoln engineering team, scientists have made new discoveries about Antarctica’s geology and biology.

In addition to new observations about how Antarctica’s ice sheets are affected by rising temperatures, the expedition also uncovered a unique ecosystem of fish and invertebrates living in an estuary deep beneath the Antarctic ice.

“UNL team members once again demonstrated their engineering and operational expertise by providing clean access to a challenging, unexplored sub-ice environment,” said Frank Rack, executive director of the ANDRILL (Antarctic Drilling Project) Science Management Office and UNL’s principal investigator for the project.

The latest discoveries come in the final year of the Whillans Ice Stream Subglacial Access Research Drilling (WISSARD) project. The project was delayed last year because of the U.S. federal government shutdown in October 2013, the start of Antarctica’s summer field research season. After they leave Antarctica at the end of January, most of the drillers will be laid off until a new research project and additional funding are identified.

Earlier this month, a National Science Foundation-funded team of researchers bored through nearly 740 meters of ice at a point where the Whillans Ice Stream oozes off the coastline of West Antarctica to feed into the Ross Ice Shelf, a slab of glacial ice the size of Texas that floats on the Ross Sea.

It was scientists’ first look at what’s known as the grounding zone, where the ice shelf meets the sea floor.

“This season we accessed another critical polar environment, which has never been directly sampled by scientists before: the grounding zone of the Antarctic ice sheet,” said Slawek Tulaczyk, a glaciologist from the University of California, Santa Cruz, and a chief scientist on the project.

Working around the clock, more than 40 scientists, technicians and camp staff from the WISSARD project gathered as many samples and as much data as they could while the borehole remained open.

On Jan. 16, eight days after piercing the ice, the UNL team deployed “Deep SCINI,” a remotely operated vehicle or ROV, to explore the marine cavity around the borehole.

The camera-equipped vehicle detected a variety of fish and invertebrates in an ecosystem that may provide new insights into how creatures survive and thrive in a brutally cold and dark environment.

It was the first deployment of Deep SCINI, a prototype ROV developed at UNL for combined ice and water depths of greater than 1,000 meters. It was built by Bob Zook, an ROV engineer recruited by UNL, and Justin Burnett, a UNL graduate student in mechanical engineering. UNL received grant funding from the NSF and NASA to develop Deep SCINI and other technology used in the expedition.

Other members of UNL’s team are: Dennis Duling, lead driller; Daren Blythe, Dar Gibson, Jeff Lemery, Graham Roberts and James Roth.

“This is the first time that Deep-SCINI ROV has been used in the field and it passed this test with flying colors,” Rack said, “collecting video of fish living under the ice shelf in this extremely hostile environment far from the front of the ice shelf.”

In previous expeditions, the UNL team drilled through the Ross Ice Shelf in 2010, discovering a previously unknown species of sea anemone that lives in the ice; and as part of the WISSARD project in 2012-13, used the hot water drill system to cleanly access a subglacial lake located about 60 miles inland from the grounding zone.

Rack and eight drillers were flown to the grounding zone site by ski-equipped LC-130 aircraft on Dec. 28. They needed time to get the drill ready for operation after it had been stored for two Antarctic winters on snow berms near Subglacial Lake Whillans, site of the 2012-13 project. A traverse team of tractors and drivers had moved the drill containers to the grounding zone and began setting up camp before the UNL team’s arrival. Among other things, the UNL drillers needed to reinstall and test sensors and network components that had been stored at McMurdo Station so they would not freeze.

Rack said the drill system works like an industrial-scale water-treatment plant on skis, which pumps filtered hot water at moderately high pressures of 500 to 800 pounds per square inch through a hose that is equipped with a weighted drill head and nozzle. It took about three days to drill through the ice, with the hose advancing slowly downward as the nozzle and drill head melted the ice.

Preliminary findings offer interesting clues about how climate change might affect Antarctic ice, according to a recent report on the expedition published by Scientific American. Ross Powell, a glaciologist from Northern Illinois University and WISSARD chief scientist, pointed to a layer of pebbles strewn on the bottom of the seawater cavity. They appear to have dropped from the ice as it melted and indicate a fairly recent change in the environment. They might help measure how fast the ice is melting and the stability of the ice shelf. A weakening or collapse of the Ross Ice Shelf would allow glaciers to flow more rapidly into the ocean, raising global sea level.

Reference:
Three papers describing the WISSARD hot water drill system were published in the journal Annals of Glaciology in December (www.igsoc.org/annals/55/68/published.html). More information about the WISSARD project can be found at www.wissard.org.

Note : The above story is based on materials provided by University of Nebraska-Lincoln.

Ash Spews From Mexico Volcano

The Colima volcano in Western Mexico spewed a column of ash thousands of metres into the air on Monday.

Video provided by AP


Paleontologist names a carnivorous reptile that preceded dinosaurs

Here is a representation of paleontologist Sterling Nesbitt’s latest addition to the paleontological vernacular: Nundasuchus, a 9-foot-long carnivorous reptile with steak knife-like teeth and bony plates on the back. Credit: Virginia Tech

Finding a new species of dinosaur is pretty rare. Getting a hand in the discovery and naming of one — that’s rarer still.

Or it would be for anyone other than 32-year-old Sterling Nesbitt, an assistant professor of geological sciences in the College of Science and the newest addition to Virginia Tech’s paleontology team.

Nesbitt has been responsible for naming more than half a dozen reptiles (including dinosaurs) in his young career.

His latest addition to the paleontological vernacular is Nundasuchus, (noon-dah-suh-kis) a 9-foot-long carnivorous reptile with steak knifelike teeth, bony plates on the back, and legs that lie under the body.

Nundasuchus is not a dinosaur, but one of the large reptiles that lived before dinosaurs took over the world.

“The full name is actually Nundasuchus songeaensis,” Nesbitt explained. “It’s Swahili mixed with Greek.”

The basic meaning of Nundasuchus, is “predator crocodile,” “Nunda” meaning predator in Swahili, and “suchus” a reference to a crocodile in Greek.

“The ‘songeaensis’ comes from the town, Songea, near where we found the bones,” Nesbitt said. “The reptile itself was heavy-bodied with limbs under its body like a dinosaur, or bird, but with bony plates on its back like a crocodilian.”

The new, albeit ancient, reptile, is featured online in the Journal of Vertebrate Paleontology.

“We discovered the partial skeleton in 2007 when I was a graduate student, but it took some years to piece the bones together as they were in thousands of pieces,” Nesbitt said.

Although a large number of skeleton bones were found, most of the skull was not recovered despite three trips to the site and more than 1,000 hours spent painstakingly piecing the bones back together and cleaning them.

Nundasuchus was found in southwestern Tanzania, while Nesbitt and a team of researchers were looking for prehistoric relatives of birds and crocodiles, but not really expecting to find something entirely new.

“There’s such a huge gap in our understanding around the time when the the common ancestor of birds and crocodilians was alive — there isn’t a lot out there in the fossil record from that part of the reptile family tree,” Nesbitt said. “This helps us fill in some gaps in reptile family tree, but we’re still studying it and figuring out the implications.”

The find itself was a bit of a “eureka moment” for the team. Nesbitt said he realized very quickly what he had found.

“Sometimes you know instantly if it’s new and within about 30 seconds of picking up this bone I knew it was a new species,” he said. “I had hoped to find a leg bone to identify it, and I thought, This is exactly why we’re here’ and I looked down and there were bones everywhere. It turns out I was standing on bones that had been weathering out of the rock for hundreds of years — and it was all one individual of a new species.”

Nesbitt says he has been very lucky to put himself in the right position for finding bones, but it also takes a lot of work doing research on what has been found in various locations through previous research; what type of animals were known to inhabit certain areas; and research into the geological maps of areas to determine the most likely places to find fossils.

Nesbitt has been involved in naming 17 different reptiles, dinosaurs, and dinosaur relatives in the last 10 years, including seven of which he discovered.

Reference:
Sterling J. Nesbitt, Christian A. Sidor, Kenneth D. Angielczyk, Roger M. H. Smith, Linda A. Tsuji. A new archosaur from the Manda beds (Anisian, Middle Triassic) of southern Tanzania and its implications for character state optimizations at Archosauria and Pseudosuchia. Journal of Vertebrate Paleontology, 2014; 34 (6): 1357 DOI: 10.1080/02724634.2014.859622

Note : The above story is based on materials provided by Virginia Tech.

Scientists drilling first deep ice core at the South Pole

Existing deep ice cores are shown by black dots. The South Pole core (red dot) will fill in the picture of Antarctic climate. The UW researchers were also part of a recent project to drill an ice core at the West Antarctic Ice Sheet divide (WD).

This winter, when many people’s imaginations were fixed on the North Pole, a small group of scientists has been working on the other side of the planet. In round-the-clock daylight and frigid temperatures, glaciologists have been drilling an ice core at the South Pole.

Drilling continues through the end of January for the first of two years of a joint project by the University of Washington and the University of California, Irvine. The National Science Foundation is funding the South Pole Ice Core Project to dig into climate history at the planet’s southernmost tip.

The 40,000-year record will be the first deep core from this region of Antarctica, and the first record longer than 3,000 years collected south of 82 degrees latitude.

“The cold temperatures in the ice, about -50 C, have caused some surprises with drilling since certain aspects of the drill perform differently even than during the test in Greenland at -30 C,” said T.J. Fudge, a UW postdoctoral researcher who is chief scientist for this month.

The location is just 2.7 km (1.7 miles) from the South Pole. Its thick, uncontaminated layers of ice will help answer questions about how Antarctic climate interacts with the rest of the world.

UW’s T.J. Fudge packages a freshly drilled section of ice core Jan. 2 at the South Pole research station. Murat Aydin

“South Pole is part of the East Antarctic Ice Sheet, yet is influenced by storms coming across the West Antarctic Ice Sheet,” Fudge said. “This core will help us figure out how the two sides of Antarctica communicate during climate changes in the past.”

The period between 40,000 years ago and 20,000 years ago includes sudden swings in temperature, and warming at the end of the last ice age.

Scientists were also attracted by cold conditions, even by polar standards.

“Most of the other places where we’ve worked the ice is -25 C to -30 C, and that’s too warm for rare organic molecules and other trace gases that people are interested in measuring,” said co-leader Eric Steig, a UW professor of Earth and space sciences.

“This is basically the coldest ice that we have drilled in,” said principal investigator Murat Aydin, a UC Irvine researcher who was chief scientist from setup of the field camp in early November through the end of December. “Everything is harder in the cold.”

All three scientists were part of a team that collected a more than 2-mile ice core from West Antarctica, a five-year effort that ended in 2011. Analysis of that ice is still ongoing at the UW, UC Irvine and many other labs around the country.

The new project at the South Pole is using a new intermediate-depth drill based on a Danish design, and a new drilling fluid. The team reached a depth of 1/2 kilometer (1/3 mile) on Jan. 14. Researchers hope to pass 700 meters by the end of this season and 1,500 meters (almost a mile down) by the end of next season.

“We’re not just trying to punch through the ice sheet, the most important objective is to bring up the highest-quality ice possible,” Aydin said.

After the core is drilled, three-foot sections will be flown to McMurdo Station and transferred to a ship. Scientists will then converge on Denver’s National Ice Core Laboratory this summer to process the samples and ship pieces to labs across the country.

In the UW’s IsoLab, Steig will analyze different types of oxygen molecules in the ice to determine the temperature. This will provide a record of climate changes for that region and help to evaluate the large-scale climate patterns across the Southern Hemisphere.

“The South Pole is one of the very few places in Antarctica that has not warmed up in the past 50 years,” Steig said. “That’s interesting, and needs to be better understood.”

The UC Irvine group will look at ultra-trace gases from air bubbles trapped in the ice. Aydin is interested in gases that are one in a billion to one in a trillion molecules in the atmosphere, but provide clues about the productivity of land-based plants and the extent of tropical wetlands during previous eras.

So far, looking at the core shows one layer of ash that the researchers think is tied to a volcanic eruption in the South Sandwich Islands.

“Otherwise, the core has been beautifully clear,” Fudge said.

Scientists work inside a field tent at about -20 C, the same temperature as the national ice core lab. Extra-curricular highlights of this year’s season included the Christmas Day round-the-world running race, and participating in the New Year’s annual marking of the South Pole.

Hear Fudge describe his work on a previous ice core:

Note : The above story is based on materials provided by University of Washington.

X-rays unlock secrets of ancient scrolls buried by volcano

Photograph of Herculaneum Papyrus scroll “PHerc.Paris.4” Length : 16cm Credit: D. Delattre © Bibliothèque de l’Institut de France

Scientists have succeeded in reading parts of an ancient scroll that was buried in a volcanic eruption almost 2,000 years ago, holding out the promise that the world’s oldest surviving library may one day reveal all of its secrets.

The scroll is among hundreds retrieved from the remains of a lavish villa at Herculaneum, which along with Pompeii was one of several Roman towns that were destroyed when Mt. Vesuvius erupted in A.D. 79.

Some of the texts from what is called the Villa of the Papyri have been deciphered since they were discovered in the 1750s. But many more remain a mystery to science because they were so badly damaged that unrolling the papyrus they were written on would have destroyed them completely.

“The papyri were completely covered in blazing-hot volcanic material,” said Vito Mocella, a theoretical scientist at the Institute of Microelectronics and Microsystems (CNR) in Naples who led the latest project.

Two words in a hidden layer of the fragment. In the top the sequence of Greek capital letters spells PIPTOIE (pi-iota-pi-tau- omicron-iota-epsilon); in the bottom the letter sequence of the next line, EIPOI (epsilon-iota-pi-omicron-iota) Credit: Mocella et al. Nature Communications

Previous attempts to peer inside the scrolls failed to yield any readable texts because the ink used in ancient times was made from a mixture of charcoal and gum. This makes it indistinguishable from the burned papyrus.

Mocella and his colleagues decided to try a method called X-ray phase contrast tomography that had previously been used to examine fossils without damaging them.

Phase contrast tomography takes advantage of subtle differences in the way radiation—such as X-rays—passes through different substances, in this case papyrus and ink.

Using lab time at the European Synchrotron Radiation Facility in Grenoble, France, the researchers found they were able to decipher several letters, proving that the method could be used to read what’s hidden inside the scrolls.

“Our goal was to show that the technique is sensitive to the writing,” said Mocella. In a further step, the scientists compared the handwriting to that of other texts, allowing them to conclude that it was likely the work of Philodemus, a poet and Epicurean philosopher who died about a century before the volcanic eruption.

The next challenge will be to automate the laborious process of scanning the charred lumps of papyrus and deciphering the texts inside them, so that some 700 further scrolls stored in Naples can be read, Mocella said.

Scholars studying the Herculaneum texts say the new technique, which was detailed in an article published Tuesday in the journal Nature Communications, may well mark a breakthrough for their efforts to unlock the ancient philosophical ideas hidden from view for almost two millennia.

“It’s a philosophical library of Epicurean texts from a time when this philosophy influenced the most important classical Latin authors, such as Virgil, Horace and Cicero,” said Juergen Hammerstaedt, a professor of Greek and Latin at the University of Cologne, Germany, who was not involved in the project.

“There needs to be much work before one can virtually unroll carbonized papyrus because one will have to develop a digital method that will allow us to follow the layers,” he said. “But in the 260 years of Herculaneum papyrology it is certainly a remarkable year.”

Reference:
Nature Communications, http://nature.com/articles/DOI: 10.1038/ncomms6895

Note : The above story is based on materials provided by The Associated Press.

Ocean floor dust gives new insight into supernovae

Dr Anton Wallner in the Nuclear Physics Department at ANU. Credit: Stuart Hay, ANU

Scientists plumbing the depths of the ocean have made a surprise finding that could change the way we understand supernovae, exploding stars way beyond our solar system.

They have analysed extraterrestrial dust thought to be from supernovae, that has settled on ocean floors to determine the amount of heavy elements created by the massive explosions.

“Small amounts of debris from these distant explosions fall on the earth as it travels through the galaxy,” said lead researcher Dr Anton Wallner, from the Research School of Physics and Engineering.

“We’ve analysed galactic dust from the last 25 million years that has settled on the ocean and found there is much less of the heavy elements such as plutonium and uranium than we expected.”

The findings are at odds with current theories of supernovae, in which some of the materials essential for human life, such as iron, potassium and iodine are created and distributed throughout space.

Supernovae also create lead, silver and gold, and heavier radioactive elements such as uranium and plutonium.

Dr Wallner’s team studied plutonium-244 which serves as a radioactive clock by the nature of its radioactive decay, with a half-life of 81 million years.

“Any plutonium-244 that existed when the earth formed from intergalactic gas and dust over four billion years ago has long since decayed,” Dr Wallner said.

“So any plutonium-244 that we find on earth must have been created in explosive events that have occurred more recently, in the last few hundred million years.”

The team analysed a 10 centimetre-thick sample of the earth’s crust, representing 25 million years of accretion, as well as deep-sea sediments collected from a very stable area at the bottom of the Pacific Ocean.

“We found 100 times less plutonium-244 than we expected,” Dr Wallner said.

“It seems that these heaviest elements may not be formed in standard supernovae after all. It may require rarer and more explosive events such as the merging of two neutron stars to make them.”

The fact that these heavy elements like plutonium were present, and uranium and thorium are still present on earth suggests that such an explosive event must have happened close to the earth around the time it formed, said Dr Wallner.

“Radioactive elements in our planet such as uranium and thorium provide much of the heat that drives continental movement, perhaps other planets don’t have the same heat engine inside them,” he said.

The research is published in Nature Communications.

Reference:
A. Wallner, T. Faestermann, J. Feige, C. Feldstein, K. Knie, G. Korschinek, W. Kutschera, A. Ofan, M. Paul, F. Quinto, G. Rugel, P. Steier. Abundance of live 244Pu in deep-sea reservoirs on Earth points to rarity of actinide nucleosynthesis. Nature Communications, 2015; 6: 5956 DOI: 10.1038/ncomms6956

Note : The above story is based on materials provided by Australian National University.

Geophysicists find the crusty culprits behind sudden tectonic plate movements

Image via Shutterstock

Yale-led research may have solved one of the biggest mysteries in geology — namely, why do tectonic plates beneath the Earth’s surface, which normally shift over the course of tens to hundreds of millions of years, sometimes move abruptly?

A new study published Jan. 19 in the journal Proceedings of the National Academy of Sciences says the answer comes down to two things: thick crustal plugs and weakened mineral grains. Those effects, acting together, may explain a range of relatively speedy moves among tectonic plates around the world, from Hawaii to East Timor.

Of course, in this case “speedy” still means a million years or longer.

“Our planet is probably most distinctly marked by the fact that it has plate tectonics,” said Yale geophysicist David Bercovici, lead author of the research. “Our work here looks at the evolution of plate tectonics. How and why do plates change directions over time?”

Traditionally, scientists believed that all tectonic plates are pulled by subducting slabs — which result from the colder, top boundary layer of the Earth’s rocky surface becoming heavy and sinking slowly into the deeper mantle. Yet that process does not account for sudden plate shifts. Such abrupt movement requires that slabs detach from their plates, but doing this quickly is difficult since the slabs should be too cold and stiff to detach.

According to the Yale study, there are additional factors at work. Thick crust from continents or oceanic plateaux is swept into the subduction zone, plugging it up and prompting the slab to break off. The detachment process is then accelerated when mineral grains in the necking slab start to shrink, causing the slab to weaken rapidly.

The result is tectonic plates that abruptly shift horizontally, or continents suddenly bobbing up.

“Understanding this helps us understand how the tectonic plates change through the Earth’s history,” Bercovici said. “It adds to our knowledge of the evolution of our planet, including its climate and biosphere.”

The study’s co-authors are Gerald Schubert of the University of California-Los Angeles and Yanick Ricard of the Université de Lyon in France.

Note : The above story is based on materials provided by Yale University. The original article was written by Jim Shelton.

Preserved fossil represents oldest record of parental care in group of prehistoric reptiles

Parental care reconstruction. Credit: Chuang Zhao

New research details how a preserved fossil found in China could be the oldest record of post-natal parental care from the Middle Jurassic.

The specimen, found by a farmer in China, is of an apparent family group with an adult, surrounded by six juveniles of the same species. Given that the smaller individuals are of similar sizes, the group interpreted this as indicating an adult with its offspring, apparently from the same clutch.

A fossil specimen discovered by a farmer in China represents the oldest record of post-natal parental care, dating back to the Middle Jurassic.

The tendency for adults to care for their offspring beyond birth is a key feature of the reproductive biology of living archosaurs — birds and crocodilians — with the latter protecting their young from potential predators and birds, not only providing protection but also provision of food.

This behaviour seems to have evolved numerous times in vertebrates, with evidence of a long evolutionary history in diapsids — a group of amniotes which developed holes in each side of the skull about 300 million years ago and from which all existing lizards, snakes and birds are descended

However, unequivocal evidence of post-natal parental care is extremely rare in the fossil record and is only reported for two types of dinosaurs and varanopid ‘pelycosaurs’ — a reptile which resembled a monitor lizard.

A new study by the Institute of Geology, Chinese Academy of Geological Sciences, Beijing; the University of Lincoln, UK; and Hokkaido University, Japan, presents new evidence of post-natal parental care in Philydrosauras, a choristodere from the Yixian Formation of western Liaoning Province, China. Choristoderes are a group of relatively small aquatic and semi-aquatic diapsid reptiles which emerged in the Middle Jurassic Period more than 160 million years ago.

The team reviewed the fossil record of reproduction in this group using exceptionally preserved skeletons of the aquatic choristoderan Philydrosauras. The specimen was donated to the Jinzhou Paleontological Museum in Jinzhou City four years ago by a local farmer who discovered the skeleton.

The skeletons are of an apparent family group with an adult, surrounded by six juveniles of the same species. Given that the smaller individuals are of similar sizes, the group interpreted this as indicating an adult with its offspring, apparently from the same clutch.

Dr Charles Deeming, from the School of Life Sciences, University of Lincoln, UK, said: “That Philydrosauras shows parental care of the young after hatching suggests protection by the adult, presumably against predators. Their relatively small size would have meant that choristoderes were probably exposed to high predation pressure and strategies, such as live birth, and post-natal parental care may have improved survival of the offspring. This specimen represents the oldest record of post-natal parental care in diapsids to our knowledge and is the latest in an increasingly detailed collection of choristoderes exhibiting different levels of reproduction and parental care.”

A test of whether post-natal parental care is an ancestral behaviour that has persisted in the evolutionary development of amniotes will depend on future fossil discoveries.

The study is published in Geosciences Journal.

Reference:
Junchang Lü, Yoshitsugu Kobayashi, D. Charles Deeming, Yongqing Liu. Post-natal parental care in a Cretaceous diapsid from northeastern China. Geosciences Journal, 2014; DOI: 10.1007/s12303-014-0047-1

Note : The above story is based on materials provided by University of Lincoln.

Voyage from Earth’s crust to its mantle and back again

A numerical simulation shows how Earth's crust (blue) is subducted and transported into the mantle (orange). Credit: Graphics: ETH Zurich/ Geophysical Fluid Dynamics
A numerical simulation shows how Earth’s crust (blue) is subducted and transported into the mantle (orange). Credit: Graphics: ETH Zurich/ Geophysical Fluid Dynamics

From the beginning of time, uranium has been part of Earth and, thanks to its long-lived radioactivity, it has proven ideal to date geological processes and deduce Earth’s evolution. Natural uranium consists of two long-lived isotopes uranium-238 and the lighter uranium-235. A new study of the global cycle of these uranium isotopes brings additional perspectives to the debate on how Earth has changed over billions of years as revealed in a recently published study in the journal Nature.

From early Earth history, the continental crust (Earth’s thick solid outer skin that we live on) has accumulated mass from the underlying hot mantle. Most of the newly formed crust, however, is lost again. At mid-ocean ridges at the bottom ocean, where plates drift apart, new oceanic crust is constantly produced as basaltic rocks when hot volcanic lava emerges from the mantle and solidifies. The oceanic crust moves away from the mid-ocean-ridges and ultimately gets transported back into the underlying mantle through “subduction” at ocean trenches.

Uranium is enriched in the rocks of the continental crust; however, at Earth’s surface, different environments over time have influenced its mobility. In an oxygen-free atmosphere, as prevailed on early Earth, uranium stayed immobile in rocks as tetravalent uranium (IV). Only after atmospheric oxygen was formed did uranium become oxidised to its mobile hexavalent uranium (VI). This more mobile uranium may then be released during the weathering and break-down of rocks and transported to the oceans in aqueous form. As the cooling oceanic crust moves away from the mid-ocean-ridges in the oceans, seawater eventually percolates through cracks in its rock and in the process uranium gets incorporated into the oceanic crust, in a similar way that a sponge takes up water.

“The radioactive nature of uranium isotopes has long been key in reconstructing early Earth history, but we now see that they also have another story to tell” explains Morten Andersen, a geochemist in the Department of Earth Sciences at ETH Zurich.

Uranium isotopes form specific signatures

For this work, conducted at the University of Bristol including Morten Andersen (now Earth Science, ETH Zurich) along with researchers from the Durham (UK), Wyoming and Rhode Island (US), used the ‘fingerprint’ carried in the ratio of the two uranium isotopes.

The specific “fingerprint” derived from the ratio of the uranium isotopes, relates to uranium oxidation processes at Earth’s surface. In particular, the researchers found that a higher ratio of uranium-238 to uranium-235 is incorporated into the modern oceanic crust, when compared to the uranium isotope signature found in meteorites. The meteorites represent Earth’s “building blocks” and, thus, yield the original uranium isotope composition of Earth as a whole, and also the undisturbed mantle. This uranium isotope “fingerprint” of the altered oceanic crust provides a way to trace uranium that has moved from the surface and back into Earth’s interior through subduction.

In order to examine the uranium cycle (and the rock cycle), the researchers analysed mid-ocean ridge basalts (MORBs), the hot volcanic lava that is produced from the upper and well-mixed part of the mantle. The ratio of the uranium isotopes in MORBs can be compared with those found in ocean island basalts in places such as Hawaii and the Canary Islands. These islands are so-called “hot-spots” with lava formed from hot mantle plumes that up-well beneath the oceanic crust. Compared to the MORB mantle, the island basalts are made up of material transported to the surface from a much deeper, less well-mixed, mantle sources.

Heavy uranium from surface to the deep

The isotope ratios for uranium-238 to uranium-235 are significantly greater for MORBs than for ocean island basalts. The ratios are also higher than that found in meteorites. This suggests that the MORBs contain a “fingerprint” of the uranium from the oceanic crust, drawn down from the surface and into the upper part of Earth’s mantle through subduction, according to Andersen.

Through convection — slow movements of material in the upper mantle — the material was eventually mixed around and carried to the area of the mid-ocean ridges and transported back to the surface in the lavas that make up MORBs.

A drill core of altered oceanic crust near a mid-ocean ridge with uranium-bearing in-fillings (rust-brown areas) (Photo: IODP)

In contrast, the island basalts’ ratios of uranium-238 to uranium-235 correspond to those of the meteorites used in the study and showed that these rocks could not have the same mantle source as the MORBs. The researchers explain that ocean island lavas comes from a deeper, less mixed, mantle source and therefore any uranium added from the surface originates from a much earlier time in Earth’s history, when the surface environment was very different from today.

Study co-author Heye Freymuth of the University of Bristol explains: “Although uranium was incorporated into the oceanic crust since the initial rise in atmospheric oxygen about 2.4 billion years ago, the ocean crust did not incorporate higher amounts of uranium-238 as the oceans did not yet have adequate supplies of oxygen.”

Only during the second marked increase in atmospheric oxygen content 600 million years ago did the deep ocean become fully oxidised, which allowed the oceanic crust to gain the “fingerprint” of high uranium-238. So, despite the oceanic crust having been transported into Earth’s mantle for a long time, the uranium isotope ratio of the subducted oceanic crust first differed from Earth’s mantle only after the full oxidation of the oceans.

“An important result of this study is how changing conditions on Earth’s surface and the increase of oxygen in the atmosphere influenced the composition of deep Earth. Our results suggest that due to changes over the past 600 million years, uranium was mobilised from the surface, transported into Earth’s interior and distributed within the mantle,” says Andersen.

Hot debate about Earth’s early days

The study of uranium and the crust’s cycle brings new perspectives to the debate about how the face of Earth has changed over billions of years. “This is currently one of the hottest research topics for Earth scientists,” Andersen points out. Particularly lively debates take place on how the concentration of oxygen in the atmosphere evolved; after all, it is associated with many other geological weathering processes, including the fate of uranium. The current study is mainly fundamental research in a relatively young research area. The identified uranium isotope signatures could in future be used commercially to detect unknown uranium deposits and help understand processes of uranium mobility. The first basic scientific work pointing to the potential of uranium-238 to uranium-235 variation on Earth was published in 2007. The study by Andersen and his colleagues is the first to use the uranium isotope ratio for the examination of igneous rock and apply it to the recycling process in deep Earth.

Reference:
Morten B. Andersen, Tim Elliott, Heye Freymuth, Kenneth W. W. Sims, Yaoling Niu, Katherine A. Kelley. The terrestrial uranium isotope cycle. Nature, 2015; 517 (7534): 356 DOI: 10.1038/nature14062

Note : The above story is based on materials provided by ETH Zürich. The original article was written by Peter Rüegg.

Fossil ankles indicate Earth’s earliest primates lived in trees

Fossil ankles show that Purgatorius, an early primate, lived in trees. Credit: Patrick Lynch/Yale University

Earth’s earliest primates have taken a step up in the world, now that researchers have gotten a good look at their ankles.

A new study has found that Purgatorius, a small mammal that lived on a diet of fruit and insects, was a tree dweller. Paleontologists made the discovery by analyzing 65-million-year-old ankle bones collected from sites in northeastern Montana.

Purgatorius, part of an extinct group of primates called plesiadapiforms, first appears in the fossil record shortly after the extinction of non-avian dinosaurs. Some researchers have speculated over the years that primitive plesiadapiforms were terrestrial, and that primates moved into the tree canopy later. These ideas can still be found in some textbooks today.

“The textbook that I am currently using in my biological anthropology courses still has an illustration of Purgatorius walking on the ground. Hopefully this study will change what students are learning about earliest primate evolution and will place Purgatorius in the trees where it rightfully belongs,” said Stephen Chester, the paper’s lead author. Chester, who conducted much of the research while at Yale University studying for his Ph.D., is an assistant professor at Brooklyn College, City University of New York. Chester is also a curatorial affiliate at the Yale Peabody Museum of Natural History.

Until now, paleontologists had only the animal’s teeth and jaws to examine, which left much of its appearance and behavior a mystery. The identification of Purgatorius ankle bones, found in the same area as the teeth, gave researchers a better sense of how it lived.

“The ankle bones have diagnostic features for mobility that are only present in those of primates and their close relatives today,” Chester said. “These unique features would have allowed an animal such as Purgatorius to rotate and adjust its feet accordingly to grab branches while moving through trees. In contrast, ground-dwelling mammals lack these features and are better suited for propelling themselves forward in a more restricted, fore-and-aft motion.”

The research provides the oldest fossil evidence to date that arboreality played a key role in primate evolution. In essence, said the researchers, it implies that the divergence of primates from other mammals was not a dramatic event. Rather, primates developed subtle changes that made for easier navigation and better access to food in the trees.

The research appears in the Jan. 19 online edition of the Proceedings of the National Academy of Sciences.

Reference:
Stephen Gregory Benson Chester, Jonathan I. Bloch, Doug M. Boyer, William A. Clemens. Oldest known euarchontan tarsals and affinities of Paleocene Purgatorius to Primates. Proceedings of the National Academy of Sciences, 2015;

Note :The above story is based on materials provided by Yale University. The original article was written by Jim Shelton.

Ten years after the disaster: Tsunami-Early Warning System for the Indian Ocean

Technical concept of GITEWS. Credit: Image courtesy of Helmholtz Centre Potsdam – GFZ German Research Centre for Geoscience

The day after Christmas this year will mark the 10 anniversary of the tsunami disaster in the Indian Ocean. On 26 December 2004, a quarter of a million people lost their lives, five million required immediate aid and 1.8 million citizens were rendered homeless. The natural disaster, which caused extreme devastation over huge areas and the accompanying grief and anxiety, especially in Indonesia, Thailand and Sri Lanka exceeded the imaginable and reached such drastic dimensions, mainly due to the lack of a warning facility and a disaster management plan for the entire Indian Ocean region at this time.

Germany and the international community of states reacted with immediate support. Within the framework of the German Flood Victim Aid the Federal Government commissioned the Helmholtz Association of German Research Centres under the direction of the GFZ German Research Centre for Geosciences with the development of an Early Warning System for the Indian Ocean. From 2005 to 2011, with the large-scale project GITEWS (German-Indonesian Tsunami Early Warning System), the core of an integrated, modern, and effective Tsunami Early Warning System in Indonesia was established.

With the follow-up project PROTECTS (Project for Training, Education and Consulting for Tsunami Early Warning Systems, 2011-2014) the personnel of the participating Indonesian institutions were trained to proceed independently and to take over responsibility for the operation of the Early Warning System as well as for the diverse technical and organizational components. In this ways PROTECTS which started in June 2011 and comprised a total of 192 training courses, internships, and hands-on-practice courses, covering all aspects of operation and maintenance of the Tsunami-Early Warning System contributed significantly to the sustainability of InaTEWS.

Under the auspices of the IntergovernmentalOceanographicCommission of UNESCO and with the collaboration of international partner institutes from Germany, the USA, China and Japan, GITEWS was integrated into a Tsunami Early Warning System for Indonesia. GITEWS was positively reviewed by a commission of international experts in 2010 and handed over to Indonesia in March 2011. Since then it has been providing its services under the name InaTEWS — Indonesian Tsunami Early Warning System and is operated by the Indonesian Service for Meteorology, Climatology and Geophysics BMKG.

On 12 October 2011 the exercise drill “IOWAVE11” was carried out in the Indian Ocean. With this drill, InaTEWS successfully demonstrated that it could, furthermore, take over the role of a Regional Tsunami Service Provider (RTSP). Since then Indonesia, in addition to Australia und India, performs the double function as a National Tsunami Warning Center (NTWC) and also as a RTSP and takes over the responsibility for the timely warning of 28 states around the Indian Ocean in the event of a threatening Tsunami. With the on-going step-by-step development, a comprehensive all-encompassing InaTEWS could be successfully realized.

Indonesia now avails of one of the most modern Tsunami Early Warning Systems. On the basis of data from approx. 300 measuring stations a warning can be issued at a maximum of five minutes after an earthquake. These measuring stations include e.g. seismometers, GPS stations und coastal tide gauges. With the data gained from the sensors and using the most modern evaluation systems such as SeisComP3 which was developed by GFZ scientists for the analyses of earthquake data and a Tsunami simulation system in the Warning Centre it is possible to compile a comprehensive picture of the situation.

With the aid of a decision support system respectively classified warnings for the affected coastal areas can then be issued. A total of 70 people are involved the operation of the Warning Centre in Jakarta, with 30 employees working solely in a full shift system. According to information provided by the BMKG a total of 1700 earthquakes with a magnitude of more than M= 5 and 11 quakes with a magnitude of 7 and higher have been evaluated and six Tsunami Warnings have been issued to the public by the Earthquake Monitoring and Tsunami Early Warning Centre since the hand over in March 2011.

Schooling, training and disaster precautions (capacity development) for the local community and Town and District councils have received special emphasis. This Capacity Development has been carried out since 2006 in three “typical” regions: Padang (Sumatra), Chilacap (South-Java) and Denpassar (Bali, tourist stronghold). Here particular emphasis was placed on understanding both the warnings issued and the planned evacuation measures.

Local disaster management structures are established with local decision-makers and Disaster Risk Reduction Strategies are developed. Specifically, the education of trainers who are, in turn, responsible for the further spreading of the developed concepts plays a significant role.

Another key element is the determination of hazard and risk maps as a basis for the local evacuation planning as well as for future town and land-use planning. In Bali communication with the hotel industry was an additional factor.

No Early Warning System will ever be able to prevent a strong earthquake and a resulting tsunami and also, in the future, there will be loss of life and material damage. However, through the existence of an Early Warning System and the integration of organizational measures together with comprehensive capacity building the adverse effects of such a natural disaster can certainly be reduced.

Note : The above story is based on materials provided by Helmholtz Centre Potsdam – GFZ German Research Centre for Geosciences.

Melting glaciers have big carbon impact

Scientists have done field work in Tibet and Alaska, among other places as part of this study. Credit: Robert Spencer/Florida State

As Earth warms and glaciers all over the world begin to melt, researchers and public policy experts have focused largely on how all of that extra water will contribute to sea level rise.

But another impact lurking in that inevitable scenario is carbon.

More specifically, what happens to all of the organic carbon found in those glaciers when they melt?

That’s the focus of a new paper by a research team that includes Florida State University assistant professor Robert Spencer. The study, published in Nature Geoscience, is the first global estimate by scientists at what happens when major ice sheets break down.

“This is the first attempt to figure out how much organic carbon is in glaciers and how much will be released when they melt,” Spencer said. “It could change the whole food web. We do not know how different ecological systems will react to a new influx of carbon.”

Glaciers and ice sheets contain about 70 percent of Earth’s freshwater and ongoing melting is a major contributor to sea level rise. But, glaciers also store organic carbon derived from both primary production on the glaciers and deposition of materials such as soot or other fossil fuel combustion byproducts.

Spencer, along with colleagues from Alaska and Switzerland, studied measurements from ice sheets in mountain glaciers globally, the Greenland ice sheet and the Antarctic ice sheet to measure the total amount of organic carbon stored in the global ice reservoir.

It’s a lot.

Specifically, as glaciers melt, the amount of organic carbon exported in glacier outflow will increase 50 percent over the next 35 years. To put that in context, that’s about the amount of organic carbon in half of the Mississippi River being added each year to the ocean from melting glaciers.

“This research makes it clear that glaciers represent a substantial reservoir of organic carbon,” said Eran Hood, the lead author on the paper and a scientist with the University of Alaska Southeast. “As a result, the loss of glacier mass worldwide, along with the corresponding release of carbon, will affect high-latitude marine ecosystems, particularly those surrounding the major ice sheets that now receive fairly limited land-to-ocean fluxes of organic carbon.”

Spencer said he and his colleagues are continuing on this line of research and will do additional studies to try to determine exactly what the impact will be when that carbon is released into existing bodies of water.

“The thing people have to think about is what this means for Earth,” Spencer said. “We know we’re losing glaciers, but what does that mean for marine life, fisheries, things downstream that we care about? There’s a whole host of issues besides the water issue.”

Reference:
Eran Hood, Tom J. Battin, Jason Fellman, Shad O’Neel, Robert G. M. Spencer. Storage and release of organic carbon from glaciers and ice sheets. Nature Geoscience, 2015; DOI: 10.1038/ngeo2331

Note : The above story is based on materials provided by Florida State University.

Underwater volcano erupts off Tonga

An underwater volcano off Tonga was spewing ash high into the air on Tuesday ” 13 January, 2015, causing several carriers to suspend air travel to the South Pacific island nation and turning the surrounding ocean blood red, residents and officials said.

The Hunga Tonga-Hunga Ha’apai underwater volcano, about 65km north of the capital Nuku’alofa, was sending volcanic ash up to 4,500m into the air, the Wellington Volcanic Ash Advisory Centre (VAAC) said.

Volcanic eruption on Cape Verde Island

Eruption of the Fogo volcano/Cape Verde Islands, January 2015. Credit: Judith Levy, GFZ

A new volcanic eruption commenced on Fogo, one of the Cape Verde Islands, on November 23rd, 2014. This eruption continues to date, and is considered to be the largest eruption by volume, and in terms of damage, on the archipelago for over 60 years. Most damage was caused by lava flows advancing into populated regions, so that numerous buildings, homes and roads were destroyed. In total, three villages have been abandoned and thousands of residents have had to be evacuated.

A team from the GFZ German Research Centre for Geosciences is currently conducting research to support local partners and to better assess the evolution of the eruption and associated hazards. Stimulated by a contact point for the European CECIS (Common Emergency Communication and Information System), the GFZ has started to observe the volcano eruption and to provide support on data acquisition and interpretation. “Our team, the GFZ Hazard and Risk Team HART, works in close collaboration with the University of Cape Verde, the Volcano Observatory of the Canary Islands, and the German Aerospace Centre,” says GFZ-volcanologist Dr. Thomas Walter. “On one hand, we are analysing data from the newest remote sensing satellites to develop models of the magma ascent path. On the other, we are collecting data on the lava flows directly in the field by installing volcano monitoring instruments.”

Three dimensional view on the Fogo volcanic island, Cape Verdes. The radar satellite Sentinel-1 enables a recording of movements of the ground. The figure shows a movement towards the satellite in blue, and a movement away from the satellite in red. By means of computer simulations, GFZ researchers could compute the likely position and dimension of a magma-filled crack at depth, through which magma has ascended to the eruption site. The eruption did not occur at the volcano summit Pico do Fogo, but just above the magma filled crack. (Graphics: Thomas Walter, Mehdi Nikkhoo und Pau Prats).

The satellite data, which is acquired by the European Space Agency’s Sentinel-1 satellite, enables the measurement of ground movements associated with the volcano eruption. The GFZ scientists have succeeded in locating and following the path of the magma from depth to its point of eruption. As a result, the location of the ascent paths at depth explains well why the eruption site is off-centered with respect to the volcano summit. The Sentinel-1 satellite acquires new imagery about once per week, which allows for regular updates on the ground movement and the magma ascent path beneath.

This remote sensing data is complemented by an expedition team that is making different types of measurements. Infrared recordings allow for monitoring temperature changes. A laser scanner, in addition, provides topographic measurements at millions of points. GFZ scientist Walter explains: “This data allows us to quantify the erupted lava volumes and also to better assess the hazard associated with lava flows to come.” The remaining duration of the eruption is not known. The magma’s eruption rate has decreased, but concerns have arisen about a recent increase of the explosive character of the eruption and related ash dispersion. These developments are currently being investigated, although they mean that an all-too-close approach to the eruption site remains dangerous.

Note : The above story is based on materials provided by Helmholtz Centre Potsdam – GFZ German Research Centre for Geosciences.

NASA mountaintop sensor finds high methane over Los Angeles

The Los Angeles basin from Mt. Wilson. Credit: NASA/JPL-Caltech

A NASA study using two years of observations from a novel mountaintop instrument finds that Los Angeles’ annual emissions of methane, an important greenhouse gas, are 18 to 61 percent higher than widely used estimates. The study is the first to demonstrate the feasibility of long-term mapping of greenhouse gases across an urban area from an elevated — but still earthbound — site.

“For the first time, we’ve been able to provide an accurate estimate of total methane emissions from the Los Angeles basin, whatever their sources,” said senior research scientist Stanley Sander of NASA’s Jet Propulsion Laboratory, Pasadena, California, the new instrument’s principal investigator. “Altogether, it’s a very significant increase in the estimate.”

Methane is extremely efficient at trapping heat and warming the planet. Its urban sources include gas pipeline leaks, landfills, wastewater treatment plants and transportation.

The study used observations by an instrument called a spectrometer, which measures the effect of methane and other gases on the spectrum of sunlight, allowing it to “count” the number of molecules in the air above LA. The instrument is part of the California Laboratory for Atmospheric Remote Sensing (CLARS), located about 5,700 feet (1,700 meters) above Los Angeles atop Mt. Wilson. Because of regional air patterns, virtually none of LA’s pollution drifts as high as the CLARS site, but all of it is within view. “The instrument is like a stationary satellite,” said Clare Wong, a NASA postdoctoral fellow at JPL and lead author of a paper on the new study in the journal Atmospheric Chemistry and Physics.

Every 90 minutes during daylight hours, the CLARS spectrometer points at one after another of 28 flat, unobstructed sites throughout the Los Angeles basin, including Angels Stadium in Anaheim and the Santa Anita racetrack in Arcadia. The spectrometer measures how much methane, carbon dioxide and other pollutants are in the air between it and each site. It also takes a measurement in the clean air above the mountain. The difference between the clean-air and ground-site measurements gives the amount of methane in the LA basin.

Over the sprawling 30-by-70-mile LA basin (50 by 110 kilometers), methane emissions were estimated to be 430,000 U.S. tons (0.39 teragrams) per year. This is significantly larger than the value obtained by the common method of adding up estimated emissions from all known methane sources.

Although the study was not specifically designed to find out where the methane is coming from, “certain areas seem to be more significant emitters than others,” Sander said. “The ones we have been able to identify are — perhaps coincidentally, but perhaps not — located near large landfills. That is consistent with our understanding that landfills have the potential to be methane sources under certain conditions.” The highest concentrations were recorded at ground sites in eastern Los Angeles County and near the Rose Bowl in Pasadena.

The mountaintop instrument is part of the pilot Megacities Carbon Project to monitor emissions from urban areas with populations of more than 10 million. Cities are the source of about 70 percent of the world’s carbon emissions, and Earth’s 22 megacities are responsible for about half of that 70 percent. Sander noted that a setup like CLARS would work equally well in other megacities that are overlooked by mountains, such as Rio de Janeiro, Seoul and Mexico City.

The Megacities Carbon Project LA site is funded by NASA; the National Institute of Standards and Technology; the National Oceanic and Atmospheric Administration; the Keck Institute for Space Studies, Pasadena, California; and the California Air Resources Board, Sacramento, California. To learn more about the initiative, visit:

http://megacities.jpl.nasa.gov

Why Is Methane Important?

Methane is a greenhouse gas that traps heat in Earth’s atmosphere and warms it. It is the third most abundant greenhouse gas, behind water vapor and carbon dioxide.

While methane is much less prevalent in Earth’s atmosphere than carbon dioxide, molecule for molecule, it packs a much bigger punch, particularly on short timescales. Because of its potency and potential to contribute to climate change, scientists are interested in how its concentrations may be changing.

Currently, more than half of atmospheric methane comes from human-related sources, such as livestock, landfills and leaks of natural gas into the atmosphere during its extraction, storage, transportation and distribution. Natural gas is primarily composed of methane.

Natural sources of methane include wetlands and termite mounds.

Reference:
K. W. Wong, D. Fu, T. J. Pongetti, S. Newman, E. A. Kort, R. Duren, Y.-K. Hsu, C. E. Miller, Y. L. Yung, S. P. Sander. Mapping CH4: CO2 ratios in Los Angeles with CLARS-FTS from Mount Wilson, California. Atmospheric Chemistry and Physics, 2015; 15 (1): 241 DOI: 10.5194/acp-15-241-2015

Note : The above story is based on materials provided by NASA/Jet Propulsion Laboratory.

Related Articles