Landslides are responsible for nearly 10,000 victims every year. Nearly 60% of all landslides are triggered by earthquakes. Researchers from IRD and INGEMMET in Peru have produced the first series measurements of this kind of landslide reactivated by an earthquake. The quake that occurred in the region of Maca in south Peru in July 2013 led to ground subsidence, a phenomenon observed for more than a month.
This new data and the resulting model also reveal the analogy between the mechanics of ground movements and tectonic faults, opening up new avenues for research into the dynamics of these faults.
During earthquakes in mountainous areas, nearly a third of victims can be attributed to landslides triggered by the quake. However, the mechanisms of these ground movements under seismic forcing are little known because there is limited data recorded in situ during earthquakes.
Triple displacement after the quake
Researchers from IRD and the Instituto Geológico Minero y Metalúrgico (INGEMMET) in Peru have just provided the first observations from a landslide reactivated by an earthquake that occurred in July 2013 in southern Peru. GPS measurements show that the response of the landslide is both concomitant with the earthquake, with a simultaneous displacement of 2cm, but also post-seismic. In fact, the slip continued for five weeks, during which the extent of displacement tripled, reaching 6cm. This study has been published in the Geophysical Research Letters.
A miniature tectonic response
This new data also made it possible to model the mechanics of the landslide and reveal ground movement analogous with that of creeping tectonic faults in response to significant earthquakes. In other words, this study illustrates the similarities between the mechanics of landslides and those of creeping tectonic faults. This will be valuable in preventing the risks related to landslides, but it also opens up new avenues for research into these faults. Due to their smaller dimensions, more superficial nature and their greater kinematics, landslides may serve as models to develop better understanding of the friction parameters of faults, on an intermediary level between the laboratory and the real-life situation.
A sensitive zone under threat
The Maca landslide, the effects of which are ongoing, covers a surface area of almost 1 km². It affects a village of around 900 inhabitants, located in the Colca valley 70km north of Arequipa. It has also provoked the subsidence of a road used by a high number of tourists (160,000 visitors a year) and is threatening the pre-Inca terraces. Since this zone is highly sensitive to earthquakes, the phenomenon has been tracked by GPS since 2011, as part of the partnership between IRD and INGEMMET. Falling mainly between December to April, rain is another factor contributing to the slip. This led the regional government of Arequipa asking for the relocation of Maca inhabitants in May 2013.
Reference:
Lacroix Pascal, Perfettini Hugo, Taipe Edu, Guillier Bertrand,” Coseismic and postseismic motion of a landslide: Observations, modeling, and analogy with tectonic faults,” Geophysical Research Letters, 2014, 41, DOI: 10.1002/2014GL061170
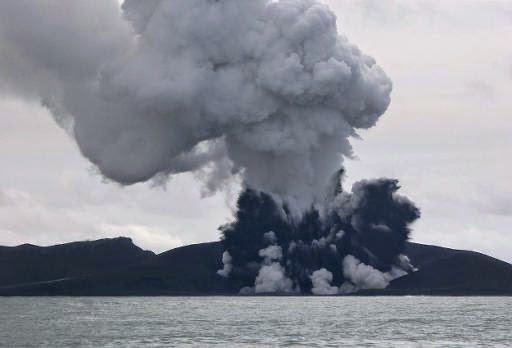
Smoke rises from a volcano some 65 km south-west of the South Pacific nation Tonga’s capital Nuku’alofa, as seen in this image from New Zealand’s Ministry of Foreign Affairs and Trade, released on January 15, 2015
A Tongan volcano has created a substantial new island since it began erupting last month, spewing out huge volumes of rock and dense ash that has killed nearby vegetation, officials said on Friday.
The volcano, about 65 kilometres (40 miles) northwest of the South Pacific nation’s capital Nuku’alofa, rumbled to life on December 20 for the first time in five years, the Lands and Natural Resources Ministry said.
It said the volcano was erupting from two vents, one on the uninhabited island of Hunga Ha’apai and the other underwater about 100 metres offshore.
The ministry said experts took a boat trip to view the eruption on Thursday and confirmed it had transformed the local landscape.
“The new island is more than one kilometre wide, two kilometres long and about 100 metres high,” it said in a statement.
“During our observations the volcano was erupting about every five minutes to a height of about 400 metres, accompanied by some large rocks… as the ash is very wet, most is being deposited close to the vent, building up the new island.”
It said ash and acidic rain was deluging an area 10 kilometres around the volcano, adding: “Leaves on trees on Hunga Tonga and Hunga Ha’apai have died, probably caused by volcanic ash and gases.”
A number of international flights were cancelled earlier this week amid concerns about the volcano’s ash plume but they resumed on Wednesday, with authorities saying debris from the eruption was not being thrown high into the atmosphere.
Tonga, which is almost 2,000 kilometres northeast of New Zealand, lies on the so-called Pacific “Ring of Fire”, where continental plates collide causing frequent volcanic and seismic activity.
Note : The above story is based on materials provided by AFP.
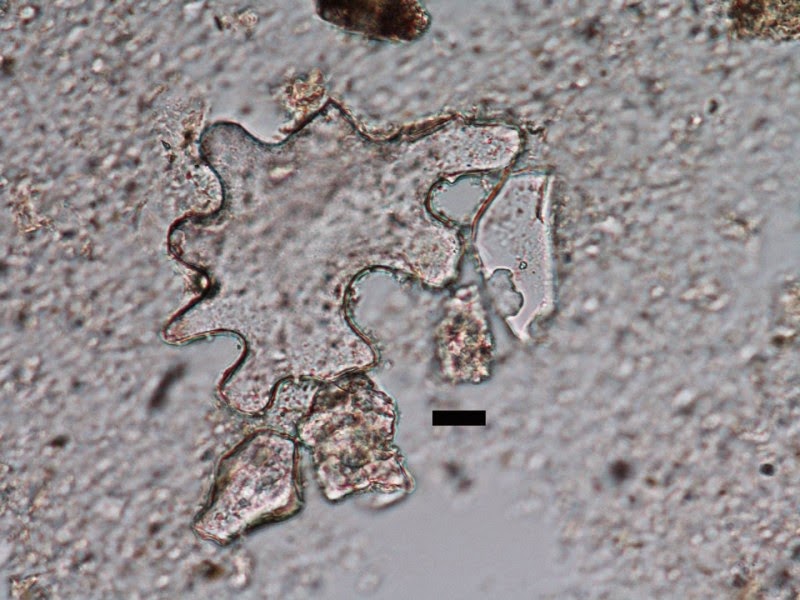
This is a 49 million-year-old epidermal phytolith from a fossil soil horizon of the Las Flores Formation. Its curvy and large shape indicate the plant it came from grew in shady conditions. Scale bar = 10 micrometers. Credit: Regan Dunn, U of Washington
Minuscule, fossilized pieces of plants could tell a detailed story of what the Earth looked like 50 million years ago.
An international team led by the University of Washington has discovered a way to determine the tree cover and density of trees, shrubs and bushes in locations over time based on clues in the cells of plant fossils preserved in rocks and soil. Tree density directly affects precipitation, erosion, animal behavior and a host of other factors in the natural world. Quantifying vegetation structure throughout time could shed light on how the Earth’s ecosystems changed over millions of years.
“Knowing an area’s vegetation structure and the arrangement of leaves on the Earth’s surface is key for understanding the terrestrial ecosystem. It’s the context in which all land-based organisms live, but we didn’t have a way to measure it until now,” said lead author Regan Dunn, a paleontologist at the UW’s Burke Museum of Natural History and Culture. Dunn completed this work as a UW doctoral student in the lab of Caroline Strömberg, the Estella B. Leopold associate professor in biology and curator of paleobotany at the Burke Museum.
The findings are published Jan. 16 in the journal Science.
The team focused its fieldwork on several sites in Patagonia, Argentina, which have some of the best-preserved fossils in the world and together represent 38 million years of ecosystem history (49-11 million years ago). Paleontologists have for years painstakingly collected fossils from these sites, and worked to precisely determine their ages using radiometric dating. The new study builds on this growing body of knowledge.
In Patagonia and other places, scientists have some idea based on ancient plant remains such as fossilized pollen and leaves what species of plants were alive at given periods in Earth’s history. For example, the team’s previous work documented vegetation composition for this area of Patagonia. But there hasn’t been a way to precisely quantify vegetation openness, aside from general speculations of open or bare habitats, as opposed to closed or tree-covered habitats.
“Now we have a tool to go and look at a lot of different important intervals in our history where we don’t know what happened to the structure of vegetation,” said Dunn, citing the period just after the mass extinction that killed off the dinosaurs.
“The significance of this work cannot be understated,” said co-author Strömberg. “Vegetation structure links all aspects of modern ecosystems, from soil moisture to primary productivity to global climate. Using this method, we can finally quantify in detail how Earth’s plant and animal communities have responded to climate change over millions of years, which is vital for forecasting how ecosystems will change under predicted future climate scenarios.”
Work by other scientists has shown that the cells found in a plant’s outermost layer, called the epidermis, change in size and shape depending on how much sun the plant is exposed to while its leaves develop. For example, the cells of a leaf that grow in deeper shade will be larger and curvier than the cells of leaves that develop in less covered areas.
Dunn and collaborators found that these cell patterns, indicating growth in shade or sun, similarly show up in some plant fossils. When a plant’s leaves fall to the ground and decompose, tiny silica particles inside the plants called phytoliths remain as part of the soil layer. The phytoliths were found to perfectly mimic the cell shapes and sizes that indicate whether or not the plant grew in a shady or open area.
The researchers decided to check their hypothesis that fossilized cells could tell a more complete story of vegetation structure by testing it in a modern setting: Costa Rica.
Dunn took soil samples from sites in Costa Rica that varied from covered rainforests to grassy savannahs to woody shrub lands. She also took photos looking directly up at the tree canopy (or lack thereof) at each site, noting the total vegetation coverage.
Back in the lab, she extracted the phytoliths from each soil sample and measured them under the microscope. When compared with tree coverage estimated from the corresponding photos, Dunn and co-authors found that the curves and sizes of the cells directly related to the amount of shade in their environments. The researchers characterized the amount of shade as “leaf area index,” which is a standard way of measuring vegetation over a specific area.
Testing this relationship between leaf area index and plant cell structures in modern environments allowed the team to develop an equation that can be used to predict vegetation openness at any time in the past, provided there are preserved plant fossils.
“Leaf area index is a well-known variable for ecologists, climate scientists and modelers, but no one’s ever been able to imagine how you could reconstruct tree coverage in the past — and now we can,” said co-author Richard Madden of the University of Chicago. “We should be able to reconstruct leaf area index by using all kinds of fossil plant preservation, not just phytoliths. Once that is demonstrated, then the places in the world where we can reconstruct this will increase.”
When Dunn and co-authors applied their method to 40-million-year-old phytoliths from Patagonia, they found something surprising — habitats lost dense tree cover and opened up much earlier than previously thought based on other paleobotanic studies. This is significant because the decline in vegetation cover occurred during the same period as cooling ocean temperatures and the evolution of animals with the type of teeth that feed in open, dusty habitats.
The research team plans to test the relationship between vegetation coverage and plant cell structure in other regions around the world. They also hope to find other types of plant fossils that hold the same information at the cellular level as do phytoliths.
Reference:
R. E. Dunn, C. A. E. Stromberg, R. H. Madden, M. J. Kohn, A. A. Carlini. Linked canopy, climate, and faunal change in the Cenozoic of Patagonia. Science, 2015; 347 (6219): 258 DOI: 10.1126/science.1260947
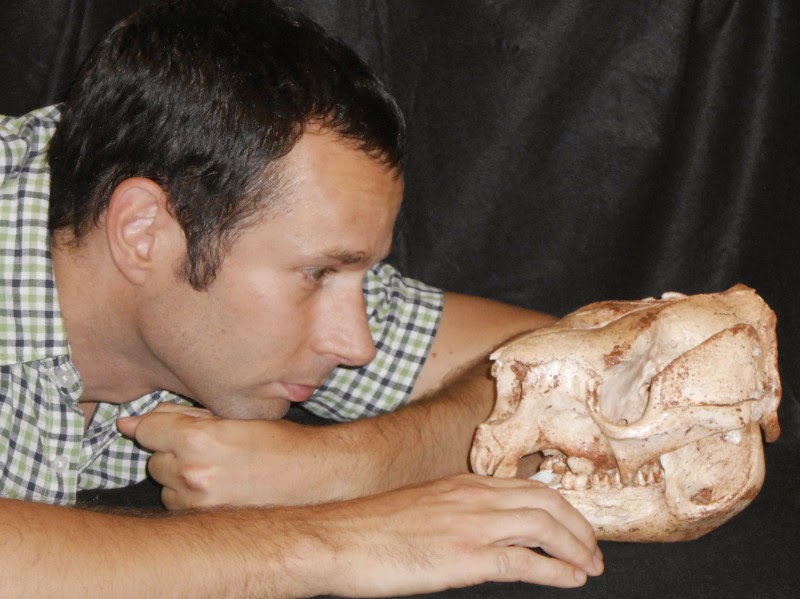
Dr Bastien Llamas with a skull of an extinct short-faced kangaroo (Simosthenurus occidentalis). Credit: Mike Lee / SA Museum
Scientists have finally managed to extract DNA from Australia’s extinct giant kangaroos ─ the mysterious marsupial megafauna that roamed Australia over 40,000 years ago.
A team of scientists led by Dr Bastien Llamas and Professor Alan Cooper from the University of Adelaide’s Australian Centre for Ancient DNA (ACAD) have extracted DNA sequences from two species: a giant short-faced kangaroo (Simosthenurus occidentalis) and a giant wallaby (Protemnodon anak). These specimens died around 45,000 years ago and their remains were discovered in a cold and dry cave in Tasmania.
Relatively good preservation conditions in the cave allowed enough short pieces of DNA to survive so researchers could reconstruct partial “mitochondrial genomes”─genetic material transmitted from mother to offspring and widely used to infer evolutionary relationships.
“The ancient DNA reveals that extinct giant wallabies are very close relatives of large living kangaroos, such as the red and western grey kangaroos,” says lead author Dr Bastien Llamas, ACAD senior research associate. “Their skeletons had suggested they were quite primitive macropods─a group that includes kangaroos, wallabies, pademelons and quokkas─but now we can place giant wallaby much higher up the kangaroo family tree.”
The research has also confirmed that short-faced kangaroos are a highly distinct lineage of macropods, which had been predicted on their unusual anatomy.
Generally poor preservation conditions and the age of Australian megafaunal remains has prevented retrieval of its DNA until now, although complete nuclear or mitochondrial genomes have been previously obtained from extinct megafauna from Eurasia, the Americas, and New Zealand. Scientists attempting to decipher the evolutionary relationships of the Australian megafauna were previously restricted to using information from bones.
“In addition to poor DNA preservation, most of the extinct Australian megafauna do not have very close relatives roaming around today, which makes it more difficult to retrieve and interpret the genetic data,” says Dr Llamas. “Together with my colleagues Alan Cooper and Paul Brotherton, we had to think hard about experimental and bioinformatics approaches to overcome more than 10 million years of divergent evolution between the extinct and living species.”
Although ancient DNA confirms that the short-faced kangaroos left no descendants, it also shows their closest living cousin could be the banded hare-wallaby (Lagostrophus fasciatus), which is now restricted to small isolated islands off the coast of Western Australia.
“Our results suggest the banded hare-wallaby is the last living representative of a previously diverse lineage of kangaroos. It will hopefully further encourage and justify conservation efforts for this endangered species,” says co-author Professor Mike Lee of the South Australian Museum and the University’s School of Biological Sciences.
The research is published online (ahead of print) in Molecular Biology and Evolution.
Reference:
B. Llamas, P. Brotherton, K. J. Mitchell, J. E. L. Templeton, V. A. Thomson, J. L. Metcalf, K. N. Armstrong, M. Kasper, S. M. Richards, A. B. Camens, M. S. Y. Lee, A. Cooper. Late Pleistocene Australian Marsupial DNA Clarifies the Affinities of Extinct Megafaunal Kangaroos and Wallabies. Molecular Biology and Evolution, 2014; DOI: 10.1093/molbev/msu338
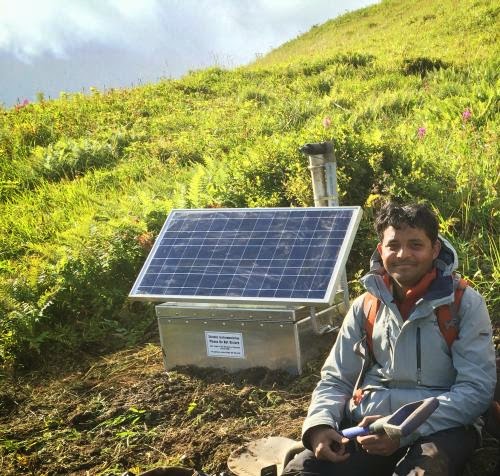
Abhijit Ghosh, seen here near a seismic station he helped set up in Alaska. Credit: GHOSH LAB, UC RIVERSID
An earthquake expert at the University of California, Riverside is leading a team of seismologists and volcanologists to conduct an experiment in Alaska that will record a variety of seismic events in that state. The experiment will also help better describe the characteristics of the Alaska-Aleutian subduction zone, one of the most seismically active regions in the world that is also home to many active volcanoes.
“In spite of being a hot-spot of earthquake and volcanic hazard, this area is poorly studied because of its inaccessibility, remoteness and rugged terrain,” said Abhijit Ghosh, an assistant professor of geophysics in UC Riverside’s Department of Earth Sciences and the research project’s principal investigator.
Called the “Aleutian Array of Arrays,” the project began collaboratively between UCR, the University of Wisconsin-Madison, the Alaska Volcano Observatory and the U.S. Geological Survey. It was launched last year when the researchers set up 19 seismic stations within a 1 kilometer-square area on one of the Aleutian Islands. This seismic array of stations acts like a mini-radar that continuously scans for earthquakes and fault movements beneath the ground. Eventually, more arrays will be set up.
“The carefully designed array we started with is placed in a strategic location so that it can simultaneously image the subduction fault and the volcanic system,” Ghosh said. “Our experiment aims at studying the active Alaska-Aleutian subduction zone using multiple seismic arrays – an array of arrays – that will eventually span a larger area. This is the largest seismic experiment in this part of the Aleutian Islands. This is also the first time that the array of arrays approach is being used in this region.”
Ghosh explained that the Alaska-Aleutian subduction zone experiences frequent damaging earthquakes, a notable example being the magnitude 9.2 Good Friday earthquake in 1964. Ground shaking due to this earthquake and the resulting tsunami caused severe damage in the entire region, including Anchorage, Alaska’s capital.
Faults release stress in the form of earthquakes, which are caused by a sudden slip along faults. Recently, it has been discovered that faults also slip slowly. These so-called “slow earthquakes” occur over days and months, and release significant amount of stress.
Results from a 2012 pilot study done by Ghosh and his colleagues in Alaska showed that the Alaska-Aleutian subduction zone experiences high tremor activity, a signature of slow earthquakes.
“We identified low-frequency earthquakes, which are a specific type of earthquakes characterized by slow movement on the subduction fault,” said Ghosh, who presented the pilot study results in a meeting of the American Geophysical Union in 2013.
He explained that although California’s San Andreas Fault is characterized by a completely different tectonic setting (strike-slip as opposed to subduction), it shows tremor and low-frequency earthquake activity, which are signatures of slow earthquakes.
“We expect the Aleutian Array of Arrays experiment will shed new light on the details of slow earthquakes, physics of fault movement and associated seismic hazards,” Ghosh said. “There are lessons for California in this research.”
His team plans to go back to the Aleutian Islands this summer to install at least two more seismic arrays. These arrays, combined with the one installed this year, will work together to complete the array of arrays.
“They will simultaneously image the subduction megathrust and volcanic system with very high resolution,” Ghosh said.
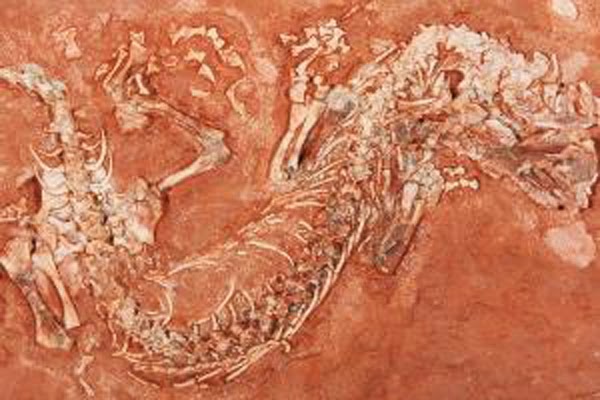
The new ancient reptile has been named Erpetonyx arsenaultorum. Credit: Sean Modesto, CBU
A lucky find by a young boy on a Prince Edward Island beach has revealed important information about the early evolution of reptiles, according to new research from the University of Toronto Mississauga.
In 1995, father and son Ed and Mike Arsenault were exploring the beach at Cape Egmont, Prince Edward Island, when they spotted a fossil embedded in the red sandstone. They pried the rock from the earth to discover a nearly complete fossil of a small animal. After unsuccessful attempts to sell the find, Mike stashed the fossil under his bed where it stayed until years later when an endowment allowed the Royal Ontario Museum to acquire it in 2004.
In a new study published in the January edition of the Proceedings of Royal Society B: Biological Sciences, study co-author and UTM professor Robert Reisz and his team describe the Arsenault find, Erpetonyx arsenaultorum, which turns out to be an entirely new genus and species of reptile that lived millions of years ago, and the first new species from the Canadian Maritimes in over four decades.
Early reptiles evolved during the Carboniferous era when much of this part of the world was covered in swampy forests. Previous data showed that parareptiles (from which turtles originate) had one ancestor that survived the Carboniferous era, however a dearth of specimens leaves large gaps in our understanding of this period.
The Arsenault fossil is the only specimen from this part of the Carboniferous era, and the only reptile specimen from that time. Named in honour of its discoverers, Erpetonyx arsenaultorum adds new branches to the early reptilian family tree, increasing the number of reptiles known to be living at the time.
“Our analysis of the interrelationships of early reptiles reveals that our new species is the closest relative of a enigmatic group called bolosaurid parareptiles,” says Reisz, who adds that the find sheds new light on the diversity of reptiles at the end of the Carboniferous period. “It suggests reptiles were 80 per cent more diverse than previously thought,” he says.
Erpetonyx arsenaultorum has no living relatives, Reisz says, adding that that the 25-com-long lizard would have looked very similar to a modern-day desert iguana. It had clawed feet and small peg-like teeth. “We presume that it was a carnivore and insectivore, eating arthropods and small vertebrates,” he says.
It’s a lucky find. “Small fossils like these are easily overlooked. They are also less likely to be preserved in the fossil record than those of larger species,” Reisz says of the fossil. “This is one of the nicest looking, most complete reptiles of the Carboniferous period.”
Reference:
“The oldest parareptile and the early diversification of reptiles.” Proc. R. Soc. B:2015282 20141912; ” Published 14 January 2015 ” DOI: 10.1098/rspb.2014.1912.
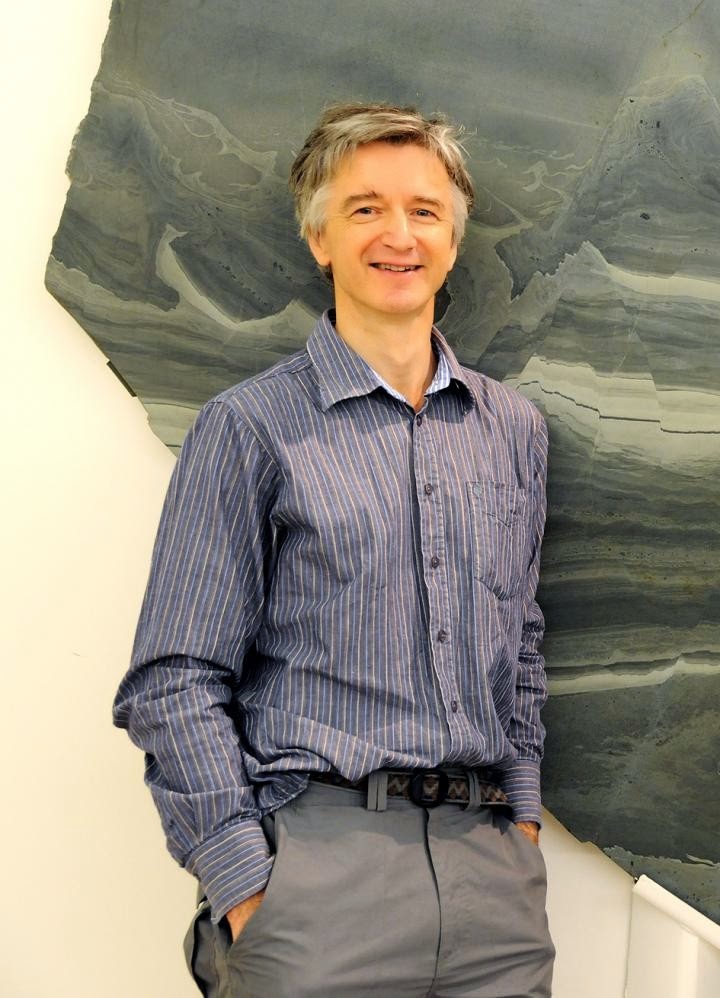
This is Dr. Jan Zalasiewicz of the University of Leicester Department of Geology. Credit: University of Leicester
Scientists identify July 16 1945 as key time boundary in Earth history.
An international group of scientists has proposed a start date for the dawn of the Anthropocene — a new chapter in the Earth’s geological history.
Humans are having such a marked impact on the Earth that they are changing its geology, creating new and distinctive strata that will persist far into the future. This is the idea behind the Anthropocene, a new epoch in Earth history proposed by the Nobel Prize-winning atmospheric chemist Paul Crutzen just 15 years ago. Since then the idea has spread widely through both the sciences and humanities.
But if the Anthropocene is to be a geological epoch — when should it begin? Humans have long affected the environment, and ideas as to when the Anthropocene might start range from the thousands of years ago with the dawn of agriculture, to the Industrial Revolution — and even to the future (for the greatest human-made changes could still be to come).
Now, members of the international working group formally analysing the Anthropocene suggest that the key turning point happened in the mid-twentieth century. This was when humans did not just leave traces of their actions, but began to alter the whole Earth system. There was a ‘Great Acceleration’ of population, of carbon emissions, of species invasions and extinctions, of earth moving, of the production of concrete, plastics and metals.
It included the start, too, of the nuclear age, when artificial radionuclides were scattered across the Earth, from the poles to the Equator, to be leave a detectable signal in modern strata virtually everywhere.
The proposal, signed up to by 26 members of the working group, including lead author Dr Jan Zalasiewicz, who also chairs the working group, and Professor Mark Williams, both of the University of Leicester’s Department of Geology, is that the beginning of the Anthropocene could be considered to be drawn at the moment of detonation of the world’s first nuclear test: on July 16th 1945. The beginning of the nuclear age, it marks the historic turning point when humans first accessed an enormous new energy source — and is also a time level that can be effectively tracked within geological strata, using a variety of geological clues.
Dr Zalasiewicz said: “Like any geological boundary, it is not a perfect marker — levels of global radiation really rose in the early 1950s, as salvoes of bomb tests took place. But it may be the optimal way to resolve the multiple lines of evidence on human-driven planetary change. Time — and much more discussion — will tell.”
This year, the Anthropocene Working Group will put together more evidence on the Anthropocene, including discussion of possible alternative time boundaries. In 2016, the group aims to make recommendations on whether this new time unit should be formalized and, if so, how it might be defined and characterised.
Reference:
Jan Zalasiewicz, Colin N. Waters, Mark Williams, Anthony D. Barnosky, Alejandro Cearreta, Paul Crutzen, Erle Ellis, Michael A. Ellis, Ian J. Fairchild, Jacques Grinevald, Peter K. Haff, Irka Hajdas, Reinhold Leinfelder, John McNeill, Eric O. Odada, Clément Poirier, Daniel Richter, Will Steffen, Colin Summerhayes, James P.M. Syvitski, Davor Vidas, Michael Wagreich, Scott L. Wing, Alexander P. Wolfe, Zhisheng An, Naomi Oreskes. When did the Anthropocene begin? A mid-twentieth century boundary level is stratigraphically optimal. Quaternary International, 2015; DOI: 10.1016/j.quaint.2014.11.045
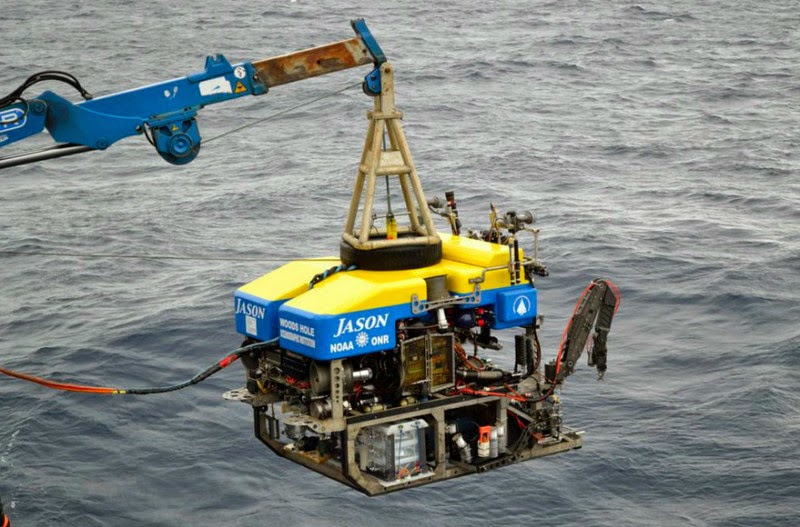
C-DEBI researchers deply the ROV Jason to collect samples. Credit: Courtesy of Alberto Robado / USC
Two miles below the surface of the ocean, researchers have discovered new microbes that “breathe” sulfate.
The microbes, which have yet to be classified and named, exist in massive undersea aquifers — networks of channels in porous rock beneath the ocean where water continually churns. About one-third of Earth’s biomass is thought to exist in this largely uncharted environment.
“It was surprising to find new bugs, but when we go to warmer, relatively old and isolated fluids, we find a unique microbial community,” said Alberto Robador, postdoctoral researcher at the USC Dornsife College of Letters, Arts and Sciences and lead author of a paper on the new findings that will be published by the open-access journal Frontiers in Microbiology on Jan. 14.
Sulfate is a compound of sulfur and oxygen that occurs naturally in seawater. It is used commercially in everything from car batteries to bath salts and can be aerosolized by the burning of fossil fuels, increasing the acidity of the atmosphere.
Microbes that breathe sulfate — that is, gain energy by reacting sulfate with organic (carbon-containing) compounds — are thought to be some of the oldest types of organisms on Earth. Other species of sulfate-breathing microbes can be found in marshes and hydrothermal vents.
Microbes beneath the ocean’s crust, however, are incredibly tricky to sample.
Researchers from USC and the University of Hawaii took their samples from the Juan de Fuca Ridge (off the coast of Washington state), where previous teams had placed underwater laboratories, drilled into the ocean floor. To place the labs, they lowered a drill through two miles of ocean and bored through several hundred feet of ocean sediment and into the rock where the aquifer flows.
“Trying to take a sample of aquifer water without contaminating it with regular ocean water presented a huge challenge,” said Jan Amend, professor at USC Dornsife and director of the Center for Dark Energy Biosphere Investigations (C-DEBI), which helped fund the research.
To solve this problem, C-DEBI created Circulation Obviation Retrofit Kit (CORK) observatories. The moniker was basically dreamed up to fit the term “CORK” because these devices create a seal at the seafloor, like a cork in a bottle, allowing scientists to deploy instruments and sampling devices down a borehole while keeping ocean water out.
Samples were then shuttled to the surface by remote-controlled undersea vehicles or “elevators” — balloons that drop ballast and float samples gently up to the waiting scientists.
Like the microbes on the forest floor that break down leaf litter and dead organisms, the microbes in the ocean also break down organic — that is, carbon-based — material like dead fish and algae. Unlike their counterparts, however, the microbes beneath the ocean crust often lack the oxygen that is used on land to effect the necessary chemical reaction.
Instead, these microbes can use sulfate to break down carbon from decaying biological material that sinks to the sea bottom and makes its way into the crustal aquifer, producing carbon dioxide.
Learning how these new microbes function will be important to getting a more accurate, quantified understanding of the overall global carbon cycle — a natural cycling of carbon through the environment in which it is consumed by plants, exhaled by animals and enters the ocean via the atmosphere. This cycle is currently being disrupted by human-made carbon dioxide emissions.
“This is the first direct account of microbial activity in these type of environments,” Robador said, “and shows the potential of these organisms to respire organic carbon.”
The research was funded by the National Science Foundation (C-DEBI award OCE0939564, MCB0604014, 1207880 and 1207874) and the NASA Astrobiology Institute.
Reference:
Alberto Robador, Sean P. Jungbluth, Douglas E. LaRowe, Robert M. Bowers, Michael S. Rappé, Jan P. Amend, James P. Cowen. Activity and phylogenetic diversity of sulfate-reducing microorganisms in low-temperature subsurface fluids within the upper oceanic crust. Frontiers in Microbiology, 2015; 5 DOI: 10.3389/fmicb.2014.00748
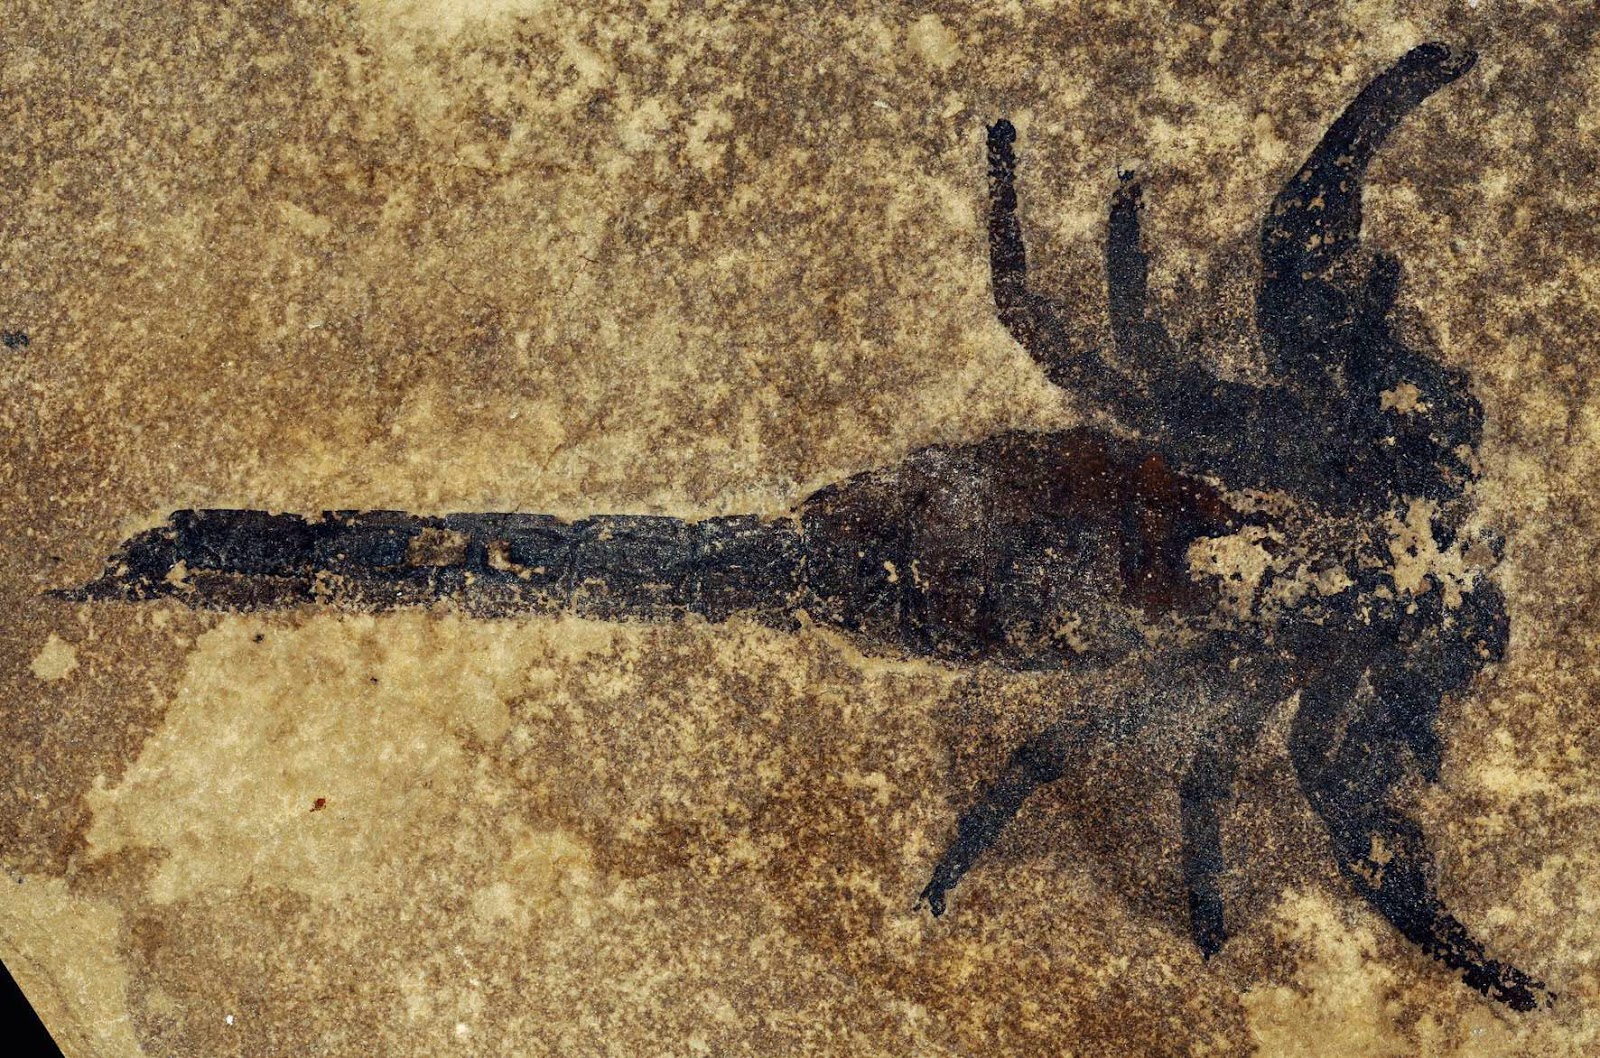
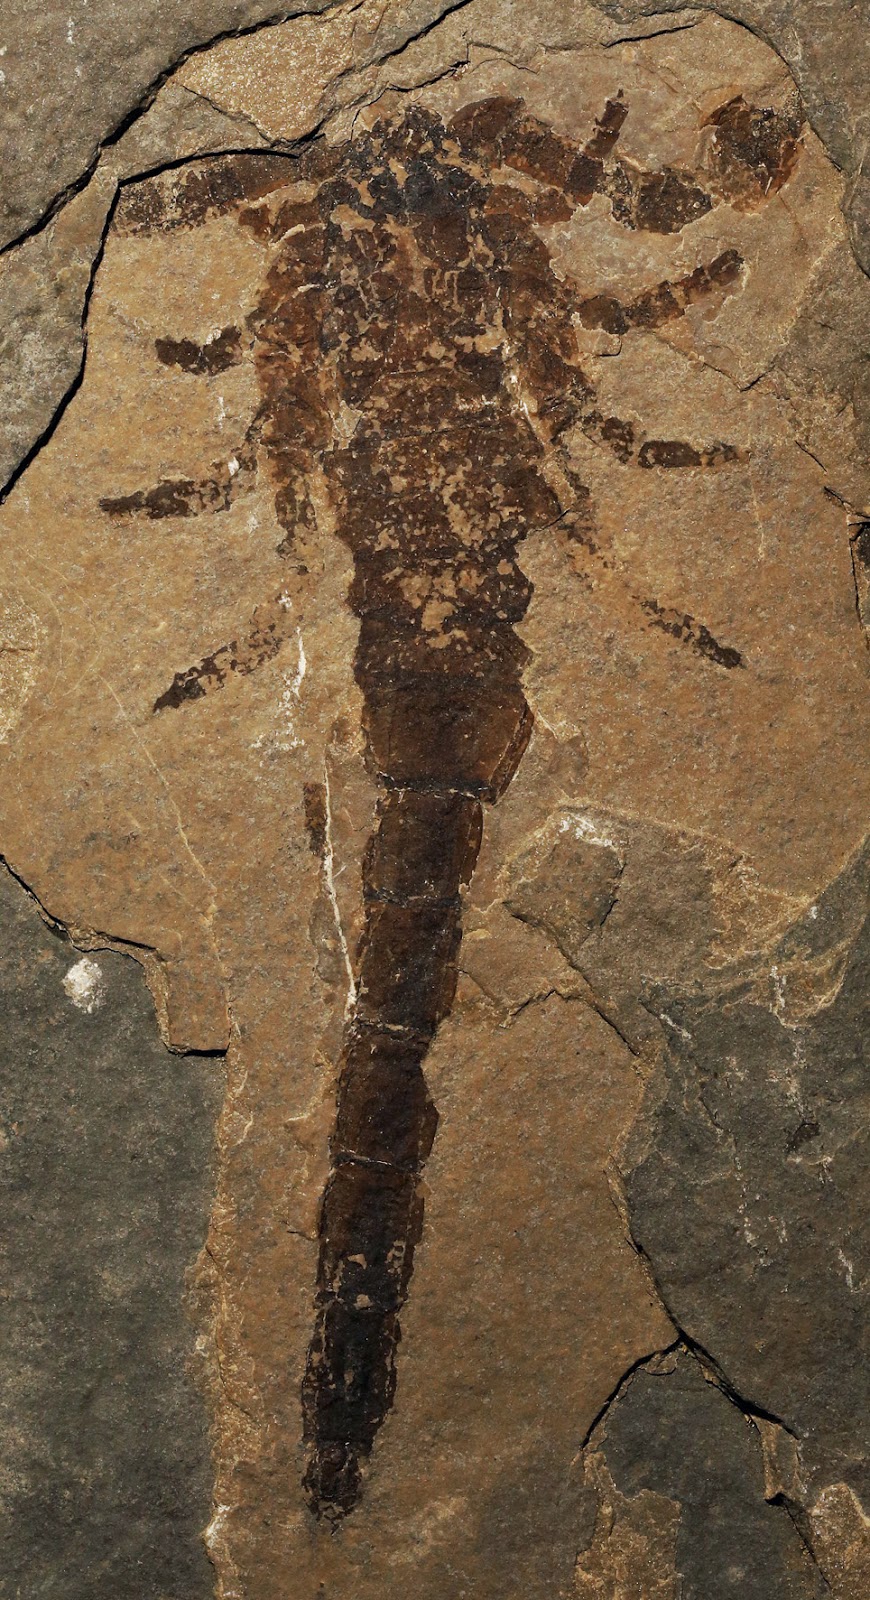
Palaeontology Departmental Associate, Janet Waddington shows us a Silurian Scorpion specimen found in Ontario and explains a recent discovery that allows us to suggest these creatures lived in the sea but also walked on land!
New research on extraordinarily complete and well-preserved fossil aquatic scorpions from the 430 million year old Eramosa Formation Konservat-Lagerstätte in Ontario demonstrates that a key prerequisite for living on land – the ability to walk unsupported by water – appeared surprisingly early in the fossil record. The findings, co-authored by the ROM’s Janet Waddington and David Rudkin, and the Museum für Naturkunde’s Jason Dunlop, will be published online 14 January 2015 GMT/Tuesday 13 January EST in the Royal Society journal Biology Letters.
Assigned to the species Eramoscorpius brucensis, these new Ontario specimens are the oldest known scorpions from North America and among the oldest in the world. Their legs, intriguingly similar to those of a modern scorpion, end in a short foot that could have been placed flat on the ground, providing a weight-bearing surface which, combined with the legs’ sturdy attachment to the body, would have allowed the animal to support its own weight without the buoyancy of water. The presence of other fossils of animals that lived only in the sea indicates that these new scorpions must have spent most of their time under water; however the fossils occur on rock surfaces that show ripples suggestive of brief exposure to air. The scorpions are preserved in a splayed posture suggesting that they represent empty moulted exoskeletons rather than carcasses of an animal that died. A possible explanation is that the scorpions took advantage of this leg structure to venture briefly into a temporarily exposed area in order to moult, where they would be safe from predators such as large eurypterids and cephalopods, and then returned to deeper water.
The fossil scorpions range in size from about 29 to 165 mm long, representing several different age classes.
The specimens all originated from the Bruce Peninsula and came to the ROM in a variety of ways: one was found in a quarry spoil heap by a young fossil hunter, others were spotted by quarry workers, and several other were discovered in quarried stone delivered to landscaping projects far from their origin.
“This extraordinary find contributes to our understanding of how scorpions moved from the sea onto land,” says Janet Waddington, Departmental Associate in the ROM’s Department of Natural History. “It is the enthusiasm and generosity of amateur fossil collectors that allows us to study and publish these findings, which are vital to the ROM’s collections and research.”
Reference :
A new mid-Silurian aquatic scorpion—one step closer to land? Biology Letters, Published 14 January 2015. DOI: 10.1098/rsbl.2014.0815
Rocks of the Ujaraaluk unit of the Nuvvuagittuq Greenstone Belt. Credit: Boswell Wing, McGill University
Chemical analysis of some of the world’s oldest rocks, by an international team led by McGill University researchers, has provided the earliest record yet of Earth’s atmosphere. The results show that the air 4 billion years ago was very similar to that more than a billion years later, when the atmosphere — though it likely would have been lethal to oxygen-dependent humans — supported a thriving microbial biosphere that ultimately gave rise to the diversity of life on Earth today.
The findings, published last week in the Proceedings of the National Academy of Sciences, could help scientists better understand how life originated and evolved on the planet. Until now, researchers have had to rely on widely varying computer models of the earliest atmosphere’s characteristics.
The new study builds on previous work by former McGill PhD student Jonathan O’Neil (now an assistant professor at Ottawa University) and McGill emeritus professor Don Francis, who reported in 2008 that rocks along the Hudson Bay coast in northern Quebec, in an area known as the Nuvvuagittuq Greenstone Belt, were deposited as sediments as many as 4.3 billion years ago — a couple of hundred million years after Earth formed.
In the new study, a team led by researchers from McGill’s Earth and Planetary Sciences Department, used mass spectrometry to measure the amounts of different isotopes of sulfur in rocks from the Nuvvuagittuq belt. The results enabled the scientists to determine that the sulfur in these rocks, which are at least 3.8 billion years old and possibly 500 million years older, had been cycled through Earth’s early atmosphere, showing the air at the time was extremely oxygen-poor compared to today, and may have had more methane and carbon dioxide.
“We found that the isotopic fingerprint of this atmospheric cycling looks just like similar fingerprints from rocks that are a billion to 2 billion years younger,” said Emilie Thomassot, a former postdoctoral researcher at McGill and lead author of the paper. Emilie Thomassot is now with the Centre de Recherches Pétrographiques et Géochimiques (CRPG) in Nancy France.
“Those younger rocks contain clear signs of microbial life and there are a couple of possible interpretations of our results,” says Boswell Wing, an associate professor at McGill and co-author of the new study. “One interpretation is that biology controlled the composition of the atmosphere on early Earth, with similar microbial biospheres producing the same atmospheric gases from Earth’s infancy to adolescence. We can’t rule out, however, the possibility that the biosphere was decoupled from the atmosphere. In this case geology could have been the major player in setting the composition of ancient air, with massive volcanic eruptions producing gases that recurrently swamped out weak biological gas production.”
The research team is now extending its work to try to tell whether the evidence supports the “biological” or the “geological” hypothesis — or some combination of both. In either case Emilie Thomassot says, the current study “demonstrates that the Nuvvuagittuq sediments record a memory of Earth’s surface environment at the very dawn of our planet. And surprisingly, this memory seems compatible with a welcoming terrestrial surface for life.” The team is now extending their investigation to early Archean sediments from other localities in Canada, such as the Labrador coast.
The research was supported by the Natural Sciences and Engineering Research Council of Canada and the Canadian Space Agency, and by France’s Lorraine region and the Centre National de la Recherche Scientifique.
Reference:
E. Thomassot, J. O’Neil, D. Francis, P. Cartigny, B. A. Wing. Atmospheric record in the Hadean Eon from multiple sulfur isotope measurements in Nuvvuagittuq Greenstone Belt (Nunavik, Quebec). Proceedings of the National Academy of Sciences, Jan. 5, 2015 DOI: 10.1073/pnas.1419681112
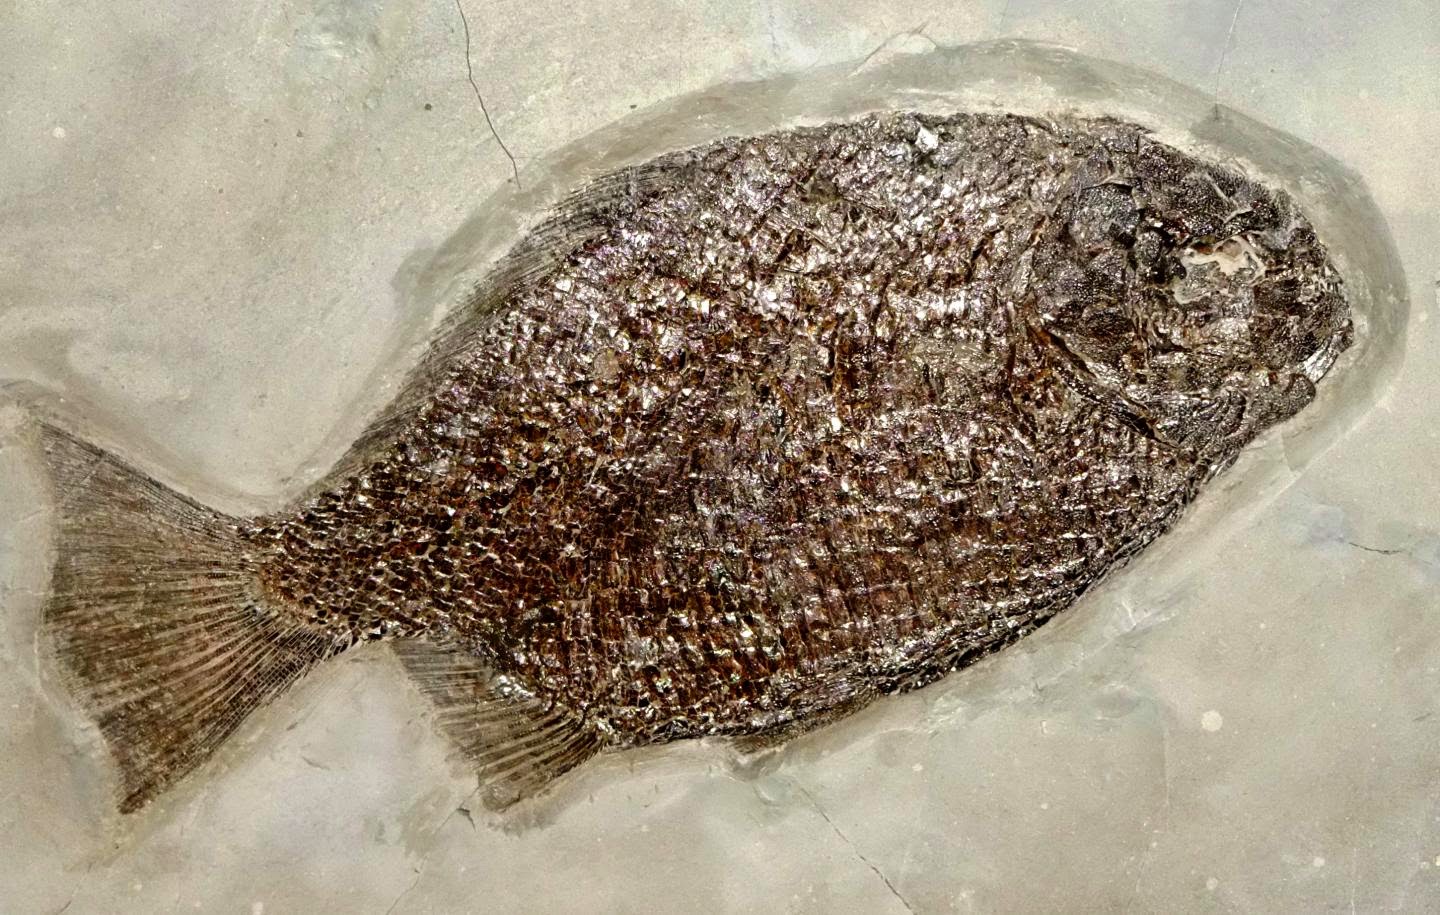
This image shows a perfectly preserved example of the Lower Jurassic fish Dapedium from Lyme Regis, Dorset. Perfectly preserved specimens such as this allow us to calculate the biomechanical function of anatomical features, thus giving us an insight into the ecologies of long extinct animals. Credit : Fiann Smithwick
The feeding habits of an unusual 200-million-year-old fish have been uncovered by a University of Bristol undergraduate in a groundbreaking study which has been published in Palaeontology, a leading scientific journal, this week – a rare achievement for an undergraduate student.
The Jurassic fish, Dapedium, known from the Lower Lias rocks of the Dorset coast around Lyme Regis, was one of many new groups of fishes that came on the scene 200 million years ago. These included ancestors of the modern teleost fishes – the group of 30,000 species of salmon, cod, seahorses, and perch – that dominate the waters today.
This distinctive fish was also one of a number of ancient animals first discovered by the pioneering nineteenth century fossil collector Mary Anning, and fascinated early palaeontologists such as Henry De la Beche and Louis Agassiz.
Dapedium was a deep-bodied fish, shaped like a dinner plate in side view, which could grow to over half a metre in length. It had a tiny mouth with jutting front teeth and masses of pebble-shaped teeth further back.
In his research, Bristol undergraduate Fiann Smithwick applied a new lever-based mechanical model, developed to understand the jaw mechanics of modern fishes, to reconstruct the feeding behaviour of this extraordinary ancient fish.
“My work indicates that Dapedium was well adapted to crush shells,” said Fiann, “feeding on bivalves and other hard-shelled creatures that it could scrape from the sea floor.”
He examined 89 specimens of Dapedium in the Natural History Museum, Bristol City Museum, and the Philpot Museum in Lyme Regis, and measured the positions and lengths of the jaw bones. He calculated the positions and orientations of jaw muscles and varied these to include all possible models.
“Every time he ran the model, the result was the same,” explained Professor Mike Benton, Fiann’s supervisor. “The outputs showed that Dapedium was a shell crusher. Its jaws moved slowly, but strongly, and so it could work on the hard shells of its prey. Other fishes have fast-moving, but weaker jaws, and those are adapted for feeding on speedy, slippery fish prey.”
In comparisons with modern fishes, Dapedium matches closely the modern sea breams. These fishes are also flat-sided and deep-bodied, and they crush shells in their small mouths, armed with blunt-topped teeth.
Dapedium lived side-by-side with the great sea reptiles of the Jurassic, such as the dolphin-shaped ichthyosaurs, long-necked plesiosaurs, and even some marine crocodilians. Dapedium probably escaped being caught by these reptiles because it was so thin-bodied it might be hard to see head-on, and it probably lurked close to reefs and the seabed.
“We are delighted to see such an excellent piece of work carried out by an undergraduate,” said Professor Benton. “Fiann was funded by a Summer Research Bursary from the Palaeontological Association, and he devised the project himself, learned the numerical techniques, and wrote it up himself. It’s rare for an undergraduate to be able to do all this and pass the scrutiny of one of the world’s leading scientific journals.”
Reference :
‘Feeding ecology of the deep-bodied fish Dapedium (Actinopterygii Neopterygii)) from the Sinemurian of Dorset, England’ by Smithwick, F. M. in Palaeontology, published online ahead of print (doi: 10.1111/pala.12145).
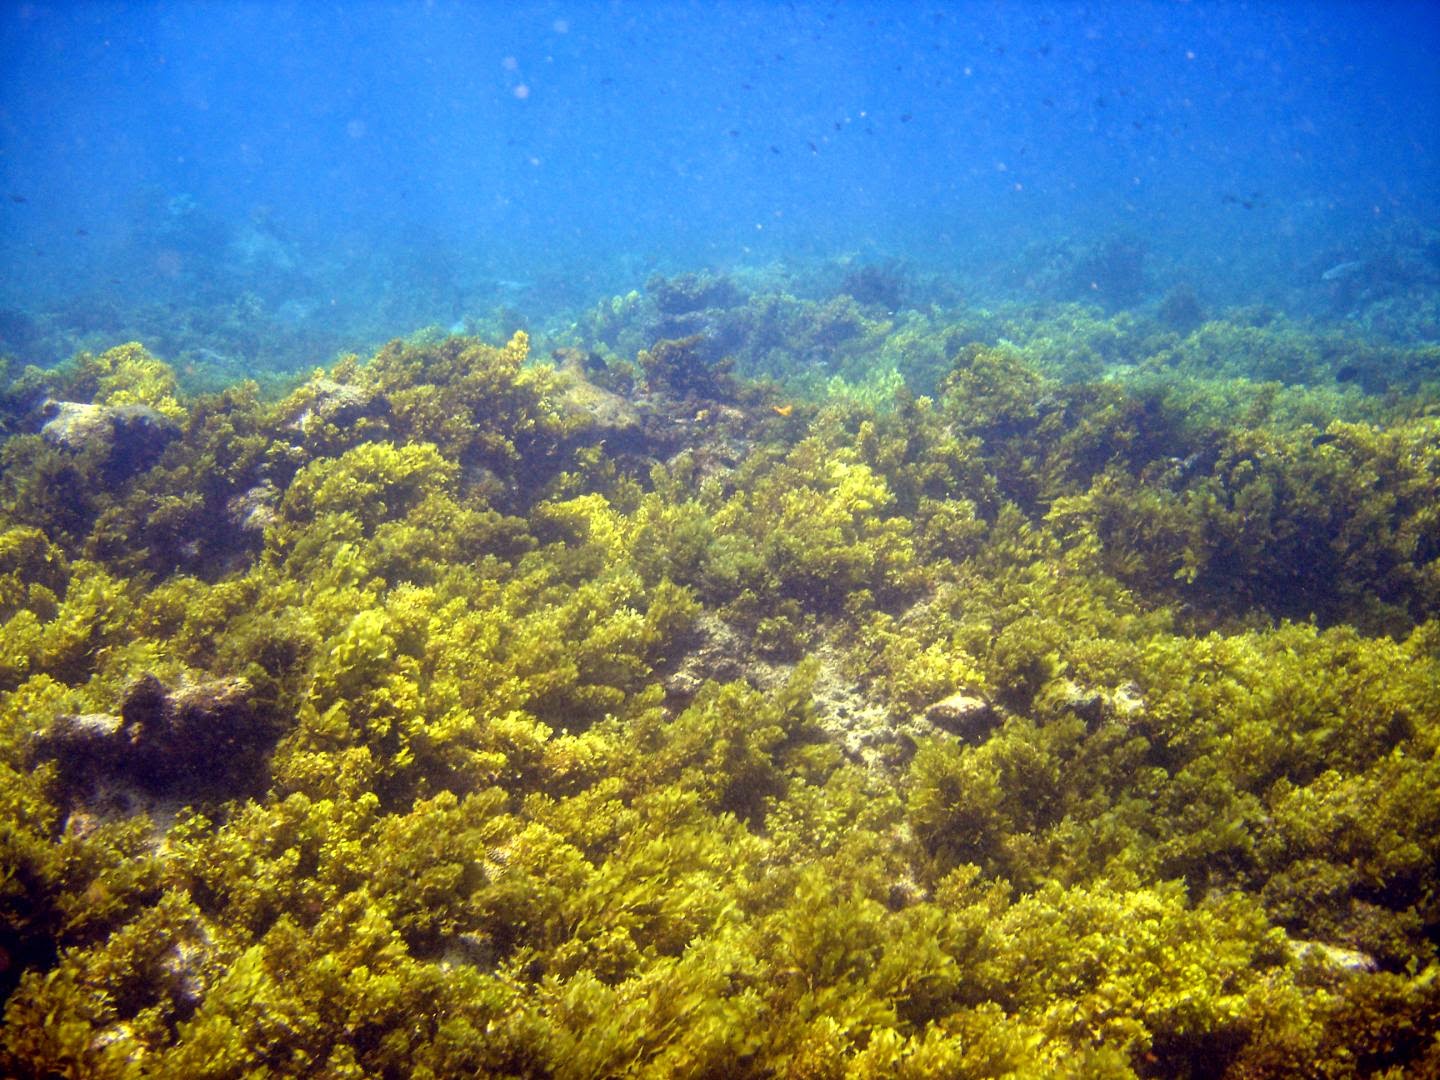
This is a macroalgae dominated reef in the Seychelles. Credit Image: Nicholas Graham
Researchers examining the impact of climate change on coral reefs have found a way to predict which reefs are likely to recover following bleaching episodes and which won’t.
Coral bleaching is the most immediate threat to reefs from climate change; it’s caused when ocean temperatures become warmer than normal maximum summer temperatures, and can lead to widespread coral death.
A key unanswered question has been what dictates whether reefs can bounce back after such events, or if they become permanently degraded.
An international team of scientists found that five factors could predict if a reef was likely to recover after a bleaching event.
“Water depth, the physical structure of the reef before disturbance, nutrient levels, the amount of grazing by fish and survival of juvenile corals could help predict reef recovery,”says study lead author, Dr Nicholas Graham from the ARC Centre of Excellence for Coral Reef Studies at James Cook University in Australia.
“Remarkably, the two most easily measured variables, water depth and the physical structure of the reef before disturbance, predicted recovery with 98% confidence,” Dr Graham says.
As part of the research, published in the journal Nature, researchers from Australia, the United Kingdom and France examined nearly 20 years of coral reef data gathered from the Seychelles.
Data was collected before and after an unprecedented coral bleaching event in 1998, in which 90 per cent of the country’s corals across 21 reefs were lost.
Of the reefs affected by the episode, twelve recovered while nine did not. The event had a significant impact on the biodiversity of local fish populations, which changed substantially when reefs did not recover.
From their data the researchers identified thresholds for the factors that dictated whether reefs would recover.
“Putting numbers on the threshold points at which reefs either recover or degrade helps predict reef futures under climate change,” Dr Graham says.
Study co-author, Dr Shaun Wilson from the Department of Parks and Wildlife, Western Australia adds that the findings are important for predicting reef futures under climate change.
“The beauty of this study is that easily acquired measures of reef complexity and depth provide a means of predicting long term consequences of ocean warming events,” Dr Wilson says.
“The ability to predict which reefs have the capacity to recover is really important for mapping of winners and losers, and risk analysis”
Co-author Dr Aaron MacNeil from the Australian Institute of Marine Science says the insights can be applied to studies and management aimed at improving the outlook of coral reefs around the world.
“This gives reef management a major boost in the face of the threats posed by climate change and, encouragingly, suggests people can take tangible steps to improve the outlook for reefs,” Dr MacNeil says.
“By carefully managing reefs with conditions that are more likely to recover from climate-induced bleaching, we give them the best possible chance of surviving over the long term, while reduction of local pressures that damage corals and diminish water quality will help to increase the proportion of reefs that can bounce back.”
Reference:
The paper, Predicting climate-driven regime shifts versus rebound potential in coral reefs by Nicholas AJ Graham, Simon Jennings, M Aaron MacNeil, David Mouillot and Shaun K Wilson is published in the journal Nature. Doi:10.1038/nature14140
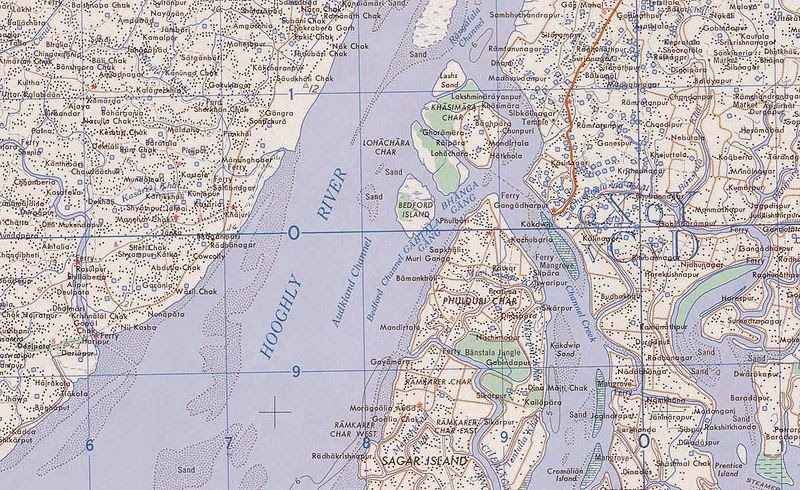
The Hooghly River or the Bhāgirathi-Hooghly, called ‘Ganga’ traditionally, is an approximately 260 kilometres (160 mi) long distributary of the Ganges River in West Bengal, India. It splits from the Ganges as a canal in Murshidabad District at the Farakka Barrage. The town of Hugli-Chinsura, formerly Hooghly, is located on the river, in the Hooghly (district). The origins of the Hooghly name are uncertain, whether the city or the river was named first.
Course
The Farakka Barrage is a dam that diverts water from the Ganges into a canal near the town of Tildanga in Malda district. This supplies the Hooghly with adequate water even in the dry season. It parallels the Ganges, past Dhulian, until just above Jahangirpur where the canal ends and the river takes its own course. Just south of Jahangirpur it leaves the Ganges area and flows south past Jiaganj Azimganj, Murshidabad, and Baharampur. South of Baharampur and north of Palashi it used to form the border between Bardhaman District and Nadia District, but while the border has remained the same the river is now often east or west of its former bed. The river then flows south past Katwa, Navadwip and Kalna. At Kalna it originally formed the border between Nadia District and Hooghly District, and then further south between Hooghly District and North 24 Parganas District. It flows past Halisahar, Chunchura, Konnagar, and Kamarhati. Then just before entering the twin cities of Kolkata (Calcutta) and Howrah, it turns to the southwest. At Nurpur it enters an old channel of the Ganges and turns south to empty into the Bay of Bengal. Two of its well known tributaries are Damodar and Rupnarayan.
Harvest fields of Bengal
The scenery along the banks of the Hooghly varies considerably. From the sea nothing but sandbanks and mud formations covered with coarse herbage at first greet the eye, then as the river narrows, cultivated rice fields and sleepy hamlets reposing within the foliage of beautiful groves, render the view at once pleasing and picturesque.
Note : The above story is based on materials provided by Wikipedia.
The Colima volcano, also known as the ‘Fire Volcano,’ has erupted, shooting columns of ash and smoke nearly 5,000 feet into the air over western Mexico. (Jan. 13)
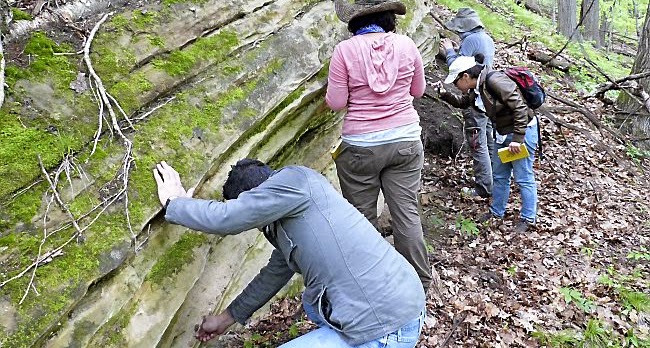
With support from the NASA Astrobiology Program, Cavosie brought students from the University of Puerto Rico to study outcrops at the Rock Elm meteorite impact structure. Reidite was found in the samples they collected. Credit: Aaron Cavosie
Scientists have discovered one of the rarest minerals on Earth in a Wisconsin impact crater.
Aaron Cavosie of the University of Puerto Rico, and member of the NASA Astrobiology Institute Team at the University of Wisconsin, brought students to an impact site in Rock Elm, Wisconsin to collect samples. In those samples, Cavosie and colleagues discovered the mineral reidite, making Rock Elm the fourth site on Earth where the mineral has been found in nature.
Reidite is created at high pressures and was first identified in the laboratory in the 1960s. The conditions in which reidite forms have been well-constrained by experiments in the lab but, prior to Rock Elm, it was only found naturally in the Chesapeake Bay Impact Structure (Virginia), the Ries Crater (Germany), and the Xiuyan Crater (China).
The Rock Elm structure is 6.5 kilometers in diameter and was formed during the Middle Ordovician. This means that the reidite found at Rock Elm is at least 450 million years old, making it the oldest preserved reidite yet discovered.
Another important aspect of the research is that the reidite was found in sandstone – the first time the mineral was spotted in this type of rock. There are many other impact structures that have been formed in sandstone, and its possible that a re-examination of these sites could reveal more reidite.
“I get the sense that, because reidite had never been found in this kind of rock, if something’s never found there, your not going to go look for it purposefully,” said Cavosie in an interview with Wisconsin Public Radio. “Now that we’ve identified this recorder of even far more extreme impact conditions than what was known previously at Rock Elm, that tool can be applied to many, many other localities to try to recreate the impact conditions and better understand the effects on the surface environments of some of these impacts.”
Wisconsin Public Radio produced an interview with Aaron Cavosie and Bill Cordua of UW-River Falls, who discovered the Rock Elm disturbance. To listen to the show, visit: http://www.wpr.org/listen/682916
The initial findings were presented at the 2014 GSA Annual Meeting in Vancouver.
Video
Note : The above story is based on materials provided by Astrobio.net This story is republished courtesy of NASA’s Astrobiology Magazine. Explore the Earth and beyond at www.astrobio.net .
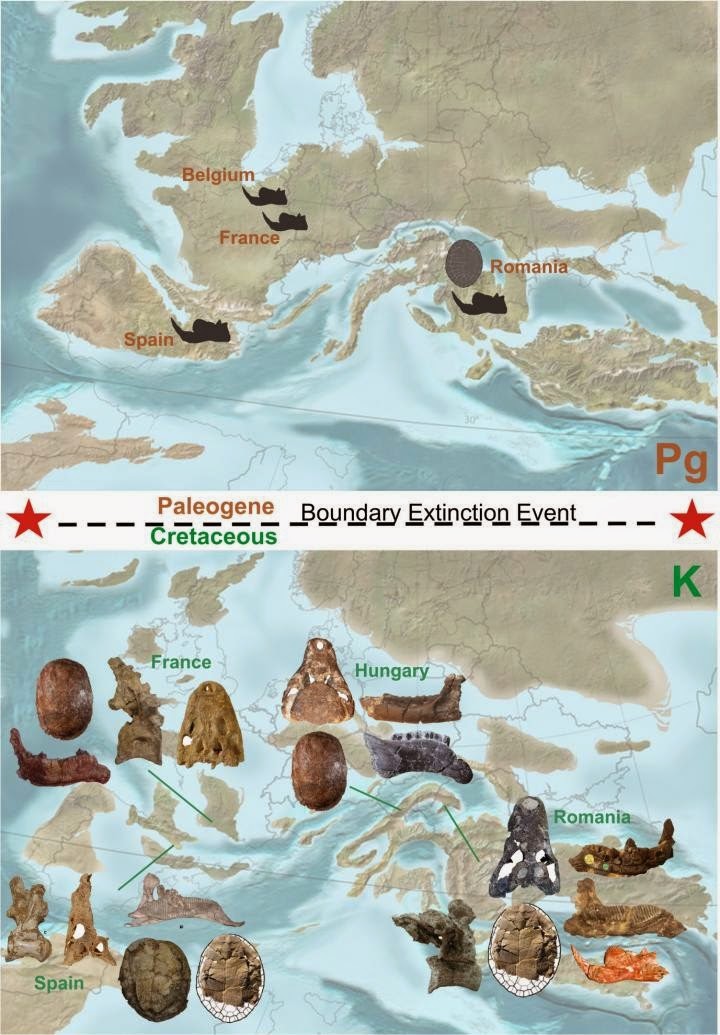
This is a visual representation of the evolution of the European continental ecosystems across the Cretaceous-Paleogene Boundary Extinction Event: the diverse vertebrate assemblages of the latest Cretaceous, with dinosaurs, crocodiles, turtles and mammals (bottom image; see ZooKeys review of Csiki-Sava et al., doi: 10.3897/zookeys.469.8439 for the identity of the different taxa represented), were wiped almost completely, with only a few groups (here epitomized by certain mammals and turtles) surviving into the Paleogene (top image). The backgrounds show more or less accurate reconstructions of the European paleogeography during the latest Cretaceous (bottom; K), respectively the Paleogene (top; Pg). Credit: Background paleogeography reconstructions – Dr. Ron Blakey, Professor Emeritus Northern Arizona University; fossils: Dr. Jeremy E. Martin / CC-BY 4.0
Dinosaurs flourished in Europe right up until the asteroid impact that wiped them out 66 million years ago, a new study shows.
The theory that an asteroid rapidly killed off the dinosaurs is widely recognized, but until recently dinosaur fossils from the latest Cretaceous–the final stanza of dinosaur evolution–were known almost exclusively from North America. This has raised questions about whether the sudden decline of dinosaurs in the American and Canadian west was merely a local story.
The new study synthesizes a flurry of research on European dinosaurs over the past two decades. Fossils of latest Cretaceous dinosaurs are now commonly discovered in Spain, France, Romania, and other countries.
By looking at the variety and ages of these fossils, a team of researchers led by Zoltán Csiki-Sava of the University of Bucharest’s Faculty of Geology and Geophysics has determined that dinosaurs remained diverse in European ecosystems very late into the Cretaceous.
In the Pyrenees of Spain and France, the best area in Europe for finding latest Cretaceous dinosaurs, meat and plant-eating species are present and seemingly flourishing during the final few hundred thousand years before the asteroid hit.
Dr Csiki-Sava said “For a long time, Europe was overshadowed by other continents when the understanding of the nature, composition and evolution of latest Cretaceous continental ecosystems was concerned. The last 25 years witnessed a huge effort across all Europe to improve our knowledge, and now we are on the brink of fathoming the significance of these new discoveries, and of the strange and new story they tell about life at the end of the Dinosaur Era.”
Dr Steve Brusatte of the University of Edinburgh’s School of GeoSciences (UK), an author on the report, added: “Everyone knows that an asteroid hit 66 million years ago and dinosaurs disappeared, but this story is mostly based on fossils from one part of the world, North America. We now know that European dinosaurs were thriving up to the asteroid impact, just like in North America. This is strong evidence that the asteroid really did kill off dinosaurs in their prime, all over the world at once.”
The new study is published in the open access journal ZooKeys. It reviews the fossil record of Late Cretaceous land-living vertebrates (including dinosaurs) from Europe and provides the most up-to-date survey of how these animals were changing in the run up to the asteroid impact.
Reference:
Zoltan Csiki-Sava, Eric Buffetaut, Attila Ősi, Xabier Pereda-Suberbiola, Stephen L. Brusatte. Island life in the Cretaceous – faunal composition, biogeography, evolution, and extinction of land-living vertebrates on the Late Cretaceous European archipelago. ZooKeys, 2015; 469: 1 DOI: 10.3897/zookeys.469.8439
Note : The above story is based on materials provided by Pensoft Publishers. The original story is licensed under a Creative Commons License.
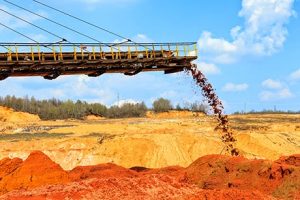
A global “gold rush” has led to a significant increase of deforestation in the tropical forests of South America.
This is according to new research publish today, 14 January, in IOP Publishing’s journal Environmental Research Letters, which has highlighted the growing environmental impact of gold mining in some of the most biologically diverse regions in the tropics.
Researchers from the University of Puerto Rico have shown that between 2001 and 2013, around 1680 km2 of tropical forest was lost in South America as a result of gold mining, which increased from around 377 km2 to 1303km2 since the global economic crisis in 2007.
Furthermore, around 90 per cent of this forest loss occurred in just four areas and a large proportion occurred within the vicinity of conservation areas.
Lead author of the research Nora L. Álvarez-Berríos said: “Although the loss of forest due to mining is smaller in extent compared to deforestation caused by other land uses, such as agriculture or grazing areas, deforestation due to mining is occurring in some of the most biologically diverse regions in the tropics. For example, in the Madre de Dios Region in Perú, one hectare of forest can hold up to 300 species of trees.”
Driven by personal consumption and uncertainty in global financial markets, global gold production has increased to meet rising demand, increasing from around 2445 metric tons in 2000 to around 2770 metric tons in 2013.
Increased demand for gold has been paralleled by a dramatic increase in price — the price of gold increased from $250/ounce in 2000 to $1300/ounce in 2013.
This has stimulated new gold mining activities around the world and made it feasible to mine for gold in areas that were not previously profitable for mining, such as deposits underneath tropical forests.
This can lead to extensive forest loss and result in serious environmental and ecological impacts, caused by the removal of vegetation, the set-up of roads and railways for access and the creation of unorganised settlements.
Some of the long-term impacts include the failure of vegetation to regrow, changing of rainfall patterns, the permanent loss of biodiversity, and a release of CO2 into the atmosphere.
In their study, the researchers sought to quantify the impacts of gold mines in tropical forests by creating a geographical database that highlighted the location of newly developed mines between 2000 and 2013.
The database was then cross-referenced with annual land cover maps showing the change of forest cover over the same period.
The study encompassed the tropical and subtropical forest biome in South America below 1000 m, covering Colombia, Venezuela, Guyana, Suriname, French Guiana, Brazil, Ecuador, Peru, and Bolivia.
Results showed that over the 13 year period, 89 per cent of forest loss occurred in just four regions: the Guianan moist forest ecoregion; the Southwest Amazon moist forest ecoregion; the Tapajós-Xingú moist forest ecoregion; and The Magdalena Valley-Urabá region.
Although there was little deforestation inside strict protection areas, around a third of the total deforestation occurred within a 10-km buffer zone around these areas and thus made the areas susceptible to harmful impacts from chemical pollutants that are dispersed from a mining area.
“To decrease the amount of deforestation that is occurring as a result of gold mining in the tropical forests, it is important that awareness is raised among gold consumers to understand the environmental and social impacts of buying gold jewellery or investing in gold.
“It is important to also encourage more responsible ways of extracting gold by helping miners to extract in a more efficient way to reduce deeper encroachment into the forests,” continued Álvarez-Berríos.
Reference:
Nora L Alvarez-Berríos, T Mitchell Aide. Global demand for gold is another threat for tropical forests. Environmental Research Letters, 2015; 10 (1): 014006 DOI: 10.1088/1748-9326/10/1/014006
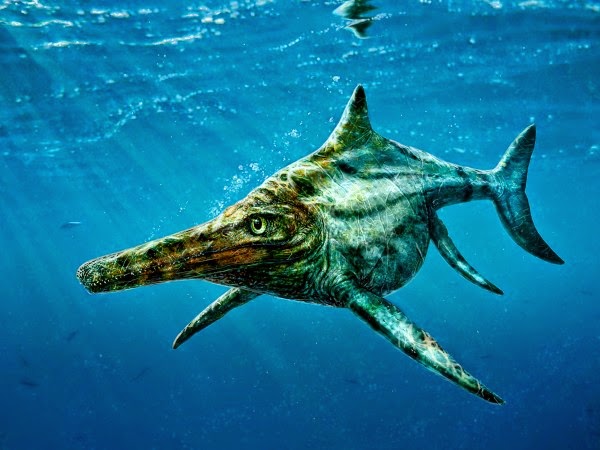
A new species of marine reptile from the Jurassic era has been identified from fossils found on the Isle of Skye.
The dolphin-like creatures were as long as 14 feet from snout to tail, and inhabited warm, shallow seas around Scotland some 170 million years ago, researchers say.
They were near the top of the food chain at the time and preyed on fish and other reptiles.
Expert team
A team of palaeontologists – led by the University and including many Scottish institutions – studied fossil fragments of skulls, teeth, vertebrae and an upper arm bone unearthed on the island over the past 50 years.
They identified several examples of extinct aquatic animals – known as ichthyosaurs – which lived during the Early-to-Middle Jurassic, including the entirely new species.
The team is the largest collaborative group of palaeontologists working in Scotland.
Their analysis of the fossil collection is the first study of ichthyosaurs found in Scotland, and many of the specimens studied have been donated to museums by amateur collectors.
Donated fossils
“During the time of dinosaurs, the waters of Scotland were prowled by big reptiles the size of motor boats. Their fossils are very rare, and only now, for the first time we’ve found a new species that was uniquely Scottish,” says Dr Steve Brusatte of the School of GeoSciences. “Without the generosity of the collector who donated the bones to a museum instead of keeping them or selling them, we would have never known that this amazing animal existed.”
The new species – Dearcmhara shawcrossi – is named in honour of an amateur enthusiast, Brian Shawcross, who recovered the creature’s fossils from the island’s Bearreraig Bay in 1959.
Dearcmhara – pronounced ‘jark vara’ – is Scottish Gaelic for marine lizard, and pays homage to the history of Skye and the Hebrides.
The species is one of the few to have ever been given a Gaelic name.
Landmass shift
During the Jurassic Period, much of Skye was under water.
At the time, it was joined to the rest of the UK and was part of a large island positioned between landmasses that gradually drifted apart and became Europe and North America.
Skye is one of the few places in the world where fossils from the Middle Jurassic Period can be found.
The team say discoveries made there could provide valuable insights into how marine reptiles evolved.
The study is published in the Scottish Journal of Geology.
“During the time of dinosaurs, the waters of Scotland were prowled by big reptiles the size of motor boats. Their fossils are very rare, and only now, for the first time we’ve found a new species that was uniquely Scottish,” says Dr Brusatte.
“Not only is this a very special discovery, but it also marks the beginning of a major new collaboration involving some of the most eminent palaeontologists in Scotland … We are excited by the programme of work and are already working on additional new finds. This is a rich heritage for Scotland,” adds Dr Nick Fraser National Museums Scotland.
Reference:
“Ichthyosaurs from the Jurassic of Skye, Scotland.” Scottish Journal of Geology, first published on January 11, 2015, DOI: 10.1144/sjg2014-018
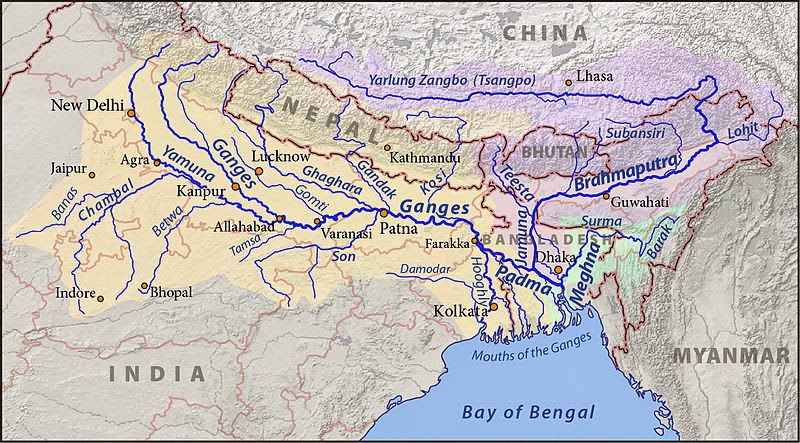
This is a map of the Ganges (yellow), Brahmaputra (violet), and Meghna (green) drainage basins. Created with ArcExplorer and Adobe Illustrator, based on Natural Earth data.
The Ganges, also Ganga is a trans-boundary river of Asia which flows through India and Bangladesh. The 2,525 km (1,569 mi) river rises in the western Himalayas in the Indian state of Uttarakhand, and flows south and east through the Gangetic Plain of North India into Bangladesh, where it empties into the Bay of Bengal. It is the third largest river by discharge.
The Ganges is the most sacred river to Hindus. It is also a lifeline to millions of Indians who live along its course and depend on it for their daily needs. It is worshipped as the goddess Ganga in Hinduism. It has also been important historically, with many former provincial or imperial capitals (such as Pataliputra, Kannauj, Kara, Kashi, Allahabad, Murshidabad, Munger, Baharampur, Kampilya, and Kolkata) located on its banks.
The Ganges was ranked as the fifth most polluted river of the world in 2007. Pollution threatens not only humans, but also more than 140 fish species, 90 amphibian species and the endangered Ganges river dolphin. The Ganga Action Plan, an environmental initiative to clean up the river, has been a major failure thus far, due to corruption, lack of technical expertise, poor environmental planning, and lack of support from religious authorities.
Course
The Ganges begins at the confluence of the Bhagirathi and Alaknanda rivers at Devprayag. The Bhagirathi is considered to be the true source in Hindu culture and mythology, although the Alaknanda is longer The headwaters of the Alakananda are formed by snowmelt from such peaks as Nanda Devi, Trisul, and Kamet. The Bhagirathi rises at the foot of Gangotri Glacier, at Gaumukh, at an elevation of 3,892 m (12,769 ft).
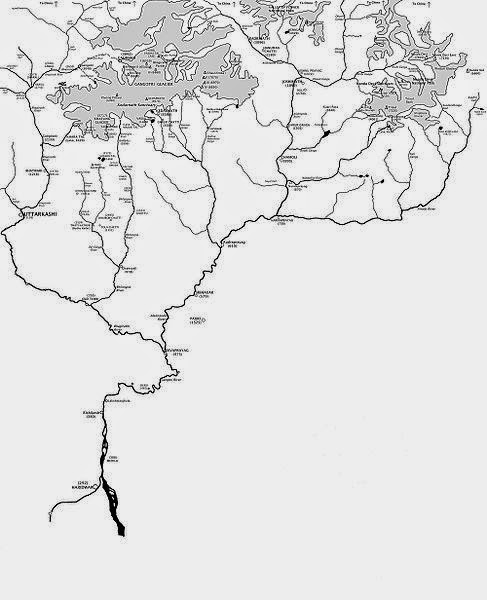
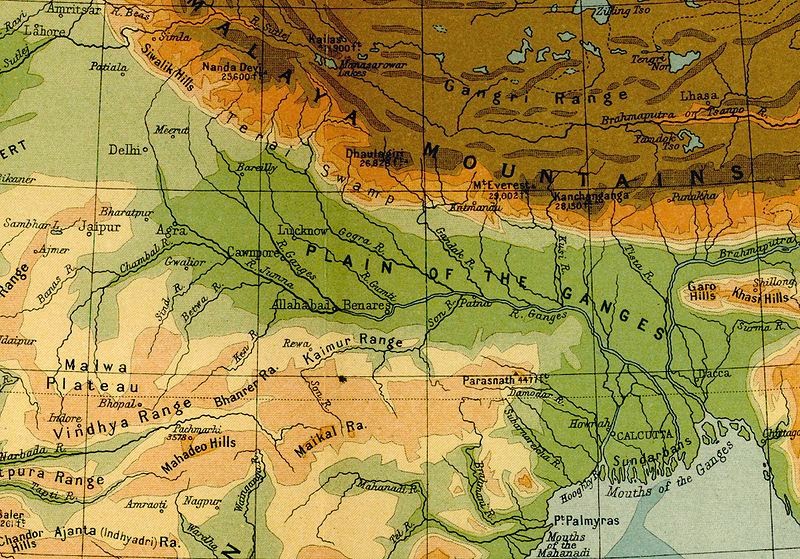
The Himalayan headwaters of the Ganges river in the Garhwal region of Uttarakhand, India. The headstreams and rivers are labeled in italics; the heights of the mountains, lakes, and towns are displayed in parentheses in metres.
Although many small streams comprise the headwaters of the Ganges, the six longest and their five confluences are considered sacred. The six headstreams are the Alaknanda, Dhauliganga, Nandakini, Pindar, Mandakini, and Bhagirathi rivers. The five confluences, known as the Panch Prayag, are all along the Alaknanda. They are, in downstream order: Vishnuprayag, where the Dhauliganga joins the Alaknanda; Nandprayag, where the Nandakini joins; Karnaprayag, where the Pindar joins; Rudraprayag, where the Mandakini joins; and, finally, Devprayag, where the Bhagirathi joins the Alaknanda to form the Ganges River proper.
After flowing 250 kilometres (160 mi) through its narrow Himalayan valley, the Ganges emerges from the mountains at Rishikesh, then debouches onto the Gangetic Plain at the pilgrimage town of Haridwar. At Haridwar, a dam diverts some of its waters into the Ganges Canal, which irrigates the Doab region of Uttar Pradesh, whereas the river, whose course has been roughly southwest until this point, now begins to flow southeast through the plains of northern India.
The Ganges follows an 800-kilometre (500 mi) arching course passing through the cities of Kannauj, Farukhabad, and Kanpur. Along the way it is joined by the Ramganga, which contributes an average annual flow of about 500 m3/s (18,000 cu ft/s). The Ganges joins the Yamuna at the Triveni Sangam at Allahabad, a holy confluence in Hinduism. At their confluence the Yamuna is larger than the Ganges, contributing about 2,950 m3/s (104,000 cu ft/s), or about 58.5% of the combined flow.
Now flowing east, the river meets the Tamsa River (also called Tons), which flows north from the Kaimur Range and contributes an average flow of about 190 m3/s (6,700 cu ft/s). After the Tamsa the Gomti River joins, flowing south from the Himalayas. The Gomti contributes an average annual flow of about 234 m3/s (8,300 cu ft/s). Then the Ghaghara River(Karnali River), also flowing south from the Himalayas of Nepal, joins. The Ghaghara(Karnali), with its average annual flow of about 2,990 m3/s (106,000 cu ft/s), is the largest tributary of the Ganges. After the Ghaghara(Karnali) confluence the Ganges is joined from the south by the Son River, contributing about 1,000 m3/s (35,000 cu ft/s). The Gandaki River, then the Kosi River, join from the north flowing from Nepal, contributing about 1,654 m3/s (58,400 cu ft/s) and 2,166 m3/s (76,500 cu ft/s), respectively. The Kosi is the third largest tributary of the Ganges, after the Ghaghara(Karnali) and Yamuna.
Along the way between Allahabad and Malda, West Bengal, the Ganges passes the towns of Chunar, Mirzapur, Varanasi, Ghazipur, Patna, Bhagalpur, Ballia, Buxar, Simaria, Sultanganj, and Saidpur. At Bhagalpur, the river begins to flow south-southeast and at Pakur, it begins its attrition with the branching away of its first distributary, the Bhāgirathi-Hooghly, which goes on to become the Hooghly River. Just before the border with Bangladesh the Farakka Barrage controls the flow of the Ganges, diverting some of the water into a feeder canal linked to the Hooghly for the purpose of keeping it relatively silt-free. The Hooghly River is formed by the confluence of the Bhagirathi River and Jalangi River at Nabadwip, and Hooghly has a number of tributaries of its own. The largest is the Damodar River, which is 541 km (336 mi) long, with a drainage basin of 25,820 km2 (9,970 sq mi). The Hooghly River empties into the Bay of Bengal near Sagar Island. Between Malda and the Bay of Bengal, the Hooghly river passes the towns and cities of Murshidabad, Nabadwip, Kolkata and Howrah.
After entering Bangladesh, the main branch of the Ganges is known as the Padma. The Padma is joined by the Jamuna River, the largest distributary of the Brahmaputra. Further downstream, the Padma joins the Meghna River, the second largest distributary of the Brahmaputra, and takes on the Meghna’s name as it enters the Meghna Estuary, which empties into the Bay of Bengal.
The Ganges Delta, formed mainly by the large, sediment-laden flows of the Ganges and Brahmaputra rivers, is the world’s largest delta, at about 59,000 km2 (23,000 sq mi). It stretches 322 km (200 mi) along the Bay of Bengal.
Only the Amazon and Congo rivers have a greater average discharge than the combined flow of the Ganges, the Brahmaputra, and the Surma-Meghna river system. In full flood only the Amazon is larger
Geology
The Indian subcontinent lies atop the Indian tectonic plate, a minor plate within the Indo-Australian Plate. Its defining geological processes commenced seventy-five million years ago, when, as a part of the southern supercontinent Gondwana, it began a northeastwards drift—lasting fifty million years—across the then unformed Indian Ocean. The subcontinent’s subsequent collision with the Eurasian Plate and subduction under it, gave rise to the Himalayas, the planet’s highest mountains. In the former seabed immediately south of the emerging Himalayas, plate movement created a vast trough, which, having gradually been filled with sediment borne by the Indus and its tributaries and the Ganges and its tributaries, now forms the Indo-Gangetic Plain.
The Indo-Gangetic Plain is geologically known as a foredeep or foreland basin.
Hydrology
The hydrology of the Ganges River is very complicated, especially in the Ganges Delta region. One result is different ways to determine the river’s length, its discharge, and the size of its drainage basin.
The name Ganges is used for the river between the confluence of the Bhagirathi and Alaknanda rivers, in the Himalayas, and the India-Bangladesh border, near the Farakka Barrage and the first bifurcation of the river. The length of the Ganges is frequently said to be slightly over 2,500 km (1,600 mi) long, about 2,505 km (1,557 mi), to 2,525 km (1,569 mi), or perhaps 2,550 km (1,580 mi). In these cases the river’s source is usually assumed to be the source of the Bhagirathi River, Gangotri Glacier at Gomukh, and its mouth being the mouth of the Meghna River on the Bay of Bengal. Sometimes the source of the Ganges is considered to be at Haridwar, where its Himalayan headwater streams debouch onto the Gangetic Plain.
In some cases, the length of the Ganges is given for its Hooghly River distributary, which is longer than its main outlet via the Meghna River, resulting in a total length of about 2,620 km (1,630 mi), from the source of the Bhagirathi, or 2,135 km (1,327 mi), from Haridwar to the Hooghly’s mouth. In other cases the length is said to be about 2,240 km (1,390 mi), from the source of the Bhagirathi to the Bangladesh border, where its name changes to Padma.
A 1908 map showing the course of the Ganges and its tributaries. Major left-bank tributaries include Gomti (Gumti), Ghaghara (Gogra), Gandaki (Gandak), and Kosi (Kusi); major right-bank tributaries include Yamuna (Jumna), Son, Punpun and Damodar.
The Tons-Yamuna-Ganga continuous flow is the longest river in the Ganges basin. However, by convention, Tons is considered as a separate river, and the length of Ganga and Yamuna is calculated from Gangotri and Yamunotri respectively. If calculated from source of Tons, the length of Tons-Yamuna-Ganga river is 2,758 km.
For similar reasons, sources differ over the size of the river’s drainage basin. The basin covers parts of four countries, India, Nepal, China, and Bangladesh; eleven Indian states, Himachal Pradesh, Uttarakhand, Uttar Pradesh, Madhya Pradesh, Chhattisgarh, Bihar, Jharkhand, Punjab, Haryana, Rajasthan, West Bengal, and the Union Territory of Delhi. The Ganges basin, including the delta but not the Brahmaputra or Meghna basins, is about 1,080,000 km2 (420,000 sq mi), of which 861,000 km2 (332,000 sq mi) are in India (about 80%), 140,000 km2 (54,000 sq mi) in Nepal (13%), 46,000 km2 (18,000 sq mi) in Bangladesh (4%), and 33,000 km2 (13,000 sq mi) in China (3%). Sometimes the Ganges and Brahmaputra–Meghna drainage basins are combined for a total of about 1,600,000 km2 (620,000 sq mi), or 1,621,000 km2 (626,000 sq mi). The combined Ganges-Brahmaputra-Meghna basin (abbreviated GBM or GMB) drainage basin is spread across Bangladesh, Bhutan, India, Nepal, and China.
The Ganges basin ranges from the Himalaya and the Transhimalaya in the north, to the northern slopes of the Vindhya range in the south, from the eastern slopes of the Aravalli in the west to the Chota Nagpur plateau and the Sunderbans delta in the east. A significant portion of the discharge from the Ganges comes from the Himalayan mountain system. Within the Himalaya, the Ganges basin spreads almost 1,200 km from the Yamuna-Satluj divide along the Simla ridge forming the boundary with the Indus basin in the west to the Singalila Ridge along the Nepal-Sikkim border forming the boundary with the Brahmaputra basin in the east. This section of the Himalaya contains 9 of the 14 highest peaks in the world over 8,000m in height, including Mount Everest which is the high point of the Ganges basin. The other peaks over 8,000m in the basin are Kangchenjunga, Lhotse, Makalu, Cho Oyu, Dhaulagiri, Manaslu, Annapurna and Shishapangma. The Himalayan portion of the basin includes the south-eastern portion of the state of Himachal Pradesh, the entire state of Uttarakhand, the entire country of Nepal and the extreme north-western portion of the state of West Bengal.
The discharge of the Ganges also differs by source. Frequently, discharge is described for the mouth of the Meghna River, thus combining the Ganges with the Brahmaputra and Meghna. This results in a total average annual discharge of about 38,000 m3/s (1,300,000 cu ft/s), or 42,470 m3/s (1,500,000 cu ft/s). In other cases the average annual discharges of the Ganges, Brahmaputra, and Meghna are given separately, at about 16,650 m3/s (588,000 cu ft/s) for the Ganges, about 19,820 m3/s (700,000 cu ft/s) for the Brahmaputra, and about 5,100 m3/s (180,000 cu ft/s) for the Meghna.
The maximum peak discharge of the Ganges, as recorded at Hardinge Bridge in Bangladesh, exceeded 70,000 m3/s (2,500,000 cu ft/s). The minimum recorded at the same place was about 180 m3/s (6,400 cu ft/s), in 1997.
The hydrologic cycle in the Ganges basin is governed by the Southwest Monsoon. About 84% of the total rainfall occurs in the monsoon from June to September. Consequently, streamflow in the Ganges is highly seasonal. The average dry season to monsoon discharge ratio is about 1:6, as measured at Hardinge Bridge. This strong seasonal variation underlies many problems of land and water resource development in the region. The seasonality of flow is so acute it can cause both drought and floods. Bangladesh, in particular, frequently experiences drought during the dry season and regularly suffers extreme floods during the monsoon.
In the Ganges Delta many large rivers come together, both merging and bifurcating in a complicated network of channels. The two largest rivers, the Ganges and Brahmaputra, both split into distributary channels, the largest of which merge with other large rivers before themselves joining. This current channel pattern was not always the case. Over time the rivers in Ganges Delta have changed course, sometimes altering the network of channels in significant ways.
Before the late 12th century the Bhagirathi-Hooghly distributary was the main channel of the Ganges and the Padma was only a minor spill-channel. The main flow of the river reached the sea not via the modern Hooghly River but rather by the Adi Ganga. Between the 12th and 16th centuries the Bhagirathi-Hooghly and Padma channels were more or less equally significant. After the 16th century the Padma grew to become the main channel of the Ganges. It is thought that the Bhagirathi-Hooghly became increasingly choked with silt, causing the main flow of the Ganges to shift to the southeast and the Padma River. By the end of the 18th century the Padma had become the main distributary of the Ganges. One result of this shift to the Padma was that the Ganges joined the Meghna and Brahmaputra rivers before emptying into the Bay of Bengal, together instead of separately. The present confluence of the Ganges and Meghna formed about 150 years ago.
Near the end of the 18th century, the course of the lower Brahmaputra changed dramatically, altering its relationship with the Ganges. In 1787 there was a great flood on the Teesta River, which at the time was a tributary of the Ganges-Padma River. The flood of 1787 caused the Teesta to undergo a sudden change course (an avulsion), shifting east to join the Brahmaputra and causing the Brahmaputra to shift its course south, cutting a new channel. This new main channel of the Brahmaputra is called the Jamuna River. It flows south to join the Ganges-Padma. Since ancient times the main flow of the Brahmaputra was more easterly, passing by the city of Mymensingh and joining the Meghna River. Today this channel is a small distributary but retains the name Brahmaputra, sometimes Old Brahmaputra. The site of the old Brahmaputra-Meghna confluence, in the locality of Langalbandh, is still considered sacred by Hindus. Near the confluence is a major early historic site called Wari-Bateshwar.
Note : The above story is based on materials provided by Wikipedia.