back to top
27.8 C
New York
Sunday, April 20, 2025
Home Blog Page 251

Life might thrive a dozen miles beneath Earth’s surface

A beach outcrop at Davis Head on Lopez Island in Washington State, where researchers at Yale discovered veins of aragonite containing oddly light carbon isotopes suggestive of life’s imprint. Credit: Stoddard et al

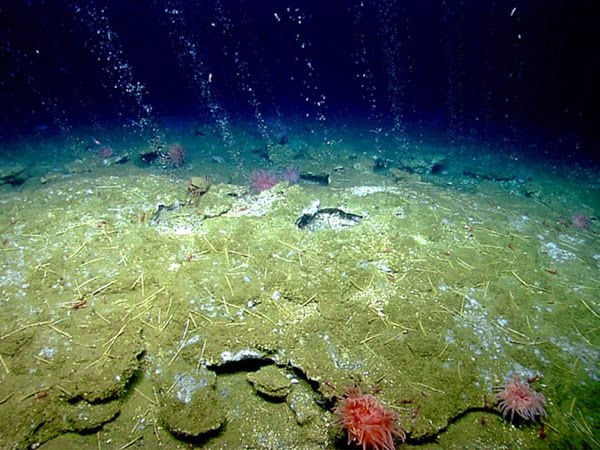
Life teems all over our planet’s exterior and even down into the lightless oceanic depths. But just how far underground might life be able to hack it?

New research offers evidence of bacteria living as deep as 12 miles underground—quite possibly the deepest life has ever glimpsed. Learning biology’s terrestrial limits, though important in its own right, is critical to understanding life’s rise on other planets with far less forgiving climates and surface conditions than the Earth’s.

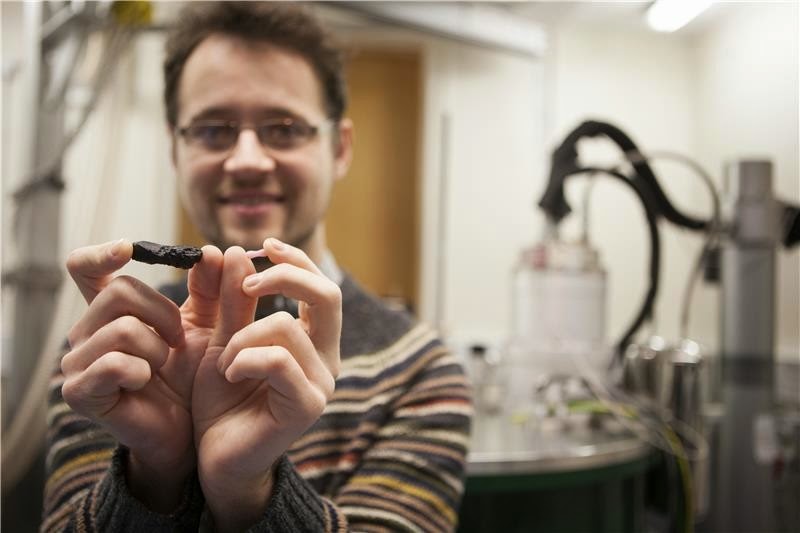
“Most studies report microbial life in the crust to no deeper than a few kilometers—just a mile or so,” said Philippa Stoddard, an undergraduate in Yale University’s geology and geophysics department. “Assuming our data are correct, this greatly expands our understanding of the extent of the Earth’s biosphere.”

Stoddard presented the research at the Geological Society of America’s annual meeting in Vancouver, British Columbia on October 21.

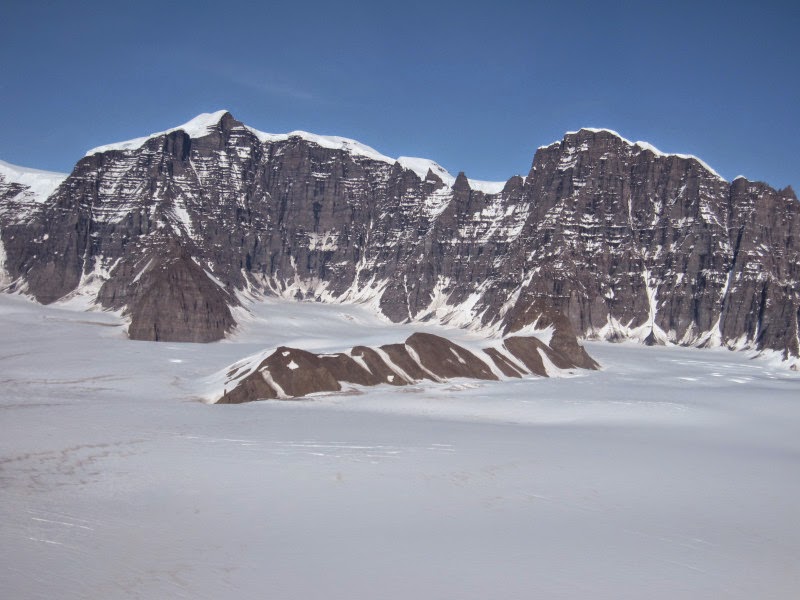
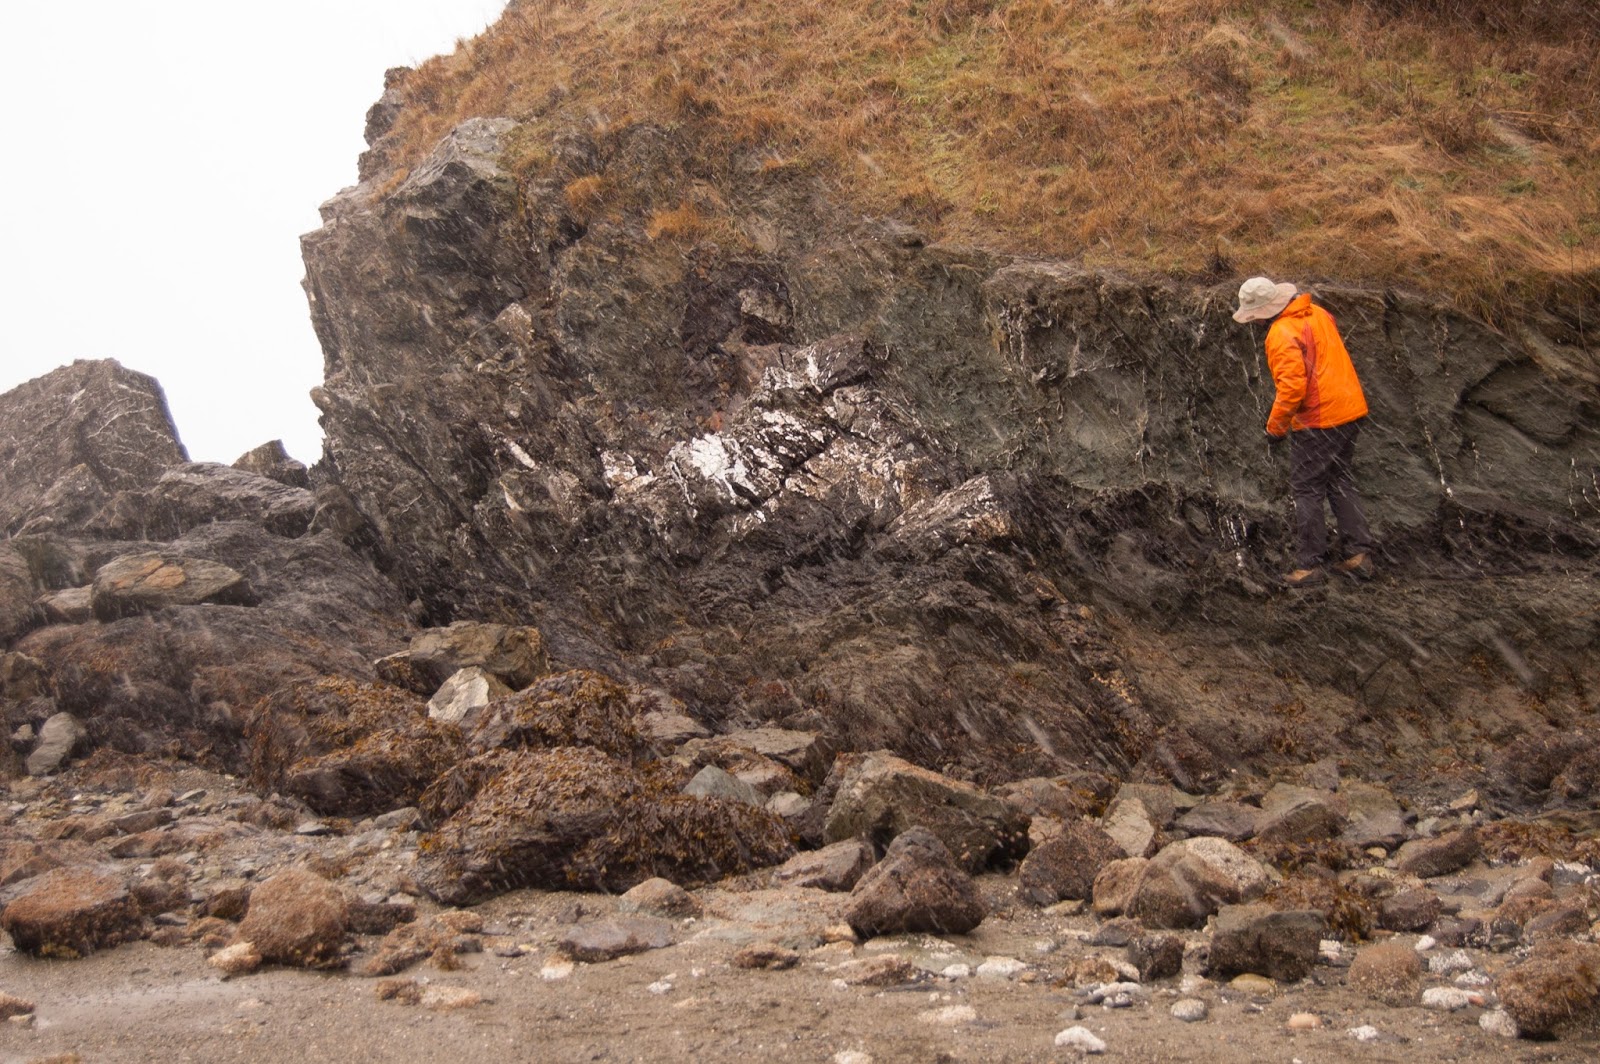
Acting on clues from nearly two-decades-old field work, Stoddard and her Yale colleagues examined rocks on Lopez Island in northwestern Washington. An outcrop there containing veins of the mineral aragonite, dredged up to the surface scores of millions of years ago by geological processes, was found to contain weirdly high levels of a lightweight version of the element carbon. This carbon signature is usually produced by microbes that excrete the carbon containing compound methane.

The likeliest explanation is that life forms, once buried deep in the Earth’s crust, altered the ancient aragonite’s carbon signature. These microbes were so far underground they would have had to withstand extreme temperatures and pressures—a dramatic demonstration of life’s robustness that bodes well an ability to take hold in unearthly environments.

“I think that results like ours are very encouraging for the possibility of life on other planets,” said Stoddard. “The more we learn about extreme environments on our own planet, the more we realize how resilient life is.”

Almost forgotten

The startling discovery initially cropped up in the 1990s. Fieldwork by J.G. Feehan for his 1997 doctoral dissertation with Yale professor Mark T. Brandon, who now is Stoddard’s academic advisor, had identified the aragonite’s very light carbon signatures.

Feehan suggested at the time that the signatures were the fingerprint of super-deep life. His focus, however, was on the geophysics of the rocks hosting the aragonite veins. So the subterranean life hypothesis sat, un-pursued, ever since.

Stoddard and Brandon, along with Yale professor Danny Rye, decided to pick up the thread. They recently returned to the scene in Washington State.

“Professor Brandon and I went back to the outcrop on Lopez Island where Feehan had done his isotopic measurements to see if we could corroborate his data and explore the suggestion of deep life more thoroughly,” explained Stoddard.

Telltale abundances

Specifically, as Feehan had done, Stoddard looked at the ratios of two carbon isotopes, or versions of an element containing different numbers of neutrons. The isotopes in question are carbon-12 and carbon-13, or C-12 and C-13. The former makes up the vast majority of carbon on the Earth. It has six protons and six neutrons in its atomic nucleus. C-13 has an extra, seventh neutron.

Life alters the typical ratio of C-12 to C-13 because most biochemical processes —eating, growth, and so on—divide isotopes into lighter and heavier camps. The way this works is actually pretty simple. Lower-numbered isotopes, possessing less mass, are lighter than higher-numbered isotopes. Lighter objects, like an empty cardboard box, are of course easier to move than a loaded safe of the same size. Similarly, lighter isotopes have an easier time getting about in the push-and-pull of biological matter at Lilliputian scales, driven by energy and molecular interactions.

“Because carbon-12 is the lighter isotope, it is more thermodynamically mobile than carbon-13,” said Stoddard. “It can actually move faster.”

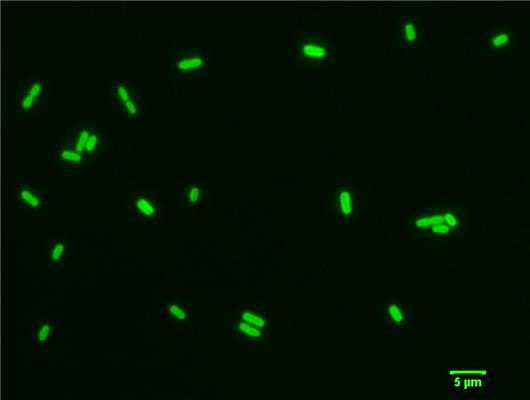
Methane, a common waste product of microbes, contains a single carbon atom plus four hydrogen atoms. When microbes consume carbon-rich molecules and excrete methane, the waste methane containing the lighter, faster isotope C-12 returns to the environment more readily than C-13-laden methane. The typical ratio of one carbon isotope to the other ends up skewed as a result in rocks, for example, as in the case of the Lopez Island aragonite.

“The methane produced by microbes has much less of the heavy isotope than the standard ratio,” said Stoddard.

Some non-biological processes can segregate carbon isotopes as well, but they tend not to do as efficiently, noted Stoddard.

The land down under

The San Juan Islands—including Lopez Island, site of the intriguing aragonite—only became islands as such about 100 million years ago, back in the dinosaurs’ heyday. Before then, these sea bottom rocks, located near what is now Vancouver Island, had subducted under a neighboring chunk of rock, a geological process that often happens where tectonic plates meet at ocean and continental boundaries.

Buried in the bowels of the Earth, pressures and heat metamorphosed the dark basalt rock, creating thin, whitish veins of aragonite. Over time, microbes on the scene then slowly altered the carbon signatures in this aragonite through the methodical excretion of methane gas in this pitch-black, hot, squeezed environment.

Subsurface water trapped with the microbes could have further enabled their subsistence in such a place. The temperatures would likely have exceed 250 degrees Fahrenheit—the known cutoff for even the hardiest of life to still function (in hot springs).

How would these microbes have survived? Counterintuitively, the exceedingly high pressure in a miles-deep habitat—in the neighborhood of 5,000 times the pressure exerted by the atmosphere at sea level—could have helped. High pressures actually can stabilize biomolecules, such as DNA, offsetting the heat’s destructive effects.

Similar scenarios could still persist today around the globe, meaning Earth’s biosphere might extend many miles below the planet’s surface.

“We’ve seen over the past couple decades of exploration that life can survive in an incredible diversity of ecosystems, even in deep-sea vents and glacial ice,” said Stoddard. “If the deep earth was survivable for specialized microbes 100 million years ago, those same strategies could still work today.”

Subsurface refuges

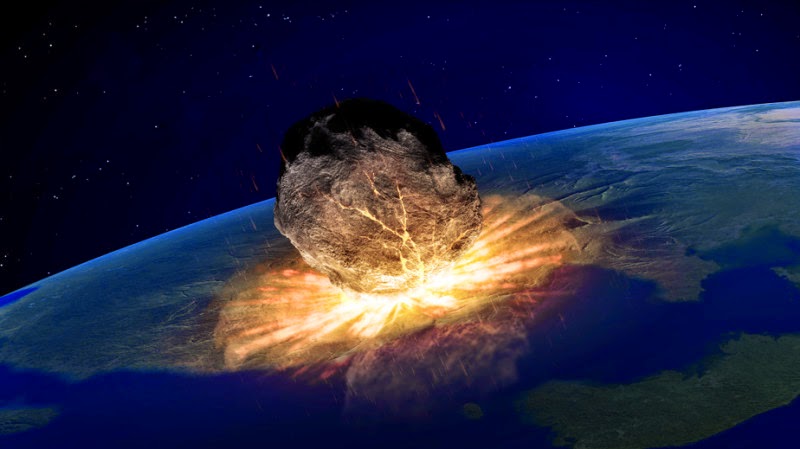
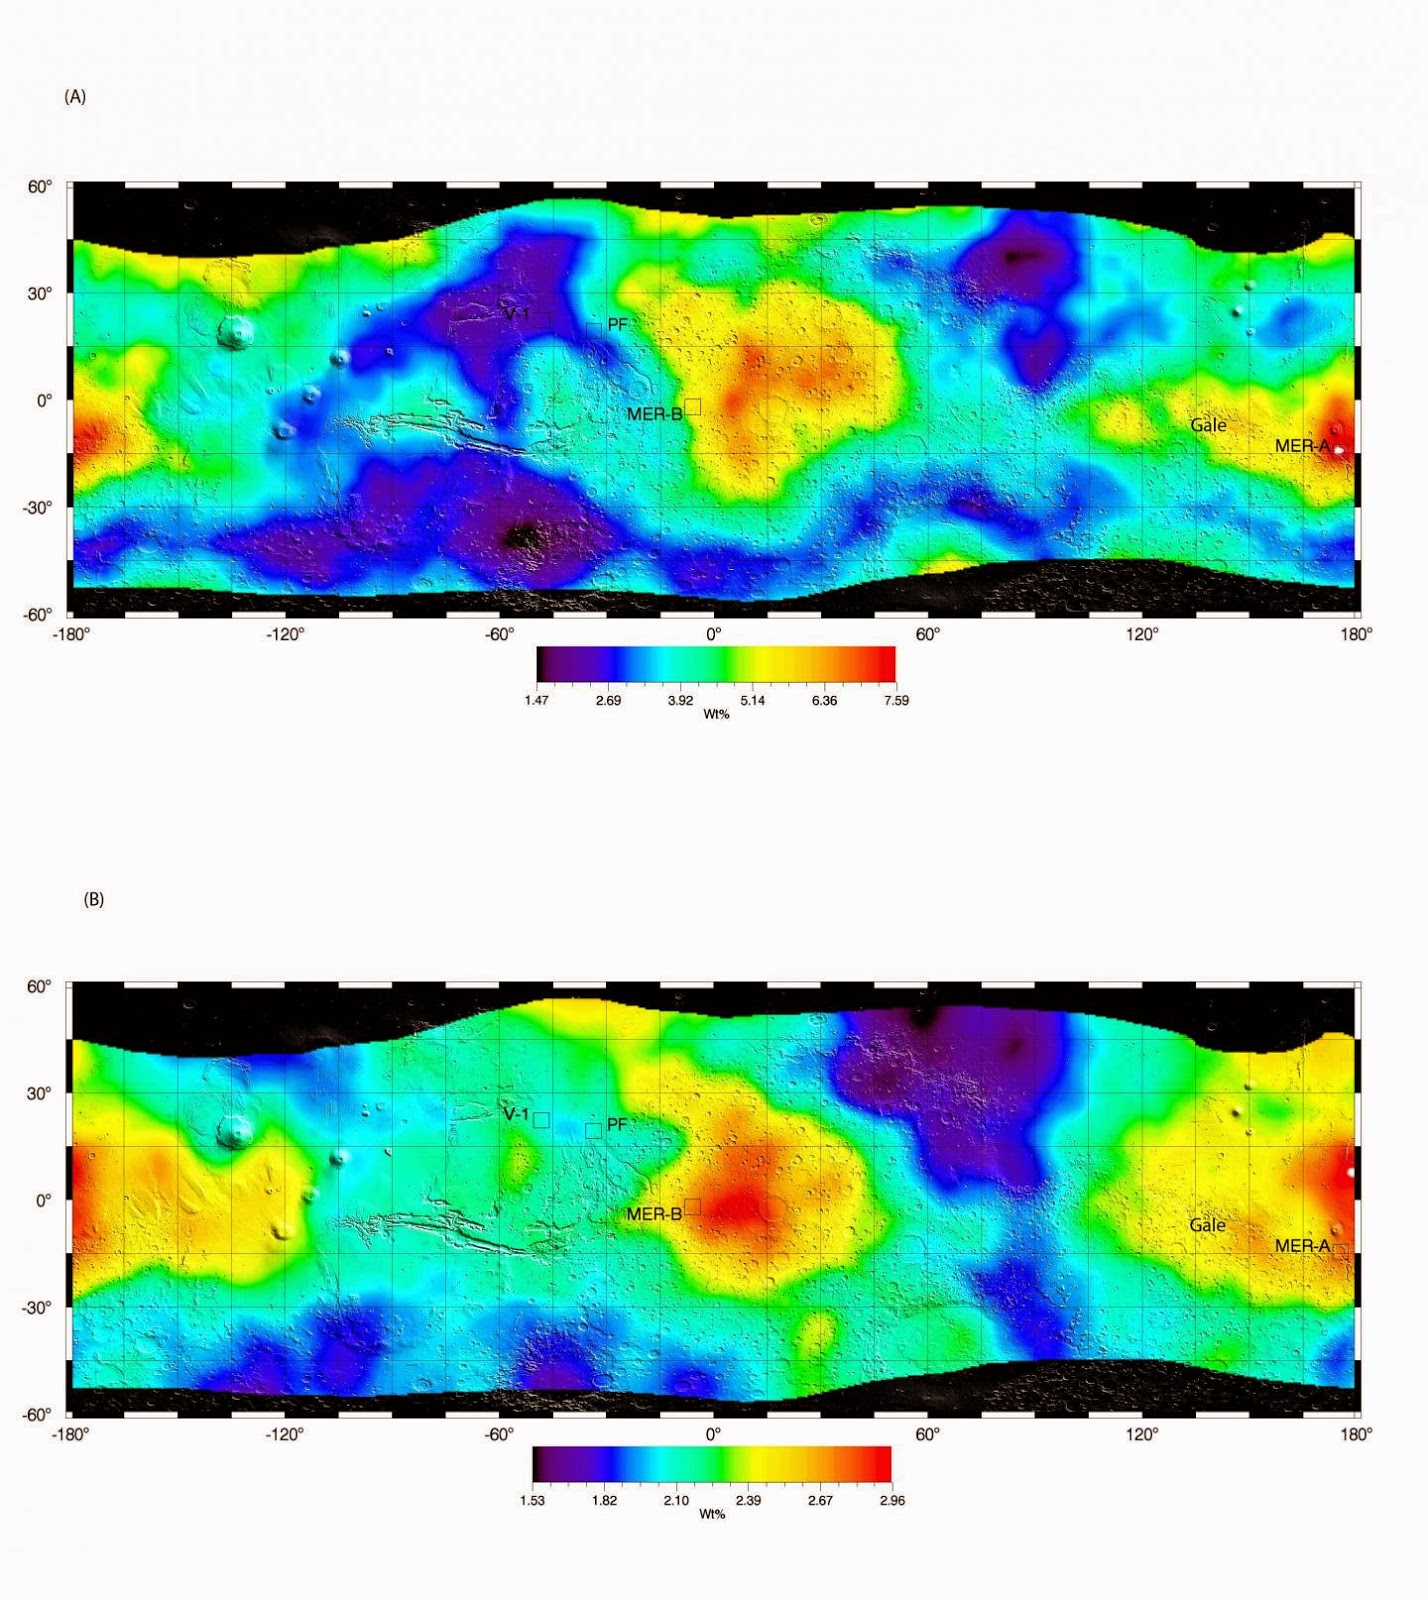
A similar approach could allow extraterrestrial life to get by under the desolate surfaces of worlds such as Mars.

Despite some of the obvious drawbacks of living deeply, microbes that have evolved to persist in such conditions would have advantages over life attempting to take hold aboveground in hostile environments.

Take Mars again as an example. Its surface gets bombarded with hundreds of times more cosmic radiation than Earth’s surface. Mars lacks a shielding magnetic field, so life developing on its surface would have substantially greater exposure to damaging radiation. Deep under the surface, that risk diminishes, along with other risks posed by, say, scalding or freezing temperatures.

“Underground environments would potentially be favorable locations for extraterrestrial life because they are more shielded from harmful surface conditions like cosmic radiation and insulated from extreme surface temperatures,” said Stoddard. “It’s definitely something we should keep in mind as we explore other planets.”

Stoddard and colleagues intend to further study the long-buried Lopez Island rocks to glean more information about how, and if, life had indeed called them home.

“Although our isotope data is highly suggestive of deep life, there are still lots of things we don’t know about this environment that could impact our conclusions,” said Stoddard. “We’re hoping to be able to construct a pretty detailed portrait of this deep ecosystem in the next couple of months.”

Note : The above story is based on materials provided by Astrobio.net
This story is republished courtesy of NASA’s Astrobiology Magazine. Explore the Earth and beyond at www.astrobio.net .

Ancient fossils reveal rise in parasitic infections due to climate change

This image shows the following: (A) Whole specimen from sample 154 with shallow pits; (B) Partial specimen from sample 154 with deep pits; (C) Partial specimen from sample 157 displaying pits on multiple growth layers; and (D) Incipient steinkern from sample 162 displaying pits preserved as positive relief on lower half of specimen. Credit: John Warren Huntley

When seeking clues about the future effects of possible climate change, sometimes scientists look to the past. Now, a paleobiologist from the University of Missouri has found indications of a greater risk of parasitic infection due to climate change in ancient mollusk fossils. His study of clams from the Holocene Epoch (that began 11,700 years ago) indicates that current sea level rise may mimic the same conditions that led to an upsurge in parasitic trematodes, or flatworms, he found from that time. He cautions that an outbreak in human infections from a related group of parasitic worms could occur and advises that communities use the information to prepare for possible human health risks.

Trematodes are internal parasites that affect mollusks and other invertebrates inhabiting estuarine environments, which are the coastal bodies of brackish water that connect rivers and the open sea. John Huntley, assistant professor of geological sciences in the College of Arts and Science at MU, studied prehistoric clam shells collected from the Pearl River Delta in China for clues about how the clams were affected by changes caused from global warming and the resulting surge in parasites.

“Because they have soft bodies, trematodes do not leave body fossils,” Huntley said. “However, infected clam shells develop oval-shaped pits where the clam grew around the parasite in order to keep it out; the prevalence of these pits and their makeup provide clues to how the clams adapted to fight trematodes. When compared to documented rises in sea level more than 9,300 years ago, we found that we currently are creating conditions for an increase in trematodes in present-day estuarine environments. This could have harmful implications for both animal and human health, including many of the world’s fisheries.”

Modern-day trematodes will first infest mollusks like clams and snails, which are eaten by shore birds and mammals including humans. Symptoms of infection in humans range from liver and gall bladder inflammation to chest pain, fever, and brain inflammation. The infections can be fatal. At least 56 million people globally suffer from one or more foodborne trematode infections, according to the World Health Organization.

Huntley and his team compared these findings to those from his previous study on clams found in the Adriatic Sea. Using data that includes highly detailed descriptions of climate change and radiocarbon dating Huntley noticed a rising prevalence of pits in the clam shells, indicating a higher prevalence of the parasites during times of sea level rise in both the fossils from China and Italy.

“By comparing the results we have from the Adriatic and our new study in China, we’re able to determine that it perhaps might not be a coincidence, but rather a general phenomenon,” Huntley said. “While predicting the future is a difficult game, we think we can use the correspondence between the parasitic prevalence and past climate change to give us a good road map for the changes we need to make.”

Reference:
John Warren Huntley, Franz T. Fürsich, Matthias Alberti, Manja Hethke, Chunlian Liu. A complete Holocene record of trematode–bivalve infection and implications for the response of parasitism to climate change. Proceedings of the National Academy of Sciences, 2014; 111 (51): 18150 DOI: 10.1073/pnas.1416747111

Note : The above story is based on materials provided by University of Missouri-Columbia.

Evolution: Rock sponges split up

Rock sponges have a highly characteristic and extremely robust rock-like skeleton, which consists of barbed needles called spicules made of silicon dioxide (i.e., glass), which interlock to form a rigid network. Credit: Professor Gert Wörheide

A study led by researchers at Ludwig-Maximilians-Universitaet (LMU) in Munich throws new light on the evolution of the so-called rock sponges, and reveals that conventional, morphology-based taxonomies do not accurately reflect the true genealogical relationships within the group.

Modern approaches to biological systematics have demonstrated that the evolutionary relationships between organisms can best be teased out by combining morphological analysis of fossil material with molecular genetic investigation of the genomes of living species. “This is a challenging task, particularly when fossil evidence is sparse, as in the case of most families of sponges,” says Professor Gert Wörheide of the Geobio-CenterLMU and LMU’s Department of Earth and Environmental Sciences. “The so-called rock sponges represent an exception to this rule insofar as they provide among the richest fossil record of sponges. With the aid of these fossils and the most comprehensive analysis yet carried out of gene sequences from extant species, an international team led by Wörheide has now reassessed the genealogy of the rock sponges — and show that, in many cases, traditional taxonomy does not correctly depict the evolutionary history of the group as a whole.

Rock sponges belong to the class Demospongiae, which account for the great majority of contemporary species assigned to the phylum Porifera. Demosponges are found in tropical, subtropical and temperate regions of the world’s oceans and occur at all depths from shallow reefs to abyssal depths. More than 300 extant species of rock sponges have been recognized, and classified into 41 genera that are assigned to 13 families. However, by comparison with the range of species represented in the fossil record, with over 300 genera comprising 34 families, the degree of diversity found in the contemporary demosponge fauna is comparatively modest. “The origins of modern rock sponges can be traced back over more than 500 million years into the Paleozoic, and this suggests that much more research will be needed before we understand their evolutionary history,” Wörheide adds.

Rock sponges have a highly characteristic and extremely robust rock-like skeleton, which consists of barbed needles called spicules made of silicon dioxide (i.e., glass), which interlock to form a rigid network. The form and structure of the skeletal elements provide some of the most important characters used to classify the rock sponges. “However, their precise classification and many aspects of their evolutionary history are still the subject of controversial debate,” says Astrid Schuster, a doctoral student in Wörheide’s group, who is first author of the new study. “Previous classifications were largely based on morphological similarities, and these led taxonomists to place many genera in the order ‘Lithistida’, a dubious grouping which is still cited frequently in the literature,” she explains. With the aid of international colleagues, the team has now extended earlier molecular systematic studies and sequenced a specific pair of genes in each of 68 individual species of rock sponge, which had previously been assigned to 21 genera and 12 families. In addition, the team made use of previously reported gene sequences that were available in public databases.

The researchers correlated the molecular genetic results with characteristic features of the skeletal morphology, such as the type and configuration of the siliceous spicules. “The new findings refute some of the assumptions that have been made regarding the course of rock sponge evolution, and demonstrate that some species have been assigned to genera to which they do not actually belong,” says Schuster. Indeed, it is now abundantly clear that ‘Lithistida’ does not constitute a natural group, i.e., not all of its members can be derived from a direct common ancestor. In particular, the new work shows that classifications based on skeletal elements require thorough reassessment, because some of the different types of spicules that are characteristic for rock sponges arose, or were lost, several times independently during evolution. “So morphological similarities are not a reliable guide for the reconstruction of the genealogical relationships between these organisms,” Wörheide affirms, “and this is certainly also true of the other classes of sponge.”

The new study lays the groundwork for further investigations, in which the researchers will try to pinpoint the times at which the different sponge lineages diverged from one another. To do so, they will exploit the principle of the “molecular clock,” which reflects the fact that the extent of molecular divergence between sequences of the same (“homologous”) genes in any given pair of species provides a measure of the time elapsed since they diverged from one another. By dating divergence times, this strategy promises to enhance our understanding of sponge evolution, and should help to explain why Porifera are among the oldest groups of multicellular organisms still in existence.

Reference:
Astrid Schuster, Dirk Erpenbeck, Andrzej Pisera, John Hooper, Monika Bryce, Jane Fromont, Gert Wörheide. Deceptive Desmas: Molecular Phylogenetics Suggests a New Classification and Uncovers Convergent Evolution of Lithistid Demosponges. PLoS ONE, 2015; 10 (1): e116038 DOI: 10.1371/journal.pone.0116038

Note: The above story is based on materials provided by Ludwig-Maximilians-Universität München.

Two-faced fish clue that our ancestors ‘weren’t shark-like’

The 415-million-year-old fish Janusiscus provides critical evidence for a well-developed external skeleton (shown in blue) in the shared ancestor of bony fishes and cartilaginous fishes such as sharks. Placoderm image courtesy of K Trinajstic. Credit: Oxford University/K Trinajstic

An investigation of a 415 million year-old fish skull strongly suggests that the last common ancestor of all jawed vertebrates, including humans, was not very shark-like. It adds further weight to the growing idea that sharks are not ‘primitive’.

The fossil skull’s external features meant it had always been thought to belong to the bony fishes (osteichthyans), a group which includes familiar fishes such as cod and tuna as well as all land-dwelling creatures with backbones. But when scientists from Oxford University and Imperial College London used X-ray CT scanning to look inside the skull they found the structure surrounding the brain was reminiscent of cartilaginous fishes (chondrichthyans) such as sharks and rays. The fish fossil’s ‘two faces’ led to it being named Janusiscus after the double-faced Roman god Janus.

A report of the research is published in the journal Nature.

‘This 415 million year-old fossil gives us an intriguing glimpse of the ‘Age of Fishes’, when modern groups of vertebrates were really beginning to take off in an evolutionary sense,’ said Dr Matt Friedman of Oxford University’s Department of Earth Sciences, an author of the report. ‘It tells us that the ancestral jawed vertebrate probably doesn’t fit into our existing categories.’

Chondrichthyans have often been viewed as primitive, and treated as proxies for what the ‘ancestral’ jawed vertebrate would have looked like. A key component of this view is the lack of a bony skeleton in cartilaginous fishes.

Janusiscus fish fossil Credit: Oxford University/K Trinajstic

‘The results from our analysis help to turn this view on its head: the earliest jawed vertebrates would have looked somewhat more like bony fishes, at least externally, with large dermal plates covering their skulls,’ said Sam Giles of Oxford University’s Department of Earth Sciences, first author of the report. ‘In fact, they would have had a mix of what are now viewed as cartilaginous- and bony fish-like features, supporting the idea that both groups became independently specialised later in their separate evolutionary histories.’

Dr Friedman said: ‘This mix of features, some reminiscent of bony fishes and others cartilaginous fishes, suggests that humans may have just as many features that you might call ‘primitive’ as sharks.’

The fossil skull was originally found near the Sida River in Siberia in 1972 and is currently held in the Institute of Geology at the Tallinn University of Technology, Estonia. Study author Martin Brazeau of Imperial College London spotted the specimen in an online catalogue and the team decided it would be worth studying in greater detail using modern investigative techniques.

The team then used X-ray CT (computed tomography) to ‘virtually’ cut through the fossil. Different materials attenuate X-rays to different amounts — just as in a hospital X-ray, bones show up brighter than muscles and skin. This same principle can be applied to fossils, as fossilised bone and rock attenuate X-rays to different degrees. This technique was used to build a 3D virtual model of the fossil, enabling its internal and external features to be examined in great detail. Traces left by networks of blood vessels and nerves, often less than 1/100th of a centimetre in diameter, could then be compared to structure in a variety of jawed vertebrate groups, including sharks and bony fishes.

‘Losing your bony skeleton sounds like a pretty extreme adaptation,’ said Dr Friedman, ‘but with remarkable discoveries from China, Janusiscus strongly suggests that that the ancient ancestors of modern sharks and their kin started out just as ‘bony’ as our own ancestors.’

Video

Reference:
Sam Giles, Matt Friedman & Martin D. Brazeau. Osteichthyan-like cranial conditions in an Early Devonian stem gnathostome. Nature, 2015 DOI: 10.1038/nature14065

Note : The above story is based on materials provided by University of Oxford.

Small volcanic eruptions partly explain ‘warming hiatus’

The Tavurvur Cone in Papua New Guinea was erupting when this image was captured by the Advanced Land Imager on NASA’s Earth Observing-1 (EO-1) satellite on Nov. 30, 2009. The eruption is one that may have contributed to a “warming hiatus.” Credit: Image courtesy of DOE/Lawrence Livermore National Laboratory

The “warming hiatus” that has occurred over the last 15 years has been caused in part by small volcanic eruptions.

Scientists have long known that volcanoes cool the atmosphere because of the sulfur dioxide that is expelled during eruptions. Droplets of sulfuric acid that form when the gas combines with oxygen in the upper atmosphere can persist for many months, reflecting sunlight away from Earth and lowering temperatures at the surface and in the lower atmosphere.

Previous research suggested that early 21st-century eruptions might explain up to a third of the recent warming hiatus.

New research available online in the journal Geophysical Research Letters (GRL) further identifies observational climate signals caused by recent volcanic activity. This new research complements an earlier GRL paper published in November, which relied on a combination of ground, air and satellite measurements, indicating that a series of small 21st-century volcanic eruptions deflected substantially more solar radiation than previously estimated.

“This new work shows that the climate signals of late 20th- and early 21st-century volcanic activity can be detected in a variety of different observational data sets,” said Benjamin Santer, a Lawrence Livermore National Laboratory scientist and lead author of the study.

The warmest year on record is 1998. After that, the steep climb in global surface temperatures observed over the 20th century appeared to level off. This “hiatus” received considerable attention, despite the fact that the full observational surface temperature record shows many instances of slowing and acceleration in warming rates. Scientists had previously suggested that factors such as weak solar activity and increased heat uptake by the oceans could be responsible for the recent lull in temperature increases. After publication of a 2011 paper in the journal Science by Susan Solomon of the Massachusetts Institute of Technology (link is external) (MIT), it was recognized that an uptick in volcanic activity might also be implicated in the warming hiatus.

Prior to the 2011 Science paper, the prevailing scientific thinking was that only very large eruptions — on the scale of the cataclysmic 1991 Mount Pinatubo eruption in the Philippines, which ejected an estimated 20 million metric tons (44 billion pounds) of sulfur — were capable of impacting global climate. This conventional wisdom was largely based on climate model simulations. But according to David Ridley, an atmospheric scientist at MIT and lead author of the November GRL paper, these simulations were missing an important component of volcanic activity.

Ridley and colleagues found the missing piece of the puzzle at the intersection of two atmospheric layers, the stratosphere and the troposphere — the lowest layer of the atmosphere, where all weather takes place. Those layers meet between 10 and 15 kilometers (six to nine miles) above Earth.

Satellite measurements of the sulfuric acid droplets and aerosols produced by erupting volcanoes are generally restricted to above 15 km. Below 15 km, cirrus clouds can interfere with satellite aerosol measurements. This means that toward the poles, where the lower stratosphere can reach down to 10 km, the satellite measurements miss a significant chunk of the total volcanic aerosol loading.

To get around this problem, the study by Ridley and colleagues combined observations from ground-, air- and space-based instruments to better observe aerosols in the lower portion of the stratosphere. They used these improved estimates of total volcanic aerosols in a simple climate model, and estimated that volcanoes may have caused cooling of 0.05 degrees to 0.12 degrees Celsius since 2000.

The second Livermore-led study shows that the signals of these late 20th and early 21st eruptions can be positively identified in atmospheric temperature, moisture and the reflected solar radiation at the top of the atmosphere. A vital step in detecting these volcanic signals is the removal of the “climate noise” caused by El Niños and La Niñas.

“The fact that these volcanic signatures are apparent in multiple independently measured climate variables really supports the idea that they are influencing climate in spite of their moderate size,” said Mark Zelinka, another Livermore author. “If we wish to accurately simulate recent climate change in models, we cannot neglect the ability of these smaller eruptions to reflect sunlight away from Earth.”

References:
D. A. Ridley, S. Solomon, J. E. Barnes, V. D. Burlakov, T. Deshler, S. I. Dolgii, A. B. Herber, T. Nagai, R. R. Neely, A. V. Nevzorov, C. Ritter, T. Sakai, B. D. Santer, M. Sato, A. Schmidt, O. Uchino, J. P. Vernier. Total volcanic stratospheric aerosol optical depths and implications for global climate change. Geophysical Research Letters, 2014; 41 (22): 7763 DOI: 10.1002/2014GL061541

Benjamin D. Santer, Susan Solomon, Céline Bonfils, Mark D. Zelinka, Jeffrey F. Painter, Francisco Beltran, John C. Fyfe, Gardar Johannesson, Carl Mears, David A. Ridley, Jean-Paul Vernier, Frank J. Wentz. Observed multi-variable signals of late 20th and early 21st century volcanic activity. Geophysical Research Letters, 2014; DOI: 10.1002/2014GL062366

Note : The above story is based on materials provided by DOE/Lawrence Livermore National Laboratory.

Missing electrons the secret to mine metal

Research suggests an extra source of electrons was needed to create the massive Here’s Your Chance deposit. Credit: McArthur River Mine

Researchers have advanced the quest to understand how one of Australia and the world’s largest zinc and lead mining deposits was formed.

Covering 2 km2, the Here’s Your Chance (HYC) mine is located in the Middle Proterozoic McArthur Basin, in the Northern Territory.

Mineral deposits like HYC’s are created when sulfate in the ore fluids is reduced to produce lead and zinc sulfides, a process that requires electrons.

Yet researchers investigating the chemistry of HYC’s formation say local sediments may have supplied only around one-third of the electrons required to form the deposit.

Dr Jeffrey Dick from Curtin University says his team looked at the amounts (or ‘budgets’) of carbon, sulfur and electrons required to form a deposit of HYC’s size.

Their study accounted for possible flow and interaction between five conceptually distinct reservoirs: HYC’s un-mineralised shale, the HYC ore deposit, oceanic water, hydrothermal ore-bearing fluids, and external reservoirs, included to allow for the introduction of external reduced carbon or sulfide.

Search for the missing electrons
Dr Dick’s team first explored how many electrons could have been produced in-situ, by oxidation of organic matter within the mine sediments.

“Through mass balance calculations, we explored whether enough organic matter was present to allow for the necessary level of reduction,” Dr Dick says.

“We found that the oxidisation of in-situ organic carbon provides at most one-third of the [electrons] needed to reduce sulfate to form the known quantity of ore minerals at HYC.”

Dr Dick says this minimal contribution by in-situ organic matter suggests the introduction of another source of electrons, in the form of reduced carbon, or an alternative source of reduced sulfur.

He says the reduced sulfur could have come from deep seawater, which may have become progressively more sulfidic after 1.8 GA (1.8 billion years ago) and perhaps contacted localised sulphate in the ore fluids to form extra sulfide.

The missing electrons may also have been provided by natural gas containing significant amounts of hydrogen sulfide, a hydrocarbon reservoir in the subsurface, or hydrocarbons migrating from deep within the earth.

Researchers say evidence at HYC of aromatic hydrocarbons—thought to form deep underground at temperatures above 200oC—supports the idea of migration.

While the mystery of the missing electrons has not been definitively solved, Dr Dick says the study’s investigative framework has proven valid and can help in understanding other lead-zinc deposits worldwide.

Reference:
“Combined sulfur, carbon and redox budget constraints on genetic models for the Here’s Your Chance Pb–Zn deposit, Australia.” GeoResJ, Volumes 3–4, September–December 2014, Pages 19-26, ISSN 2214-2428, dx.doi.org/10.1016/j.grj.2014.09.001.

Note : The above story is based on materials provided by Science Network WA.

Small volcanic eruptions partly explain ‘warming hiatus’

This image was taken during the August 2014 eruption of Tavurvur in Papua New Guinea. Lawrence Livermore researchers identified the climatic signals of some of the larger early 21st-century eruptions (such as the October 2006 eruption of Tavurvur).

The “warming hiatus” that has occurred over the last 15 years has been partly caused by small volcanic eruptions.

Scientists have long known that volcanoes cool the atmosphere because of the sulfur dioxide that is expelled during eruptions. Droplets of sulfuric acid that form when the gas combines with oxygen in the upper atmosphere can persist for many months, reflecting sunlight away from Earth and lowering temperatures at the surface and in the lower atmosphere.

Previous research suggested that early 21st century eruptions might explain up to a third of the recent “warming hiatus.”

New research available online in the journal Geophysical Research Letters (GRL) further identifies observational climate signals caused by recent volcanic activity. This new research complements an earlier GRL paper published in November, which relied on a combination of ground, air and satellite measurements, indicated that a series of small 21st century volcanic eruptions deflected substantially more solar radiation than previously estimated.

“This new work shows that the climate signals of late 20th and early 21st century volcanic activity can be detected in a variety of different observational data sets,” said Benjamin Santer, a Lawrence Livermore National Laboratory scientist and lead author of the study.

The warmest year on record is 1998. After that, the steep climb in global surface temperatures observed over the 20th century appeared to level off. This “hiatus” received considerable attention, despite the fact that the full observational surface temperature record shows many instances of slowing and acceleration in warming rates. Scientists had previously suggested that factors such as weak solar activity and increased heat uptake by the oceans could be responsible for the recent lull in temperature increases. After publication of a 2011 paper in the journal Science by Susan Solomon of the Massachusetts Institute of Technology (MIT), it was recognized that an uptick in volcanic activity might also be implicated in the “warming hiatus.”

Prior to the 2011 Science paper, the prevailing scientific thinking was that only very large eruptions – on the scale of the cataclysmic 1991 Mount Pinatubo eruption in the Philippines, which ejected an estimated 20 million metric tons (44 billion pounds) of sulfur – were capable of impacting global climate. This conventional wisdom was largely based on climate model simulations. But according to David Ridley, an atmospheric scientist at MIT and lead author of the November GRL paper, these simulations were missing an important component of volcanic activity.

Ridley and colleagues found the missing piece of the puzzle at the intersection of two atmospheric layers, the stratosphere and the troposphere – the lowest layer of the atmosphere, where all weather takes place. Those layers meet between 10 and 15 kilometers (six to nine miles) above the Earth.

Satellite measurements of the sulfuric acid droplets and aerosols produced by erupting volcanoes are generally restricted to above 15 km. Below 15 km, cirrus clouds can interfere with satellite aerosol measurements. This means that toward the poles, where the lower stratosphere can reach down to 10 km, the satellite measurements miss a significant chunk of the total volcanic aerosol loading.

To get around this problem, the study by Ridley and colleagues combined observations from ground-, air- and space-based instruments to better observe aerosols in the lower portion of the stratosphere. They used these improved estimates of total volcanic aerosols in a simple climate model, and estimated that volcanoes may have caused cooling of 0.05 degrees to 0.12 degrees Celsius since 2000.

The second Livermore-led study shows that the signals of these late 20th and early 21st eruptions can be positively identified in atmospheric temperature, moisture and the reflected solar radiation at the top of the atmosphere. A vital step in detecting these volcanic signals is the removal of the “climate noise” caused by El Niños and La Niñas.

“The fact that these volcanic signatures are apparent in multiple independently measured climate variables really supports the idea that they are influencing climate in spite of their moderate size,” said Mark Zelinka, another Livermore author. “If we wish to accurately simulate recent climate change in models, we cannot neglect the ability of these smaller eruptions to reflect sunlight away from Earth.”

Reference:
Geophysical Research Letters, onlinelibrary.wiley.com/enhanc… 0.1002/2014GL062366/

Note : The above story is based on materials provided by Lawrence Livermore National Laboratory.

Rock art draws scientists to ancient lakes

Some of the purported “swimmers” in the Cave of the Swimmers, Egypt. Credit: NASA Photo/Chris McKay

Life imitates art. And sometimes science does the same.

Seven thousand year-old rock paintings in the Sahara desert have, somewhat serendipitously, helped uncover evidence of ancient lake beds.

Researchers discovered the mineral remnants of the lake while studying a region well-known for its rock art. The most famous example is the Cave of the Swimmers, which provided a setting in the movie “The English Patient.” The drawings in the cave depict humans that appear to be swimming, floating and diving. And yet this area in southwestern Egypt is one of the driest in the world.

The generally-accepted explanation is that the climate was much wetter in the past, supporting not only the possibility of a swimming hole, but also abundant animal life, such as cows, giraffes and ostriches, which were also drawn or carved into the region’s rocks.

Scientists have previously found support for this local change in climate in ancient lake beds and other geologic data, but most of these lakes pre-date the rock art by many thousands of years. Until now, no one had identified any evidence of a relatively recent, semi-permanent lake that could have served as a swimming hole for the local rock artists.

“Indeed, we found that there were lakes not far from the Cave of the Swimmers,” says Chris McKay from the NASA Ames Research Center.

Earlier this year, McKay and his colleagues—Margarita Marinova from the Bay Area Environmental Research Institute and Nele Meckler of ETH Zurich—reported on carbonate deposits lining the walls of two neighboring valleys in the Gebel Uweinat region, which is about 200 kilometers south of the Cave of the Swimmers.

“The deposits look like a ‘bathtub ring’ around the canyon walls,” McKay says.

The ring-shape and mineral content of the deposits imply that they formed in shallow water along a lake shoreline. From carbon dating, McKay and his colleagues estimate that the two inferred lakes existed about 8,100 and 9,400 years ago, respectively.

The age of the lakes seems about right that one could bravely speculate that the prehistoric men or women who decorated the Cave of the Swimmers either knew of the lakes or perhaps even swam in one of them on a wandering voyage.

The research—presented in the Journal of African Earth Sciences—was partly funded by the NASA Astrobiology Program.

Wading through cave art

The Cave of the Swimmers has captivated imaginations ever since it was discovered by the Hungarian explorer László Almásy in 1933. The shallow cave’s paintings are about 7,000 years old, give or take a thousand years, and show human figures performing what looks like a kind of Neolithic doggy paddle.

Confronted by the seeming inconsistency of swimmers in a desert landscape, Almásy hypothesized that the artists were realistically depicting their surroundings and that the climate had in fact been wetter back then.

The cave and Almásy himself inspired Michael Ondaatje’s book “The English Patient,” and the film that followed with the same name.

However, it should be noted that researchers now question the original interpretation of “swimming.”

“The ‘swimmers’ move towards ‘headless beasts’ in a straight line, more as if floating in air than swimming” says Andras Zboray, a Sahara explorer and rock art researcher. “They are clearly symbolic, as are the beasts, with an unknown meaning.”

Rock art depicting a white cow. Credit: NASA Photo/Chris McKay


Still, the idea that water was much more abundant in this part of the Sahara several thousand years ago is supported by other prehistoric art in the region. Other caves and rocks show scenes of pastoral animals, which would have been unable to survive in the current dry conditions.

“Both [of the newly-discovered] lakes are located in areas with an exceptionally rich concentration of rock art sites in the immediate vicinity, and I suspect this cannot be a coincidence,” Zboray says.

Lake residents

As compelling as this connection between art and past climate may be, McKay did not venture into the Sahara to study ancient human artifacts, nor to look for dried-up lakes. He and co-author Marinova went to the Egyptian desert to study rock-clinging microbes with the purpose of finding out how these organisms can survive under such extreme conditions, and whether they can give us any clues to potential life on Mars.

“Our scientific interest is the dry limit of photosynthesis, so we wanted to go to the driest part of the Sahara,” McKay says.

But exploring this harsh environment is logistically challenging. For this reason, McKay and Marinova joined an archaeology group led by Zboray that was going to Gebel Uweinat to study the local rock art.

During one of their excursions, McKay noticed mineral deposits that reminded him of other work he has done on lake sediments. The geologic features partially resemble dried-up sponges, and were found in two valleys separated by about 5 kilometers.

McKay and his colleagues took a few samples and measured the mineral composition to be primarily carbonate. The horizontal alignment of the deposits and their unique structure indicates that they formed in long-term standing water. The team concluded that each valley must have supported a relatively stable lake.

“The size of the lakes would probably have been large enough to do laps,” McKay says.

Zboray finds fascinating the confirmation of standing bodies of freshwater in Gebel Uweinat roughly 9,000 year ago, but it raises a number of yet unanswered questions.

“The obtained dates are surprisingly old, and appear to considerably pre-date the bulk of the rock art,” Zboray says. The caves in the surrounding area have abundant cattle paintings that are dated as 6,500 to 5,500 years old.

“So there is a clear temporal disconnect,” he says.

Zboray is also puzzled by the local geography. The lakes could have formed from a natural dam, and they could have been fed by rainfall. However, in this case, the lake levels would have likely gone up and down with strong evaporation and infrequent rainfall.

“One plausible explanation is that the lakes were fed by some artesian source that could keep them at the same level for an extended time period, only limited by the height of the barrier blocking the valley,” Zboray says.

He has plans to go back to the area to better map out the extent of the deposits and to look for remnants of the presumed barrier.

Microbial rock art

The mineral deposits themselves tell a story about life in and around the lake.

The carbonate has a morphologically-distinct structure that typically forms only in water that contains microbes. The organisms alter the pH, affecting how the carbonate precipitates out of solution.

“The carbonate is a macroscopic remnant of microscopic life,” McKay explains.

These biologically-triggered formations, or “microbialites,” are found around the world at places such as Pavilion Lake in Canada and Lake Alchichica in Mexico.

Darlene Lim from NASA Ames agrees that the deposits found by McKay’s group are similar to the microbialites she studies as the principal investigator for the Pavilion Lake Research Project.

“The fundamental difference between the two is that the Pavilion Lake microbialites can grow to a larger size, and at times they are less consolidated than those reported in the waters of Gebel Uweinat,” Lim says. “However, the microbialites described by Marinova et al. may have undergone some erosion, and as such their maximum size remains unknown.”

Astrobiologists are very interested in microbialites as they could be a possible red flag for past life on Mars.

“We are not going to find dinosaur fossils on Mars,” McKay says.

But a bathtub ring of carbonates is something that one of our rovers might potentially roll up to, he says.

Lim, however, is not convinced a rover has the capabilities to deal with the serendipitous nature of scientific discovery.

“What I hope is that someday soon a human will be able to apply their training, knowledge, and instincts, to find their way to a discovery on Mars that mirrors what Marinova et al. found in the Gebel Uweinat region,” Lim says.

Note : The above story is based on materials provided by Astrobio.net
This story is republished courtesy of NASA’s Astrobiology Magazine. Explore the Earth and beyond at www.astrobio.net .

On a tropical island, fossils reveal the past and possible future of polar ice

UF geochemist Andrea Dutton (right) and Jody Webster of the University of Sydney (left) study a limestone outcrop containing fossil corals in Seychelles.

The balmy islands of Seychelles couldn’t feel farther from Antarctica, but their fossil corals could reveal much about the fate of polar ice sheets.

About 125,000 years ago, the average global temperature was only slightly warmer, but sea levels rose high enough to submerge the locations of many of today’s coastal cities. Understanding what caused seas to rise then could shed light on how to protect those cities today.

By examining fossil corals found on the Indian Ocean islands, University of Florida geochemist Andrea Dutton found evidence that global mean sea level during that period peaked at 20 to 30 feet above current levels. Dutton’s team of international researchers concluded that rapid retreat of an unstable part of the Antarctic ice sheet was a major contributor to that sea-level rise.

“This occurred during a time when the average global temperature was only slightly warmer than at present,” Dutton said.

Dutton evaluated fossil corals in Seychelles because sea level in that region closely matches that of global mean sea level. Local patterns of sea-level change can differ from global trends because of variations in the Earth’s surface and gravity fields that occur when ice sheets grow and shrink.

In an article published in the January 2015 issue of Quaternary Science Reviews, the researchers concluded that while sea-level rise in the Last Interglacial period was driven by the same processes active today—thermal expansion of seawater, melting mountain glaciers and melting polar ice sheets in Greenland and Antarctica—most was driven by polar ice sheet melt. Their study, partially funded by the National Science Foundation, also suggests the Antarctic ice sheet partially collapsed early in that period.

“Following a rapid transition to high sea levels when the last interglacial period began, sea level continued rising steadily,” Dutton said. “The collapse of Antarctic ice occurred when the polar regions were a few degrees warmer than they are now—temperatures that we are likely to reach within a matter of decades.”

Several recent studies by other researchers suggest that process may have already started.

“We could be poised for another partial collapse of the Antarctic ice sheet,” Dutton said.

Reference:
Andrea Dutton, Jody M. Webster, Dan Zwartz, Kurt Lambeck, Barbara Wohlfarth. Tropical tales of polar ice: evidence of Last Interglacial polar ice sheet retreat recorded by fossil reefs of the granitic Seychelles islands. Quaternary Science Reviews, 2015; 107: 182 DOI: 10.1016/j.quascirev.2014.10.025

Note : The above story is based on materials provided by University of Florida.

What makes pink diamonds pink?

This 59.6-carat pink diamond was auctioned by Sotheby’s in 2013 Credit : BBC

They’re one of the world’s rarest jewels – but nobody knows for certain why pink diamonds are pink.

That hasn’t stopped investors from snapping them up at auction and sending prices skyrocketing. In October a new world record was set at a Sotheby’s sale in Hong Kong when an 8.41-carat pink diamond sold for $17,768,041 (£11,438,714) – more than $2.1m (£1.8m) a carat.

“Everybody’s talking about them, and everybody loves them,” says Jeffrey Post, curator of the National Gem and Mineral Collection at the Smithsonian’s National Museum of Natural History in Washington, DC. “Yet you can’t tell people why they’re pink.”

Other diamonds get their colour from chemical impurities that absorb light. Yellow diamonds contain traces of nitrogen, and blue diamonds contain boron. But no similar impurities have been found in pink diamonds, leading scientists to speculate that the colour may be the result of some kind of seismic shock that altered the stone’s molecular structure.

It’s now hoped that a cache of brown and pink diamonds from the Argyle mine in Western Australia may solve the mystery. The mine, owned by Rio Tinto, is the world’s largest source of pink diamonds, even though they’re so rare that only a few are produced each year.

As well as revealing what makes them pink, scientists hope that studying the diamonds will tell them more about the history of the planet.

Diamonds are the Earth’s messengers, says Post. “They come from a hundred miles below the surface and tell us about a part of the Earth that we can’t visit. They’re also giving us a peek back in time because most diamonds formed about two to three billion years ago.

“Each one is a time capsule, and the pink diamonds, because they’re different from all the other diamonds, have a different part of the story to tell.”

Scientists have already examined the Argyle diamonds using a mass spectrometer to try to find any trace of impurities that may be causing the pink colour. The machine agitates the diamonds and analyses the chemical structure of the atoms that are released.

“There is no impurity that we’ve been able to associate so far with the pink colour in diamonds,” says Post. “Spectroscopic measurements don’t show you any additional features that you can ascribe to a particular colouring agent.”

They’ve also used a focused ion beam to cut a tiny trench in the surface of the diamonds and remove a sliver that can be measured under a powerful electron microscope. They’ve discovered that most pink diamonds are not uniformly pink but have pink zones that alternate with clear areas.

The zones, known as twin planes, were formed by some kind of shock – possibly the result of volcanic activity that propelled the diamonds to the surface or from something that happened to them as they were being formed deep underground.

“The twin plane itself should not give rise to colour,” says Post. “But we think when those twin planes form, and slide back and forth, one against the other like a fault plane, that certain kinds of defects formed. The defects give us the pink colour. But what we’ve not been able to do yet is find the specific kind of defect.”

Although pink diamonds are among the most valuable jewels today, 20 years ago they were little more than a geological curiosity. Sales have been driven by savvy marketing and a growing appreciation of their uniqueness.

“It really comes down to the rarity,” says Richard Revez, a gem expert at Florida-based Kravit Estate Department. “When you talk about coloured diamonds, they’re already in the elite 1% produced in the world. Pink diamonds are the 1% of the 1%.”

He says the most sought-after diamonds are actually red, but orange, green, blue and yellow are highly desirable. An orange diamond attracted the highest price paid per carat for any diamond at auction last year, selling for $35m, or $2.4m a carat.

“We’ve craved diamonds for millennia,” says Revez. The first gems were probably discovered on river banks in India, but their existence is recorded in Greek and Roman history. “It was believed there was a vein that ran directly from the heart to the ring finger – that’s why we wear (diamonds) on our ring fingers. And Cupid’s arrows were tipped with diamonds to pierce the heart easier,” he says.

Archduke Maximilian of Austria is believed to have started the tradition of diamond engagement rings among the upper classes when he presented one to Mary of Burgundy in 1477.

But it wasn’t until the 1950s that international standards to grade diamonds were set by the Gemological Institute of America (GIA), a classification system that is still used today.

But only science can reveal why pink diamonds are pink.

Pink diamonds can be artificially created, says the Smithsonian’s Post. And the only way to tell if it’s a synthetic stone is to understand what causes the colour to occur naturally.

“Then I can tell you for sure that that is a diamond that came out of the earth as opposed to one that came out of somebody’s laboratory. It can make the difference of millions of dollars in the value of a single diamond, knowing whether it is a natural pink or not.”

Note : The above story is based on materials provided by BBC News. The original article was written by Jane O’Brien.

Significant Rare Earth Element Claim Discovery in Peru Reported

Global rare earth element production (1 kt=106 kg) from 1950 through 2000, in four categories: United States, almost entirely from Mountain Pass, California; China, from several deposits; all other countries combined, largely from monazite-bearing placers; and global total. Four periods of production are evident: the monazite-placer era, starting in the late 1800s and ending abruptly in 1964; the Mountain Pass era, starting in 1965 and ending about 1984; a transitional period from about 1984 to 1991; and the Chinese era, beginning about 1991. Credit : U.S. Geological Survey

RioSol SAC LLC and Compania Minera Rio Sol SAC (“RioSol” or “The Company”) on Dec. 30, 2014 announced a significant rare earth element and poly-metallic claim discovery in Peru, with reports indicating the 10-kilometer claim as among the largest rare earth claims in Peru containing both light rare earth elements (LREEs) and heavy rare earth elements and metals (HREEs).

Third-party geology and geochemical analysis indicates the claim is the largest in Peru, with further exploration warranted to further delineate the size and scale of the claim.

The geology consultants leading the project were Rildo Oscar Rodriguez and a Peruvian rare earth expert, both of Lima. According to Mr. Rodriguez, “The claim is one of the newest rare earth finds in all of Latin America that contains both light and heavy rare earth elements and metals, as well as copper, zinc, aluminum and other base metals. It proves that the potential for rare earth elements exists outside of China with significant opportunity for development of new production in a mining-friendly country.”

Currently, approximately 90-95 percent of rare earth elements are located in China. Having a supply source in the Americas for commodities used today and in the future will be important for geographic diversity and commercial competition.

Over the past two years, RioSol has been testing the claim, initially focused on base metals. However, rare earths were discovered in recent field explorations and assay results, and further testing was conducted. Both the rare earth geologist and RioSol general manager Max Cruz will be presenting the results of the discovery at PROEXPLO 2015, the 9th International Congress of Prospectors and Explorers in May.

The claim area is located approximately 95 kilometers northwest of Cusco, Peru.

Rare earth elements are a group of 17 chemical elements that occur together in the periodic table. The group consists of yttrium and the 15-lanthanide elements (lanthanum, cerium, praseodymium, neodymium, promethium, samarium, europium, gadolinium, terbium, dysprosium, holmium, erbium, thulium, ytterbium, and lutetium). Scandium is found in most rare earth element deposits and is sometimes classified as a rare earth element.

The rare earth elements are all metals, and the group is often referred to as “rare earth metals.” These metals have many similar properties and that often causes them to be found together in geologic deposits. They are also referred to as “rare earth oxides” because many of them are typically sold as oxide compounds.

Note : The above story is based on materials provided by PR Newswire Association LLC.

How the ‘beast quake’ is helping scientists track real earthquakes

Seismologists interpret the shaking from the original Beast Quake on Jan. 8, 2011, when Seahawks fans literally rocked the stadium. Credit: Pacific Northwest Seismic Network

It’s not just the football players who have spent a year training. University of Washington seismologists will again be monitoring the ground-shaking cheers of Seahawks fans, this year with a bigger team, better technology and faster response times.

Scientists with the Pacific Northwest Seismic Network will install instruments this Thursday to provide real-time monitoring of the stadium’s movement during the 2015 NFL playoffs.

This year, the UW researchers have also upped their game. A new QuickShake tool will provide a faster connection between the sensors and the website. This Saturday will be the first test of the software that displays vibrations within three seconds — five to 10 times faster and more reliably than readings from the same sensors installed last year.

The Pacific Northwest Seismic Network monitors earthquake and volcanic activity throughout the region. Network scientists first got interested in football when a seismometer a block away from the stadium showed vibrations during Marshawn Lynch’s legendary Jan. 8, 2011, touchdown run. The resulting seismograph became a celebrity in its own right and coined the term “Beast Quake.”

After a couple of quieter years, the group got permission last year to place two strong-motion earthquake sensors inside the stadium. The project was a huge hit and the group added a third sensor for the 2014 playoff game.

A Beast Quake happens when the energetic jumping and stomping of so many fans at once shakes the stadium and reverberates through the surrounding soil. Seahawks fans also generate record-breaking noise, of course, but sound waves don’t rock the building. A guaranteed shaking event with significant public interest is a great test case.

“We’re mostly interested in the speed and the reliability of the communications,” said John Vidale, a UW professor of Earth & space sciences and director of the seismic network. “It’s hard to simulate thousands of people using this tool all at once. When we can get a lot of people looking, we can see problems that we’d encounter during an actual earthquake.”

For fans at home, the faster data transfer means that TV viewers may get a tipoff to a big play they’ll see on the screen after the 10-second broadcast delay. The researchers have dubbed them “Early Football Rowdiness Warnings.”

The foot-stomping is a real-world test of technology to detect the bigger shaking that originates underground. The seismic group is working with the U.S. Geological Survey to offer early warnings for the Pacific Northwest that could provide tens of seconds to several minutes’ notice of an incoming strong shaking. This year some public agencies and large businesses will have a first chance to try out the system that will eventually be available to the public.

“The Seahawks experiment should provide us and the Internet-connected public with a feel for the minimum time early warning might provide,” said Steve Malone, a UW professor emeritus of Earth & space sciences. “In this case it’s football fan activity that generates a signal as a warning for what shows up on TV some seconds later. In the future, it might be seconds to minutes of warning after an earthquake starts.”

This weekend the group will be beefing up its social-media presence to post updates and respond to questions during the game. That also helps get ready for an emergency situation.

“During the rumblings on Mt. St. Helens a decade ago there was a huge influx of Web visits and phone calls,” Malone said. “Now with social media, it’s a whole new ballgame. We’ve got to learn how to deal with that because it’s going to snow us over if we’re not prepared.”

The group will have more staff monitoring social media during the game, and more robust websites that they hope won’t slow down or crash during heavy traffic.

On the scientific side, they hope to explore the different readings between the three sensors placed at different levels. They also hope to explain some mysterious patterns of shaking during commercial breaks, what one researchers hypothesizes may be a “dance quake.”

Several researchers will be at the UW campus lab Saturday monitoring the sensors. Two group members will be at the stadium providing eyes on the ground to help explain what could be causing any unusual spikes. They will be rooting for a victory for the Seahawks — and for science.

“We’re developing these new Web tools, and monitoring the game really motivates everyone to get excited,” Vidale said, “and we’re rooting for a second helping of roars and rumbles against the Packers or Cowboys to perfect the system.”

Note : The above story is based on materials provided by University of Washington. The original article was written by Hannah Hickey.

Levitation recreates nature’s dumbbells

Dr Kyle Baldwin. Credit: Image courtesy of University of Nottingham

Using magnetic levitation to imitate weightlessness, researchers led by physicists at The University of Nottingham have manufactured solid wax models of splash form tektites. Dr Kyle Baldwin from the School of Physics and Astronomy, said: “These wax models provide the first direct experimental validation for numerical models of the equilibrium shapes of spinning droplets. This research is of importance to fundamental physics and also to study of tektite formation.”

Splash form tektites are tiny pieces of natural glass created out of spinning drops of molten rock flung from the earth during an extra-terrestrial impact — when the earth is hit by asteroids or comets. They come in a myriad of shapes — from dumbbell to doughnut — and the formation of these shapes has been the subject of scientific investigation for centuries. Using magnetic levitation to imitate weightlessness, researchers led by physicists at The University of Nottingham have manufactured solid wax models of these shapes. Dr Kyle Baldwin from the School of Physics and Astronomy, said: “These wax models provide the first direct experimental validation for numerical models of the equilibrium shapes of spinning droplets. This research is of importance to fundamental physics and also to study of tektite formation.”

Until now the shapes of rapidly spinning, highly deformed droplets have been derived entirely from numerical simulations. It is hoped this new experimental technique can be used to better reproduce and understand tektite formation. Their research — Artificial tektites: an experimental technique for capturing the shapes of spinning drops — funded by the Engineering and Physical Sciences Research Council (EPSRC) is published today in the online, open access journal Scientific Reports. The video can be seen here.

A droplet of liquid in space is spherical, but spin it and it forms all kinds of shapes from squashed balls to bone-shaped, depending on its rate of spin. Atomic nuclei, planets, including planet Earth, stars, and even black holes are deformed by their spin for the same reasons as a liquid droplet, as are tektites.

Just back from presenting his research at the 2014 American Geophysical Union’s Fall Meeting — the largest Earth and space science meeting in the world — Dr Kyle Baldwin said: “As you can imagine the creation of these tiny objects is difficult to reproduce in the lab. There aren’t many materials that can contain molten rock, and even then you need to spin and cool a single droplet of it simultaneously.”

These tiny glass objects are found mainly in Australasia, Central Europe, North America and the Ivory Coast — in areas associated with extra-terrestrial impacts.

When an asteroid hits the Earth, it creates a large, very hot, zone of impact material. Under very specific impact conditions, this rock melts and is splashed out in all directions. Exactly what these conditions are remains a topic of debate today. These droplets of splashed rock often have rotation imparted by the impact. The act of rotation changes the shape of the drop, depending on how fast it is spinning. It deforms them towards a more flattened sphere, and then eventually to a “dumb-bell” shape as it becomes unstable and pulls apart.

The drops of molten rock spin, change shape, but then crucially, due to the fact that they are cooling as they travel through the atmosphere, solidify into the shape that they formed. Some of these shapes then survive impact with the Earth and are later collected by teams of geologists and studied to examine both the type of rock that the asteroid impacted and the age of the impacted the onlinrock, to correlate with known impact sites and prehistoric extinction events, or find impact sites that have not yet been discovered.

Dr Baldwin said: “What I have done is realise that, using magnetic levitation and drops of wax, you can artificially recreate this process. By melting the wax on a hot plate, pipetting it into the magnetic field, spinning it up and then allowing it to cool, we can recreate some of the conditions that tektites are under as they form. We have primarily used this technique to measure the theoretical shapes of spinning drops, something that has never been done experimentally.”

Dr Baldwin entered this field of research as a postdoc. Working alongside Dr Richard Hill they began looking into levitating and spinning droplets. Using diamagnetic levitation to counteract the gravitational force on the droplet they were able to manufacture ‘artificial tektites’ from spinning molten wax droplets.

Dr Baldwin said: “You could effectively remove gravity by going into orbit, or you could take a parabolic flight but it wouldn’t be long enough. We use super conducting magnets to levitate liquids that are diamagnetic.”

Dr Hill, also from the School of Physics and Astronomy at The University of Nottingham, has been interested in the shapes formed by spinning droplets for some time. Together with Professor Laurence Eaves he published a paper in 2008 on the observation of ‘three-lobed’ or ‘triangular’ spinning droplets.

He said: “Kyle started working with me on this project just over two years ago. When he arrived, he had the brilliant idea of levitating molten wax and spinning it as it solidified, to capture its shape. We saw that the measurements could be used to validate numerical models of highly deformed spinning liquid droplets, relevant to nuclear physics and also to rapidly spinning astronomical objects.”

The research was carried out in collaboration with Professor Samuel Butler from the Department of Geological Sciences at the University of Saskatchewan, Canada. Professor Butler has previously published papers on simulating tektite formation. He provided supporting simulation evidence that the shapes created by Dr Baldwin were the true equilibrium shapes of spinning liquid droplets allowed them to compare their results, sophisticated modern numerical simulations and calculations from literature.

Reference:
Kyle A. Baldwin, Samuel L. Butler, Richard J. A. Hill. Artificial tektites: an experimental technique for capturing the shapes of spinning drops. Scientific Reports, 2015; 5: 7660 DOI: 10.1038/srep07660

Note : The above story is based on materials provided by University of Nottingham.

Study casts doubt on mammoth-killing cosmic impact

Large asteroid hitting Earth (stock illustration). Credit: © Mopic / Fotolia

Rock soil droplets formed by heating most likely came from Stone Age house fires and not

from a disastrous cosmic impact 12,900 years ago, according to new research from the University of California, Davis. The study, of soil from Syria, is the latest to discredit the controversial theory that a cosmic impact triggered the Younger Dryas cold period.

The Younger Dryas lasted a thousand years and coincided with the extinction of mammoths and other great beasts and the disappearance of the Paleo-Indian Clovis people. In the 1980s, some researchers put forward the idea that the cool period, which fell between two major glaciations, began when a comet or meteorite struck North America.

In the new study, published online in the Journal of

The Younger Dryas, the period being studied by UC Davis and other earth scientists, coincided with the extinction of mammoths and other great beasts and the disappearance of the Paleo-Indian Clovis people. (Thinkstock image

Archaeological Science, scientists analyzed siliceous scoria droplets — porous granules associated with melting — from four sites in northern Syria dating back 10,000 to 13,000 years ago. They compared them to similar scoria droplets previously suggested to be the result of a cosmic impact at the onset of the Younger Dryas.

“For the Syria side, the impact theory is out,” said lead author Peter Thy, a project scientist in the UC Davis Department of Earth and Planetary Sciences. “There’s no way that can be done.”

The findings supporting that conclusion include:

  • The composition of the scoria droplets was related to the local soil, not to soil from other continents, as one would expect from an intercontinental impact.
  • The texture of the droplets, thermodynamic modeling and other analyses showed the droplets were formed by short-lived heating events of modest temperatures, and not by the intense, high temperatures expected from a large impact event.
  • And in a key finding, the samples collected from archaeological sites spanned 3,000 years. “If there was one cosmic impact,” Thy said, “they should be connected by one date and not a period of 3,000 years.”

So if not resulting from a cosmic impact, where did the scoria droplets come from? House fires. The study area of Syria was associated with early agricultural settlements along the Euphrates River. Most of the locations include mud-brick structures, some of which show signs of intense fire and melting. The study concludes that the scoria formed when fires ripped through buildings made of a mix of local soil and straw.

Reference:
P. Thy, G. Willcox, G.H. Barfod, D.Q. Fuller. Anthropogenic origin of siliceous scoria droplets from Pleistocene and Holocene archaeological sites in northern Syria. Journal of Archaeological Science, 2015; 54: 193 DOI: 10.1016/j.jas.2014.11.027

Note : The above story is based on materials provided by University of California – Davis.

Electromagnetic waves linked to particle fallout in Earth’s atmosphere, new study finds

Dartmouth researchers and their BARREL (Balloon Array for Radiation belt Relativistic Electron Losses) colleagues launch instrument-laden balloons at lower altitudes above Antarctica to assess the fallout of electrons from the Earth’s radiation belts. Credit: Dartmouth College

In a new study that sheds light on space weather’s impact on Earth, Dartmouth researchers and their colleagues show for the first time that plasma waves buffeting the planet’s radiation belts are responsible for scattering charged particles into the atmosphere.

The study is the most detailed analysis so far of the link between these waves and the fallout of electrons from the planet’s radiation belts. The belts are impacted by fluctuations in “space weather” caused by solar activity that can disrupt GPS satellites, communication systems, power grids and manned space exploration.

The results appear in the journal Geophysical Research Letters. A PDF is available on request.

The Dartmouth space physicists are part of a NASA-sponsored team that studies the Van Allen radiation belts, which are donut-shaped belts of charged particles held in place by Earth’s magnetosphere, the magnetic field surrounding our planet. In a quest to better predict space weather, the Dartmouth researchers study the radiation belts from above and below in complementary approaches — through satellites (the twin NASA Van Allen Probes) high over Earth and through dozens of instrument-laden balloons (BARREL, or Balloon Array for Radiation belt Relativistic Electron Losses) at lower altitudes to assess the particles that rain down.

The Van Allen Probes measure particle, electric and magnetic fields, or basically everything in the radiation belt environment, including the electrons, which descend following Earth’s magnetic field lines that converge at the poles. This is why the balloons are launched from Antarctica, where some of the best observations can be made. As the falling electrons collide with the atmosphere, they produce X-rays and that is what the balloon instruments are actually recording.

“We are measuring those atmospheric losses and trying to understand how the particles are getting kicked into the atmosphere,” says co-author Robyn Millan, an associate professor in Dartmouth’s Department of Physics and Astronomy and the principal investigator of BARREL. “Our main focus has been really on the processes that are occurring out in space. Particles in the Van Allen belts never reach the ground, so they don’t constitute a health threat. Even the X-rays get absorbed, which is why we have to go to balloon altitudes to see them.”

In their new study, the BARREL researchers’ major objective was to obtain simultaneous measurements of the scattered particles and of ionoized gas called plasma out in space near Earth’s equator. They were particularly interested in simultaneous measurements of a particular kind of plasma wave called electromagnetic ion cyclotron waves and whether these waves were responsible for scattering the particles, which has been an open question for years.

The researchers obtained measurements in Antarctica in 2013 when the balloons and both the Geostationary Operational Environmental Satellite (GOES) and Van Allen Probe satellites were near the same magnetic field line. They put the satellite data into their model that tests the wave-particle interaction theory, and the results suggest the wave scattering was the cause of the particle fallout. “This is the first real quantitative test of the theory,” Millan says.

Reference:
Zan Li, Robyn M. Millan, Mary K. Hudson, Leslie A. Woodger, David M. Smith, Yue Chen, Reiner Friedel, Juan V. Rodriguez, Mark J. Engebretson, Jerry Goldstein, Joseph F. Fennell, Harlan E. Spence. Investigation of EMIC wave scattering as the cause for the BARREL 17 January 2013 relativistic electron precipitation event: A quantitative comparison of simulation with observations. Geophysical Research Letters, 2014; DOI: 10.1002/2014GL062273

Note : The above story is based on materials provided by Dartmouth College.

Years-long ‘silent quake’ unleashed Fukushima tsunami

An aerial photo shows the quake-damaged Fukushima Dai-Ni nuclear power plant in the town of Naraha and Tomioka in the Futaba district of Fukushima prefecture on March 12, 2011

The earthquake that set off the tsunami which caused the Fukushima nuclear plant disaster was unleashed by a stealthy nine-year buildup of pressure on a plate boundary, scientists said Tuesday.

Part of a fault where two mighty plates on the Earth’s crust collide east of Japan was being quietly crushed and twisted for nearly a decade, they said.

It was this hard to detect activity which caused the fault eventually to rip open on March 11, 2011 and cause the catastrophe.

The deformation “increased the stress in the source region… and finally triggered the earthquake,” said study co-author Kazuki Koketsu of the University of Tokyo.

“It had an impact on the occurrence time of the earthquake,” Koketsu told AFP by email. “It advanced the time (of the quake) by about one year.”

The earthquake, occurring below the Pacific floor about 200 kilometres (120 miles) east of the east coast city of Sendai, was one of the biggest ever recorded, measuring 9.0 on the moment magnitude scale.

The sea bottom shifted by about 27 metres (88 feet), causing a massive tsunami that sparked the Fukushima disaster and left 18,000 people dead or missing.

The fault lies on the Japan Trench, where the Pacific plate dives beneath the North American plate on which the Japanese archipelago lies.

Subduction faults like these have been responsible for some of the world’s most devastating quakes.

But they are also notoriously difficult to monitor, given that events are as rare as they are massive. Centuries may elapse between occurrences, which means the danger could be undocumented.

Koketsu and colleague Yusuke Yokota looked at data supplied by the GeoNet network of Global Positioning System (GPS) stations dotted across Japan.

They used the data to build a map of ground movement in the Tohoku and Kanto districts from March 21, 1996 to March 8, 2011—a day before a 7.3-magnitude foreshock.

The team had to strip out seismic noise from relatively smaller earthquakes nearby in order to expose the background signals—the long, agonising deformation on the Japan Trench.

The research builds on previous initiatives to harness GeoNet data, which has millimetric accuracy of land motion.

“Our paper proved that a network of GPS stations can monitor a slow event which may lead to a great subduction earthquake,” said Koketsu.

But, he cautioned: “It has not yet been proven that a slow event always occurs prior to every great subduction earthquake.”

The paper appears in the journal Nature Communications.

Reference:
Nature Communications, http://nature.com/articles/DOI: 10.1038/ncomms6934

Note : The above story is based on materials provided by AFP.

Researchers discover scientific surprise studying underwater methane seeps

Natural methane seeps off the U.S. coast may have been active for thousands of years. 2013 Northeast U.S. Canyons Expedition/NOAA Okeanos Explorer Program

Methane seeps—ever heard of them?

You might have this past summer. That’s when the national news media featured stories about a recent discovery of hundreds of methane seeps—where methane gas bubbles up from the sea floor—in the North Atlantic Ocean. The discussion about this scientific find typically turned to important questions about the methane’s impact on climate change, but there is another interesting question about methane seeps.

What are the creatures and ecosystems that exist there?

Researchers at Indiana State University have been studying methane seep ecosystems for a number of years, making trips underwater to investigate the unique association of organisms that live there. On their most recent trip to study seeps, Indiana State scientists made a big discovery regarding a tiny creature that lives in both seep and non-seep habitats.

In collaboration with Scripps Institute of Oceanography and California Institute of Technology, an Indiana State professor, graduate and undergraduate students embarked on a series of cruises to the methane seeps near Oregon and Costa Rica in 2010. With little previously known about the biological communities living in and around the rocks common in these deep-sea environments, researchers pursued a variety of investigations to learn more about the organisms and ecosystems at different seep habitats and nearby non-seep environments.

One investigation, led by Indiana State professor Tony Rathburn and doctoral student Ashley Burkett, stumbled upon an overabundance of a microscopic organism—a species of “benthic foraminifera”—that could change how scientists understand past environments.

“We found over 1,000 individuals of this specific species,” Burkett said. “The species is really interesting for us, and it’s used to figure out what the climate was like in the geologic past.”

Living on the sea floor, benthic foraminifera are microscopic creatures that produce an equally microscopic shell. The particular species of foraminifera that Rathburn and Burkett found was previously thought only to live in environments with high levels of dissolved oxygen. When scientists have found the shells of this creature in the fossil record, they have thought that the presence of the species indicated a well-oxygenated environment at a specific time in geologic history. With that idea in mind, scientists have developed a concept of what the ocean and climate was like in the past.

So, finding this species in abundance in both seep and non-seep environments where oxygen is limited was unexpected. Based on their research, Rathburn and Burkett speculate that it’s not the abundance of oxygen that determines where these creatures are located. It may simply be that they’re present where there are hard surfaces on the sea floor for them to live on.

“Scientists have used the presence of the species as an indicator of well-oxygenated environments,” Burkett said. “But this may not be the case. It may have been that there was an absence of nice rocks to colonize in the soupy sediments of poorly oxygenated environments.”

This important find was also just as unintended as it was unexpected. Rathburn and Burkett came upon these foraminifera while conducting a multifaceted seafloor experiment. Their original intent was to determine how long the tissue of foraminifera would remain on the sea floor after death. But to their delight, they got more than they asked for thanks to, of all things, plastic.

For their original experiment, they had placed test subjects inside a steel cage wrapped in plastic mesh, and this contraption was pushed half way into the sea floor sediment. Rathburn and Burkett chose the plastic mesh, because it was durable, easy to use and wouldn’t deteriorate quickly. But it turns out that the mesh was a foraminifera magnet – after a year on the sea floor, the creatures had colonized on the plastic.

“We pulled the cages up (from the sea floor), and I started to disassemble them. We were looking at the tops of the cages and commented that there was all this goo on them …. One of us said, ‘We should look at this.'”

And look she did. Using a microscope, Burkett examined the “goo” and discovered this unexpected creature. Many hours were spent painstakingly picking off all the foraminifera—about a thousand of them—from the cages, and examining the data.

Burkett presented her surprise findings this past October to the scientific community at a meeting of the Geologic Society of America in Vancouver, Canada. The response was positive.

“At this meeting, we shocked people with our results,” Rathburn said. “(Our research) will shake up our ideas about how to use these creatures in the interpretation of the environments of the past.”

Note : The above story is based on materials provided by Indiana State University.

New analyses of Martian chemical maps suggest water bound to sulfates in soil

Water (above) and sulfur (below) mass fractions found within the martian soil are mapped up to about 30-40 cm deep at hundreds of kilometer regional scales. Credit: Map courtesy of Suniti Karunatillake, Louisiana State University

A research team led by LSU Geology and Geophysics Assistant Professor Suniti Karunatillake reveals a spatial association between the presence of sulfur and hydrogen found in martian soil. The work by this multi-institutional team of researchers from Georgia Tech (James Wray), Stony Brook University (Scott McLennan and Deanne Rogers), CNRS/ Université Fédérale Toulouse Midi-Pyrénées (Olivier Gasnault), Cornell University (Steve Squyres), and University of Arizona (William Boynton) may in turn identify hydrous iron sulfates as key carriers of H2O in bulk martian soil.

The gamma spectral signature of hydrogen serves as a possible indicator of water, a primary driver of weathering and life processes on Earth. The analyzed elemental data from the Gamma Ray Spectrometer onboard the Mars Odyssey orbiter was published in Geophysical Research Letters on Nov. 22, 2014.

The study indicates that within the southern latitudes of Mars, sulfur compounds are a key hydrated phase. This is revealed in part by water-to-sulfur molar ratios that fall within expected ranges corresponding to hydrated sulfate compounds. Reinforcing the data, hydrogen and sulfur correlate compellingly in the southern latitudes. The molar ratios were observed over 80 percent of Mars’ southern hemisphere. Consequently, sulfate compounds, acting as primary contributors of H2O, may also influence modern water-driven processes on Mars.

“Sulfur variation plays an important role as a control on inferred fluid pH, alteration environments, and water activity while the variation in hydration state reinforces the compelling possibility of H2O bound primarily in sulfates in the southern hemisphere,” Karunatillake said. “This applies specifically to bulk soil at decimeter depths, including the possibility that geochemical processes of iron sulfate-rich Paso Robles soil in Gusev Crater may have been more common at regional scales in ancient martian terrain than previously appreciated.”

The team suggests that further observations by the Curiosity rover in Gale Crater could move forward models of aqueous processes on Mars. For example, recent analyses of “Rocknest” soil samples suggest complementary modes of soil hydration in the Gale Crater area.

Reference:
S. Karunatillake, J. J. Wray, O. Gasnault, S. M. McLennan, A. D. Rogers, S. W. Squyres, W. V. Boynton, J. R. Skok, L. Ojha, N. Olsen. Sulfates hydrating bulk soil in the Martian low and middle latitudes. Geophysical Research Letters, 2014; 41 (22): 7987 DOI: 10.1002/2014GL061136

Note : The above story is based on materials provided by Louisiana State University .

Why is Greenland covered in ice?

Watkins Mountains in southern East Greenland, with Greenland’s highest peak, Gunbjörn Fjeld (3.7 km above sea level) in the background. The photo was taken at about 2 km above sea level, towards the 1.5 km high Watkins Escarpment cut into basalts erupted at the Paleocene-Eocene transition about 56 million years ago, much closer to sea level at that time. Credit: Peter Japsen, GEUS

The ice on Greenland could only form due to processes in the deep Earth interior. Large-scale glaciations in the Arctic only began about 2.7 million years ago; before that, the northern hemisphere was largely free of ice for more than 500 million years. Scientists at the German Research Centre for Geosciences GFZ, Utrecht University, the Geological Survey of Denmark and Greenland (GEUS) and the University of Oslo could now explain why the conditions for the glaciation of Greenland only developed so recently on a geological time scale.

The reason for that is the interaction of three tectonic processes. For one thing, Greenland had to be lifted up, such that the mountain peaks reached into sufficiently cold altitudes of the atmosphere. Secondly, Greenland needed to move sufficiently far northward, which led to reduced solar irradiation in winter. Thirdly, a shift of the Earth axis caused Greenland to move even further northward.

Hot rocks underneath Iceland

These glaciations began in the East of Greenland. The authors found hints in rock samples that the high mountains in the east of Greenland were only uplifted during the last ten million years, whereby this process happened especially fast since about 5 million years ago. At that time, Greenland was still largely free of ice. Seismological investigations indicate that hot rocks rise underneath Iceland from Earth’s deep mantle. These observations were used as input in computer models by main author Bernhard Steinberger at the German Research Centre for Geosciences GFZ. “These hot rocks flow northward beneath the lithosphere, that is, towards eastern Greenland,” Steinberger explains. “Because the upwelling beneath Iceland −the Iceland plume − sometimes gets stronger and sometimes weaker, uplift and subsidence can be explained.”

Greenland migrating

The seismological investigations also showed that the lithosphere in the East of Greenland is especially thin — only about 90 kilometers thick. Earth scientists Steinberger and colleagues reconstructed the position of the tectonic plates 60 to 30 million years ago, and found that the Iceland plume was exactly beneath this part of Greenland during that time. This explains why the lithosphere is so thin. For that reason, the eastern part of Greenland could also be more easily uplifted: Plume material can flow up to a depth of less than 100 km and therefore lift up the overlying lithosphere comparatively easily.

Whereas the Iceland plume remained in approximately the same position in Earth mantle, Greenland moved as a tectonic plate, with a northward component of six degrees of latitude during the past 60 Million years, towards cooler regions.

Shift of Earth axis

This northward motion was amplified through “True polar wander”: “Our computations show that Earth axis shifted about 12° towards Greeland during the last 60 million years” GFZ researcher Steinberger says. Therefore, in combination with the tectonic plate motion, Greenland moved about 18° northward. It was now sufficiently far north, and its mountain tops in the East were sufficiently high, such that glaciations could be initiated.

Reference:
Bernhard Steinberger, Wim Spakman, Peter Japsen, Trond H. Torsvik. The key role of global solid-Earth processes in preconditioning Greenland’s glaciation since the Pliocene. Terra Nova, 2014; DOI: 10.1111/ter.12133

Note : The above story is based on materials provided by GFZ GeoForschungsZentrum Potsdam, Helmholtz Centre.

Iron toxicity for cyanobacteria delayed oxygen accumulation in early Earth’s atmosphere

Cyanobacteria: Such tiny organisms produced today’s proportion of about 20 percent oxygen in the atmosphere of the earth. Credit: Kappler, Swanner/University of Tübingen

Three billion years ago, Earth’s atmosphere contained less than 0.0001 percent oxygen. Today’s atmosphere has around 20 percent oxygen — and that is due to the work of tiny microorganisms in Earth’s primeval oceans. Cyanobacteria, which still exist in a similar form today, probably started using energy from sunlight to photosynthesize some of the carbon dioxide in the atmosphere into organic compounds. Oxygen gas was a byproduct of this process. After about two billion years, it enabled the evolution of the many higher organisms that respire on oxygen, including us.

Tübingen geomicrobiologists Dr. Elizabeth Swanner and Professor Andreas Kappler say that after evolution of the first cyanobacteria, one would expect a rapid and massive oxygen production, i.e. cyanobacteria could have produced much more oxygen much sooner. Working with colleagues from the Department of Geosciences at the University of Tübingen and geoscientists from the University of Alberta (Edmonton, Canada) they looked for factors which prevented early bacteria from multiplying faster. They found that soluble iron in the earliest oceans quickly combined with oxygen to form rust — forming reactive oxygen molecules, which damage biological tissue and make the cyananobacteria grow more slowly and produce less oxygen. Their findings are published in the latest Nature Geoscience.

Today’s seawater contains little iron. But more than three billion years ago, the oceans contained abundant reduced iron. This is partially because oxygen, which causes the iron to precipitate, had not yet entered the ocean to great depths, and also because the seafloor at that time contained abundant iron released by bursts of hydrothermal activity. “In these periods, we often find no indicators of oxygen release,” says Elizabeth Swanner, the study’s lead author. The researchers carried out lab experiments seeking a link between high concentrations of iron and low cyanobacteria growth. It appears that the iron — which the bacteria needed to live — hindered photosynthesis when it was present in high concentrations, thereby cutting off the bacteria’s energy supply. “Too much iron in the presence of oxygen was harmful. You could say the early cyanobacteria poisoned themselves,” Andreas Kappler says.

These new findings will help scientists to better understand the global cycles of carbon and oxygen in the periods of higher soluble iron concentration, also shedding light on the processes in which iron stopped being food and became poison for cyanobacteria and other photosynthesizing organisms. In addition, the connection between iron levels and oxygen production found here will help researchers to reconstruct the long-term processes behind the evolution of animals — which need high levels of oxygen.

Reference:
Elizabeth D. Swanner, Aleksandra M. Mloszewska, Olaf A. Cirpka, Ronny Schoenberg, Kurt O. Konhauser, Andreas Kappler. Modulation of oxygen production in Archaean oceans by episodes of Fe(II) toxicity. Nature Geoscience, 2015; DOI: 10.1038/ngeo2327

Note : The above story is based on materials provided by Universitaet Tübingen.

Related Articles