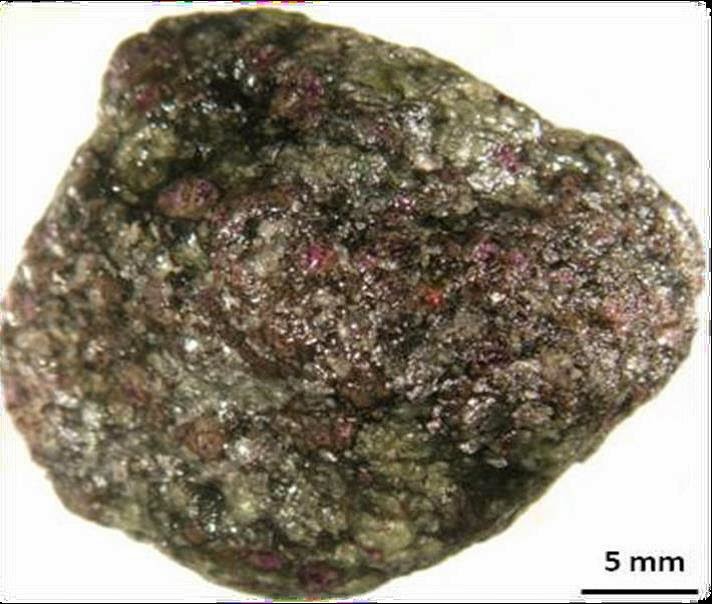
Rare Udachnaya diamondiferous peridotite. Credit: Larry Taylor
Diamonds are beautiful and enigmatic. Though chemical reactions that create the highly coveted sparkles still remain a mystery, a professor from the University of Tennessee, Knoxville, is studying a rare rock covered in diamonds that may hold clues to the gem’s origins.
The golf-ball sized chunk of rock contains more than 30,000 diamonds, each less than a millimeter in size (rendering them worthless), along with speckles of red and green garnet and other minerals.
The rock was found in Russia’s Udachnaya diamond mine in northern Siberia. The diamond company of Russia, ALROSA, loaned it to Earth and Planetary Sciences Professor Larry Taylor and a team of researchers from the Russian Academy of Sciences so they could study the rock to uncover the diamonds’ genesis.
Scientists believe that diamonds form at some 100 miles deep in Earth’s mantle and are carried to the surface by special volcanic eruptions. However, most mantle rocks crumble during this journey. This rock is one of only a few hundred recovered in which the diamonds are still in their original setting from within the Earth.
“It is a wonder why this rock has more than 30,000 perfect teeny tiny octahedral diamonds — all 10 to 700 micron in size and none larger,” said Taylor. “Diamonds never nucleate so homogeneously as this. Normally, they do so in only a few selective places and grow larger. It’s like they didn’t have time to coalesce into larger crystals.”
Taylor and his colleagues examined the sparkly chunk using a giant X-ray machine to study the diamonds and their relationships with associated materials. They also beamed electrons at the materials inside the diamonds — called inclusions — to study the chemicals trapped inside.
This created two- and three-dimensional images which revealed a relationship between minerals. Analyses of nitrogen indicated the diamonds were formed at higher-than-normal temperatures over longer-than-normal times. The images also showed abnormal carbon isotopes for this type of rock, indicating it was originally formed as part of the crust of Earth, withdrawn by tectonic shifts and transformed into the shimmery rock we see today.
“These are all new and exciting results, demonstrating evidences for the birth mechanism of diamonds in this rock and diamonds in general,” said Taylor. The findings were presented at the American Geophysical Union’s annual conference in San Francisco in December and will be published in a special issue of Russian Geology and Geophysics this month.
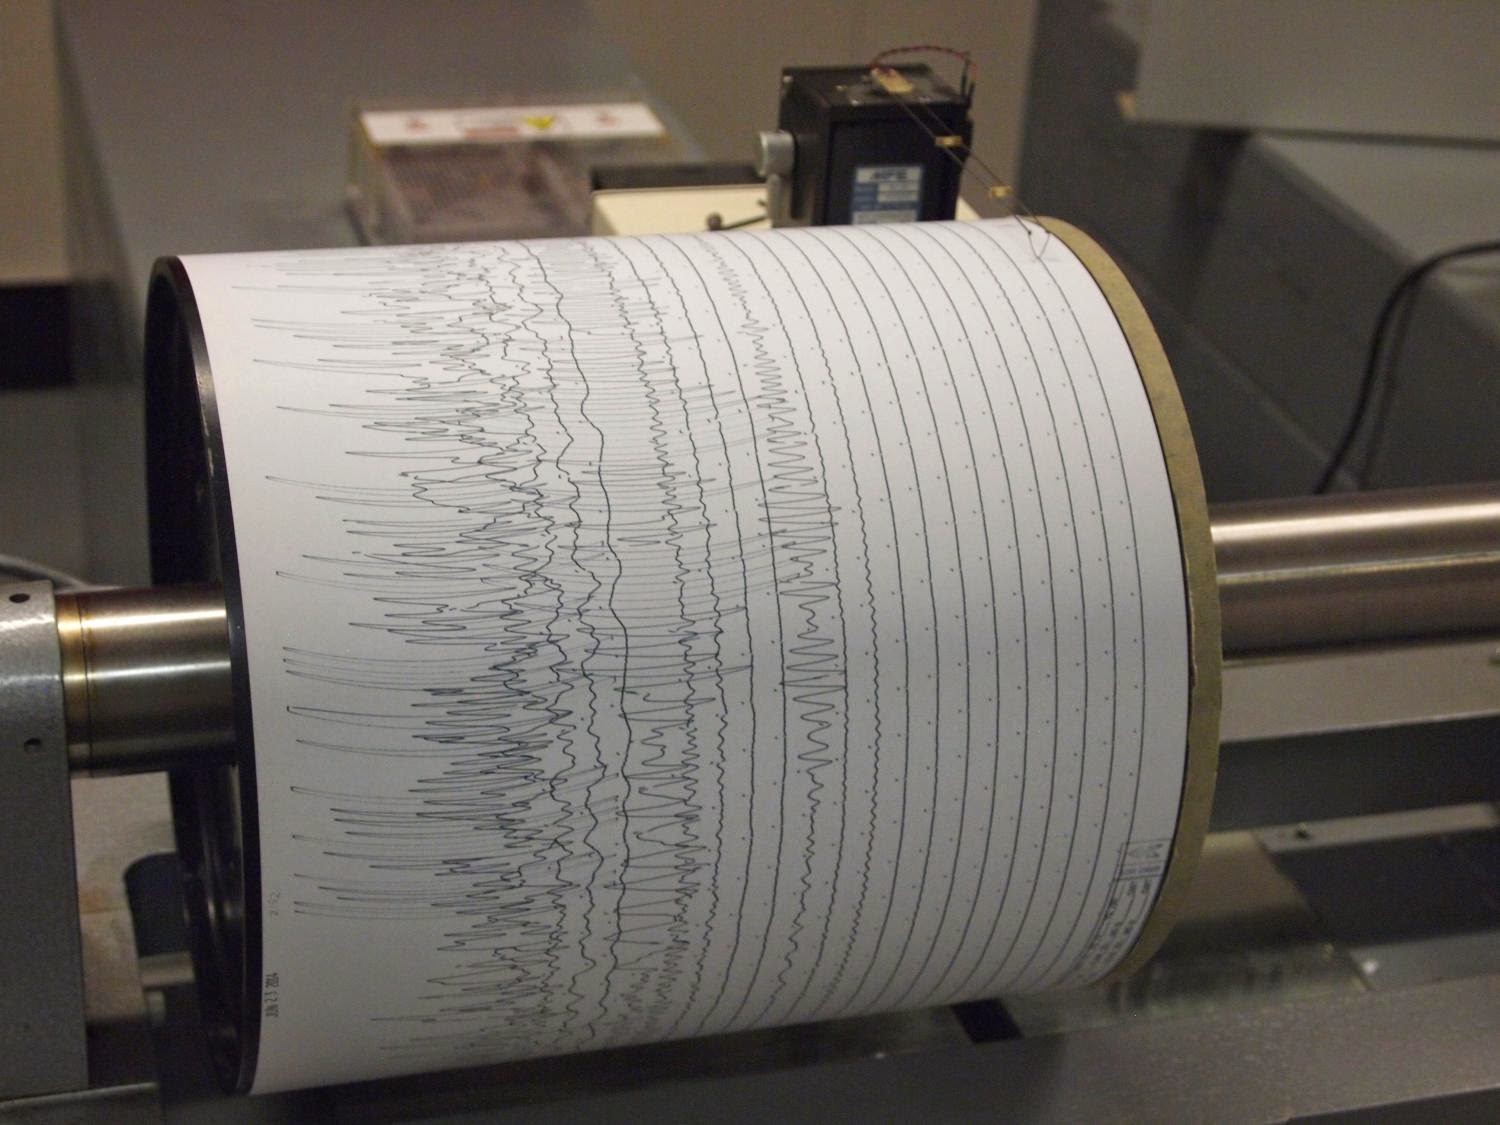
Seismogram being recorded by a seismograph at the Weston Observatory in Massachusetts, USA. Credit: Wikipedia
A new study links the March 2014 earthquakes in Poland Township, Ohio to hydraulic fracturing that activated a previously unknown fault. The induced seismic sequence included a rare felt earthquake of magnitude 3.0, according to research published online by the Bulletin of the Seismological Society of America (BSSA).
In March 2014, a series of five recorded earthquakes, ranging from magnitude 2.1 to 3.0, occurred within one kilometer (0.6 miles) of a group of oil and gas wells operated by Hilcorp Energy, which was conducting active hydraulic fracturing operations at the time. Due to the proximity of a magnitude 3.0 event near a well, the Ohio Department of Natural Resources (ODNR) halted operations at the Hilcorp well on March 10, 2014.
Hydraulic fracturing, or fracking, is a method for extracting gas and oil from shale rock by injecting a high-pressure water mixture directed at the rock to release the oil and gas trapped inside. The process of fracturing the rocks normally results in micro-earthquakes much smaller than humans can feel.
It remains rare for hydraulic fracturing to cause larger earthquakes that are felt by humans. However, due to seismic monitoring advances and the increasing popularity of hydraulic fracturing to recover hydrocarbons, the number of earthquakes – felt and unfelt – associated with hydraulic fracturing has increased in the past decade.
“These earthquakes near Poland Township occurred in the Precambrian basement, a very old layer of rock where there are likely to be many pre-existing faults,” said Robert Skoumal who co-authored the study with Michael Brudzinski and Brian Currie at Miami University in Ohio. “This activity did not create a new fault, rather it activated one that we didn’t know about prior to the seismic activity.”
Using a technique called template matching, the researchers sifted through seismic data recorded by the Earthscope Transportable Array, a network of seismic stations, looking for repeating signals similar to the known Poland Township earthquakes, which were treated like seismic “fingerprints.” They identified 77 earthquakes with magnitudes from 1.0 and 3.0 that occurred between March 4 and 12 in the Poland Township area. The local community reported feeling only one earthquake, the magnitude 3.0, on March 10.
Skoumal and his colleagues compared the identified earthquakes to well stimulation reports, released in August 2014 by the ODNR, and found the earthquakes coincided temporally and spatially with hydraulic fracturing at specific stages of the stimulation. The seismic activity outlined a roughly vertical, east-west oriented fault within one kilometer of the well. Industry activities at other nearby wells produced no seismicity, suggesting to the authors that the fault is limited in extent.
“Because earthquakes were identified at only the northeastern extent of the operation, it appears that a relatively small portion of the operation is responsible for the events,” said Skoumal, who suggests the template matching technique offers a cost-effective and reliable means to monitor seismicity induced by hydraulic fracturing operations.
“We just don’t know where all the faults are located,” said Skoumal. “It makes sense to have close cooperation among government, industry and the scientific community as hydraulic fracturing operations expand in areas where there’s the potential for unknown pre-existing faults.”
The paper, “Earthquakes Induced by Hydraulic fracturing in Poland Township, Ohio,” will be published online Jan. 6, 2015 and in print in the February/March issue of BSSA.
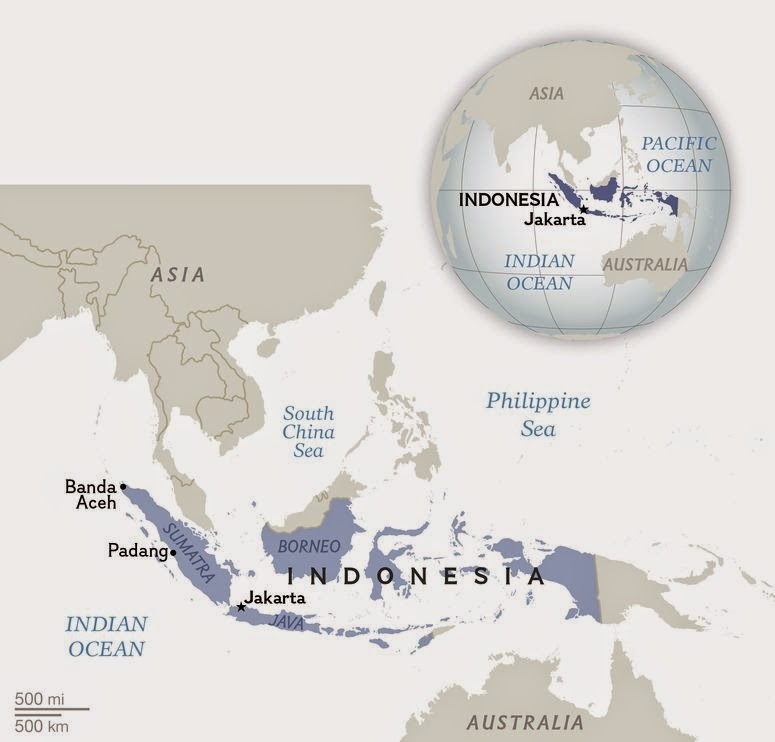
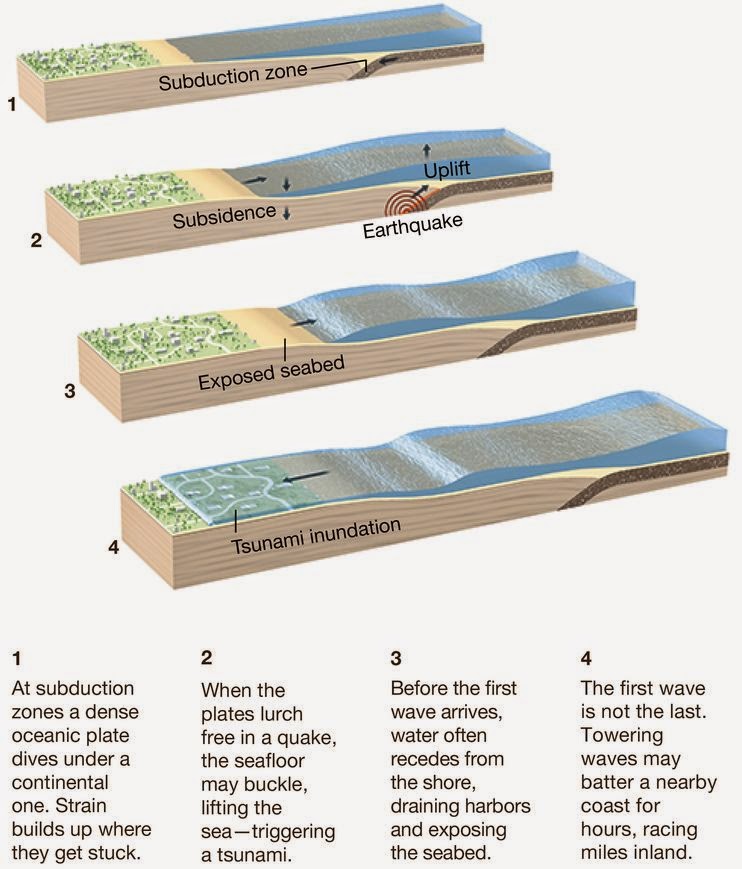
Ten years ago, one of the deadliest natural disasters in history killed 227,898 people in 14 countries around the Indian Ocean—nearly 170,000 of them in Indonesia.It began on the morning of December 26, 2004, about 150 miles (240 kilometers) off the west coast of Sumatra, when a magnitude 9.1 earthquake—the third largest since 1900—ruptured the ocean floor. Within eight minutes the fracture spanned 700 miles (1,127 kilometers), releasing 23,000 times more energy than the atomic bomb that destroyed Nagasaki, Japan. Parts of the seabed shifted 30 feet (9 meters) to the west-southwest.
But that was not the worst of it. Some segments of the fault also surged upward by tens of feet, and they lifted the whole column of seawater above them. At the sea surface, that set in motion a wave—a tsunami that traveled around the Indian Ocean. When it hit Sumatra, it was 100 feet (30 meters) high along parts of the northwest coast.
It was the tsunami that did the killing.
When the next tsunami strikes the Indian Ocean—and scientists are certain that another large one is inevitable, probably within the next few decades—will the region fare any better?
Looking Back
Hardest hit on that terrible day ten years ago was the Indonesian city of Banda Aceh, on Sumatra’s northern tip. More than 60,000 of its 264,000 residents perished—about 35 percent of the total lost in Indonesia. (Read more about the Indonesian and Japanese tsunamis.)
Vivi Yanti, an English teacher in the city, remembers the water as being warm, black, oily, and filled with debris. In streets jammed with fleeing people, Yanti glimpsed a woman running, holding the hand of a little boy, banging on the windows of passing cars, begging for a ride. No one stopped. “I escaped by riding with my uncle on the back of his motorcycle,” says Yanti. “I remember looking back, and at first I didn’t know what I was seeing—the water was carrying a big ship down the street. I told my uncle, ‘Drive faster.'”
Ten years later Banda Aceh has been rebuilt, and its population has climbed back to 250,000, almost what it was before the disaster. With smooth new highways and vibrant late-night cafés, the city has been transformed. Aside from a number of immaculately groomed mass graves, and a few intentional reminders of the disaster—such as the presence of a large ship marooned in a city park—most signs of the tsunami’s damage have been erased.
Like other countries ravaged by the 2004 tsunami, Indonesia is now linked to a tsunami detection system in the Indian Ocean. Once an earthquake has occurred, that system of seafloor sensors and surface buoys relays signals via satellite to government warning centers around the world, alerting them that a tsunami might be on the way.
NG ART; BRYAN CHRISTY. SOURCE: OREGON STATE UNIVERSITY
A decade ago such detectors existed only in the Pacific. Had they been deployed in the Indian Ocean in 2004, some of the 51,000 people who died in Sri Lanka and India would have been spared: The tsunami took two hours to cross the Indian Ocean, and timely warnings—or any warning at all—would have saved thousands of lives.
But Indonesia—the fourth most populous country in the world—is in a less fortunate situation. It borders a number of dangerous seismic faults, especially a long, arcing one called the Sunda megathrust, which parallels the islands of Sumatra and Java. The 2004 tsunami that began on that fault struck the Sumatran coast within 30 minutes of the earthquake. Even with a near instantaneous tsunami alert, many residents wouldn’t have had enough time to reach high ground.
Faced with such an unforgiving margin between life and death, Indonesia has struggled to improve public awareness and preparedness. A handful of evacuation shelters—three- or four-story buildings, some of them with open ground floors to let the wave pass through—have been built in Banda Aceh and other threatened cities. There’s a network of sirens to warn residents that a tsunami is imminent.
But much remains to be done, as the response to a recent earthquake made painfully evident.
A Practice Run Goes Badly
On April 11, 2012, when a magnitude 8.6 earthquake struck Banda Aceh, Indonesia’s National Tsunami Warning Center issued a tsunami alert within five minutes of the first tremors. The nation’s early warning system worked perfectly, but the local response to the alert does not bode well for future disasters. Officials in Banda Aceh had failed to establish clear emergency guidelines for the city. Although the earthquake didn’t generate a tsunami—the plates along the fault in this case slipped horizontally, not violently upward—people with horrific firsthand experience expected one, and panicked.
“The conditions were totally chaotic,” says Syarifah Marlina Al Mazhir, a lifelong resident of Banda Aceh who worked for the Red Cross during the 2004 tsunami. “Instead of evacuating to safe areas, people were going home or picking up the kids at school, which created traffic jams.”
Even worse, she says, the staff responsible for operating the tsunami sirens fled, and the city’s three multi-story tsunami shelters were locked.
“In Banda Aceh everything became paralyzed very quickly,” says Tom Alcedo, the head of the American Red Cross in Indonesia. “Roads to high ground got choked. All those people in their cars would have been swept away. It was a wake-up call.”
Ardito Kodijat, the director of the Indian Ocean Tsunami Information Center in Jakarta, says Banda Aceh and other coastal cities in Indonesia need to establish well-marked evacuation routes and conduct regular tsunami drills. Many people in Banda Aceh, he says, didn’t know that evacuation centers had been built. Others, having witnessed the ferocity of the 2004 tsunami, thought the structures would be unsafe, and tried to escape inland instead. “The people could have been much better prepared if there had been clear and strong guidance from the local government,” says Kodijat.
Banda Aceh, though, is probably not the most threatened of Indonesia’s cities. “The shoe dropped there already,” says Brian Atwater, a geologist with the U.S. Geological Survey. “It’s not at all clear how often earthquakes repeat, and whether the fault that broke in 2004 spent everything it had on that earthquake, or whether there’s something left in the bank. In the meantime, you have plenty of other places with poorly understood hazards. Padang is a next-shoe-drop kind of place.”
Geological evidence of past tsunamis suggest that the segment of the Sunda megathrust that lies off Padang, a city of one million on Sumatra’s west coast, may be overdue for an earthquake. Government officials in Indonesia and Padang are aware of the risk. As in Banda Aceh, evacuation routes have been planned and emergency shelters built.
But in Indonesia and other countries along the rim of the Indian Ocean, such measures may be insufficient to protect the hundreds of millions of people who live along the coasts. Even with the best warning systems and evacuation plans, there are simply too many people in harm’s way. In Southeast Asia alone, more than ten million people live within a mile of the coast. Short of moving Banda Aceh, Padang, and every other threatened coastal city miles inland, there’s no fail-safe defense against future tsunamis.
Kerry Sieh, a geologist at Nanyang Technological University’s Earth Observatory in Singapore, has spent more than 20 years studying the faults around Sumatra. Geologists like Sieh can tell us when earthquakes have occurred in the past, and when and where they’re likely to occur in the future. While they can’t tell us exactly when to run, they can say with certainty that many of us are living in dangerous places.
Given the sheer numbers of lives at risk, Sieh says, there is only so much governments can do, especially in poor countries like Indonesia, to prevent catastrophic losses from the inevitable future tsunamis. “Is good work being done?” Sieh asks. “Yes. There are people trying to educate; there are people trying to build vertical evacuation structures. But will it solve even 10 percent of the problem? I have my doubts.”
Note : The above story is based on materials provided by National Geographic. The original article was written by Tim Folger.
In the early hours of Dec. 26, 2004, one of the world’s most powerful earthquakes triggered one of the largest tsunamis in 40 years.
Sometimes known as the Christmas or Boxing Day tsunami, the December 26, 2004 Indian Ocean Tsunami is far from a distant memory, a decade after resulting in more than 200,000 casualities.
“The tsunami struck after the magnitude 9.1 Sumatra-Andaman Earthquake occurred off the northwest coast of Sumatra, Indonesia, causing catastrophic levels of destruction to countries around the Indian Ocean basin.”
Cause and Areas Impacted
The magnitude 9.1 Sumatra-Andaman Earthquake occurred on the interface between the India and Burma tectonic plates.
According to USGS scientists, the sea floor near the earthquake was uplifted several meters. The displacement of water above the sea floor triggered the tsunami, which caused catastrophic levels of destruction in countries around the Indian Ocean basin, reaching as far as the east coast of Africa.
The tsunami arrived in northern Sumatra approximately 30 minutes after the earthquake, in Thailand approximately an hour and a half to two hours after the earthquake, and in Sri Lanka approximately two to three hours after the earthquake.
The tsunami was only recently rivaled by the 2011 tsunami in Japan.
“The foremost impact, of course, is the loss of life in both cases,” said Eric Geist, USGS research geophysicist. “For the 2004 tsunami, the loss of life far outweighed damage to infrastructure, whereas for the 2011 tsunami, there was significant damage to infrastructure in Japan.”
Countries hardest hit by the 2004 tsunami included Sri Lanka, India, Thailand, Somalia, Maldives, Malaysia, Myanmar, Tanzania, Bangladesh and Kenya
Tsunami Research
The 2004 tsunami was the deadliest and one of the most destructive in recorded history.
Tsunami runup heights of more than 30 meters were observed along the west coast of Sumatra.
In Aceh and Sumatera Utara Provinces, Indonesia, at least 108,100 people were killed, 127,700 are missing and presumed dead and 426,800 were displaced by the earthquake and tsunami.
Bruce Richmond, a coastal geologist with the USGS Pacific Coastal and Marine Science Center in Santa Cruz, Calif,, along with USGS scientists Bruce Jaffe and Guy Gelfenbaum joined international survey teams to documenttsunami impacts, collect water level information, and map erosion and deposition of sediments to characterize the sedimentary record. The tsunami effects were studied in an effort to develop techniques to improve the identification of paleotsunami deposits in the geologic record.
“Our studies were conducted in a variety of coastal environments impacted by the tsunami and went a long way in helping us to understand the variability of deposits from a single event in multiple coastal settings,” Richmond said.
Future Implications and Preparation
Before the Indian Ocean Tsunami occurred, USGS geologists had been assessing tsunami hazards in California, seeking evidence of past tsunami deposits along California’s shores. “Not long after we started our California work in 2004, the Indian Ocean earthquake and tsunami struck which changed the focus of our efforts for several years,” said Richmond. “At the time, that tsunami was the largest natural disaster in our lifetimes, both in terms of lives lost and widespread impact. Our observations on many different shorelines around the Indian Ocean went a long way in helping us to understand the variability of deposits from a single event in multiple coastal settings.”
Geist, too, said he and his USGS counterparts’ research since then has focused on taking the lessons learned from the 2004 and 2011 tsunamis and applying them to hazard issues that affect the U.S. Could it happen here?
“Initially, my research focus was evaluating the performance of hazard assessment models if they had been used prior to the tsunami,” Geist said. “Since then, our research has focused more on taking the lessons learned from both tsunamis and applying them to hazard issues that affect the U.S.”
Bruce Jaffe, research oceanographer, said that earthquakes and tsunamis like those in 2004 have brought awareness and the need to study and prepare for these often underestimated hazards
“The take-home message is that we still have a lot to learn about what the real hazard of tsunamis are,” he said. “We’re getting there but it’s taking time.”
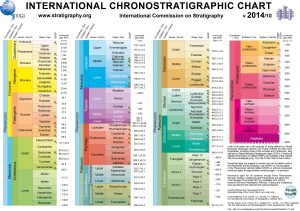
International Chronostratigraphic Chart latest version (v 2014/10)
Click here (PDF or JPG) to download the latest version (v 2014/10) of the International Chronostratigraphic Chart.
Translations of the chart: Japanese (v2014-02: PDF or JPG), Chinese (v2013-01: PDF or JPG), Spanish (v2013-01), Portuguese (v2013-01: PDF or JPG), Norwegian (v2013-01: PDF or JPG), Basque (v2013-01: PDF or JPG), Catalan (v2013-01: PDF or JPG) and French (v2012).
The old versions can be download at the following links: 2008 (PDF or JPG), 2009 (PDF or JPG), 2010 (PDF or JPG), 2012 (PDF or JPG), 2013/01 (PDF or JPG), 2014/02 (PDF or JPG) and the ChangeLog for 2012, 2013 and 2014.
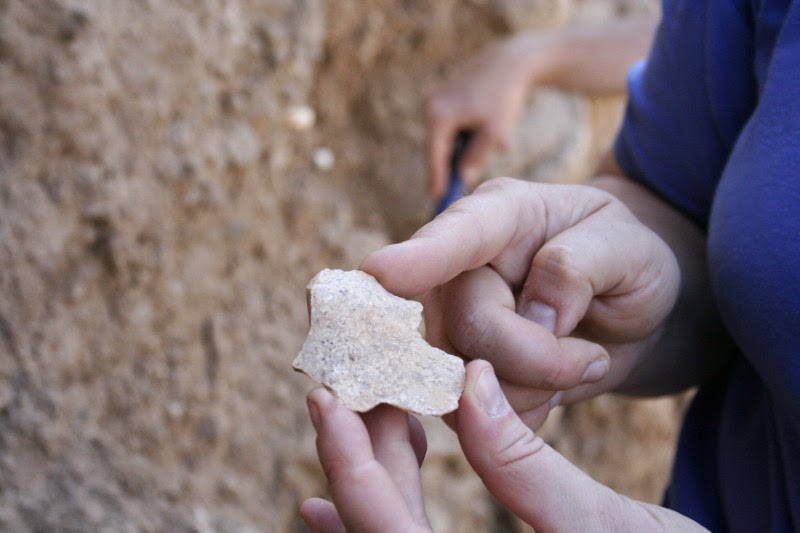
Stone tool approximately 1.2 million years old. Credit: Image courtesy of University of Royal Holloway London
Scientists have discovered the oldest recorded stone tool ever to be found in Turkey, revealing that humans passed through the gateway from Asia to Europe much earlier than previously thought, approximately 1.2 million years ago.
According to research published in the journal Quaternary Science Reviews, the chance find of a humanly-worked quartzite flake, in ancient deposits of the river Gediz, in western Turkey, provides a major new insight into when and how early humans dispersed out of Africa and Asia.
Researchers from Royal Holloway, University of London, together with an international team from the UK, Turkey and the Netherlands, used high-precision equipment to date the deposits of the ancient river meander, giving the first accurate timeframe for when humans occupied the area.
Professor Danielle Schreve, from the Department of Geography at Royal Holloway, said: “This discovery is critical for establishing the timing and route of early human dispersal into Europe. Our research suggests that the flake is the earliest securely-dated artefact from Turkey ever recorded and was dropped on the floodplain by an early hominin well over a million years ago.”
The researchers used high-precision radioisotopic dating and palaeomagnetic measurements from lava flows, which both pre-date and post-date the meander, to establish that early humans were present in the area between approximately 1.24 million and 1.17 million years ago. Previously, the oldest hominin fossils in western Turkey were recovered in 2007 at Koçabas, but the dating of these and other stone tool finds were uncertain.
“The flake was an incredibly exciting find,” Professor Schreve said. “I had been studying the sediments in the meander bend and my eye was drawn to a pinkish stone on the surface. When I turned it over for a better look, the features of a humanly-struck artefact were immediately apparent.
“By working together with geologists and dating specialists, we have been able to put a secure chronology to this find and shed new light on the behaviour of our most distant ancestors.”
Reference:
D. Maddy, D. Schreve, T. Demir, A. Veldkamp, J.R. Wijbrans, W. van Gorp, D.J.J. van Hinsbergen, M.J. Dekkers, R. Scaife, J.M. Schoorl, C. Stemerdink, T. van der Schriek. The earliest securely-dated hominin artefact in Anatolia? Quaternary Science Reviews, 2015; 109: 68 DOI: 10.1016/j.quascirev.2014.11.021
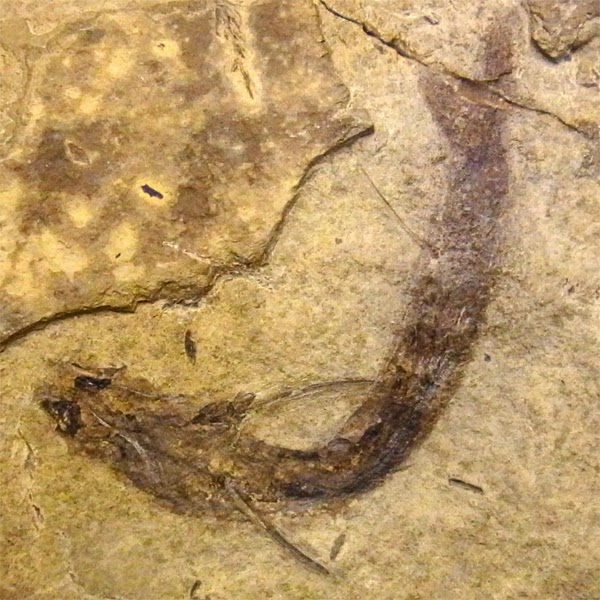
Fossilised Acanthodes bridgei with eye tissues intact. Credit: Tanaka et al., Nature Communications
A fish eye from a primitive time when Earth was but one single continent, has yielded evidence of color vision dating back at least 300 million years, researchers said Tuesday.
Analysing the fossilized remains of a fish from the “spiny shark” family that lived long before the dinosaurs, scientists discovered light-sensing “rod” and “cone” eye cells—the oldest ever found.
“This is the first discovery of vertebrate retinal fossils,” said Gengo Tanaka from Japan’s Kumamoto University, who co-authored the study in the journal Nature Communications.
It is rare for palaeontologists to find eye remains, as the soft tissue generally decays within 64 days, the authors of the study said.
However, the Hamilton Quarry in Kansas is a treasure trove of unusually well-preserved fossils—an entire ecosystem having been rapidly buried under sediment.
They included the extinct fish Acanthodes bridgei—among the oldest known vertebrates with jaws.
It had a long, streamlined body and fins with spines, is believed to have lived in shallow, brackish water, and died out at the end of the Permian period about 250 million years ago when nearly 90 percent of species disappeared in the largest extinction in Earth’s history.
An A. bridgei specimen found at the quarry retained elements of the original eye colour and shape, and a light-absorbing pigment in the retina.
The remains had been preserved under a thin coating of phosphate, Tanaka told AFP.
Analysis of the tissue “provides the first record of mineralized rods and cones in a fossil,” said the study.
These, combined with light-absorbing melanin pigments, suggested the fish was “probably” able to see in low light using highly-sensitive rod cells, and by day using cone cells.
In modern animals, cone cells respond individually to light at specific wavelengths, thus allowing observation of different colors.
“The presence of cones indicates that A. bridgei likely possessed color vision”, the study said—though conclusive evidence is needed.
Vision is thought to have existed for at least 520 million years, but this is the first direct evidence of color-sensitive receptors.
A study of tooth enamel in mammals living today in the equatorial forest of Gabon could ultimately shed light on the diet of long extinct animals, according to new research from the University of Bristol.
Reconstructing what extinct organisms fed on can be a real challenge. Scientists use a variety of methods including the structure of an animal’s bones, analysis of its stomach contents and the patterns of wear left on the surface of its teeth. Geochemical methods have also proved useful but can be limited by poor preservation of the animal’s remains.
Dr Jeremy Martin, formerly of Bristol’s School of Earth Sciences and now at the Laboratoire de Géologie de Lyon: terre, planètes et environnement, University of Lyon/ENS de Lyon, and colleagues found that magnesium isotopes are particularly well suited to deciphering the diet of living mammals and, when used in conjunction with other methods such as carbon isotopes, they could open up new perspectives on the study of fossilised animals.
Dr Martin said: “Most chemical elements exist in distinct forms called isotopes which are characterized by different masses. Therefore, all the isotopes of an element will behave differently during a chemical reaction preferentially sorting out heavier ones from lighter ones.”
As noted by Dr Balter, who took part in the study: “Biological processes such as digestion involve important isotopic fractionations of the various elements assimilated through food consumption so the stable isotope composition of an organism tends to reflect its diet — we are what we eat.”
Scientists know that the carbon and nitrogen isotopes preserved in bone collagen can give direct evidence about an animal’s food intake. However, because of the rapid decay of organic matter, these inferences are limited to the recent past.
Dr Martin and colleagues explored the isotopic variability of one of the major elements that compose tooth apatite, the hardest biological structure to retain its pristine signal throughout the fossil record.
Teeth from various mammals living today in the equatorial forest of Gabon were purified for magnesium isotopes. The results show that the isotope ratios of magnesium 26 mg/24 mg increase from herbivore to higher-level consumers (such as carnivores) and, when used in conjunction with other geochemical proxies, serve as a strong basis to infer the diet of mammals.
Dr Martin said: “Many fossil groups do not have living analogues and inferring their diet is far from clear. Applying a new perspective to palaeoecology by using non-traditional isotopes (such as magnesium or calcium in conjunction with traditional approaches) holds great promise for our understanding of how such ancient organisms interacted with each other.”
Reference:
Jeremy E. Martin, Derek Vance, Vincent Balter. Magnesium stable isotope ecology using mammal tooth enamel. Proceedings of the National Academy of Sciences, 2014; 201417792 DOI: 10.1073/pnas.1417792112
NASA has contracted with two private space firms to prepare and execute missions to land on and mine asteroids for valuable resources. Space mining could help provide deep space missions with vital resources such as water, silicate or minerals. VIDEOGRAPHICS
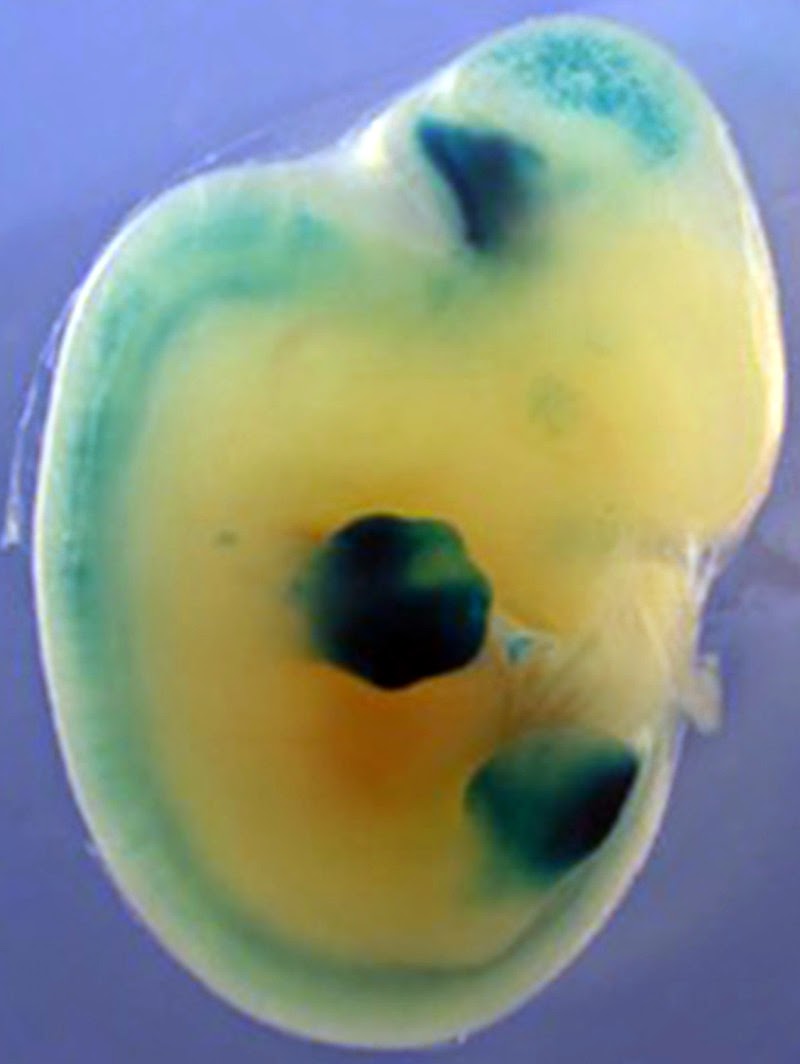
The same autopod-building genetic switches from gar are able to drive gene activity (purple) in the digits of transgenic mice; an activity that was absent in other fish groups studied. Credit: Andrew Gehrke, the University of Chicago
Paleontologists have documented the evolutionary adaptations necessary for ancient lobe-finned fish to transform pectoral fins used underwater into strong, bony structures, such as those of Tiktaalik roseae. This enabled these emerging tetrapods, animals with limbs, to crawl in shallow water or on land. But evolutionary biologists have wondered why the modern structure called the autopod–comprising wrists and fingers or ankles and toes–has no obvious morphological counterpart in the fins of living fishes.
In the Dec. 22, 2014, issue of the Proceedings of the National Academy of Sciences, researchers argue previous efforts to connect fin and fingers fell short because they focused on the wrong fish. Instead, they found the rudimentary genetic machinery for mammalian autopod assembly in a non-model fish, the spotted gar, whose genome was recently sequenced.
“Fossils show that the wrist and digits clearly have an aquatic origin,” said Neil Shubin, PhD, the Robert R. Bensley Professor of organismal biology and anatomy at the University of Chicago and a leader of the team that discovered Tiktaalik in 2004. “But fins and limbs have different purposes. They have evolved in different directions since they diverged. We wanted to explore, and better understand, their connections by adding genetic and molecular data to what we already know from the fossil record.”
Initial attempts to confirm the link based on shape comparisons of fin and limb bones were unsuccessful. The autopod differs from most fins. The wrist is composed of a series of small nodular bones, followed by longer thin bones that make up the digits. The bones of living fish fins look much different, with a set of longer bones ending in small circular bones called radials.
The primary genes that shape the bones, known as the HoxD and HoxA clusters, also differ. The researchers first tested the ability of genetic “switches” that control HoxD and HoxA genes from teleosts–bony, ray-finned fish–to shape the limbs of developing transgenic mice. The fish control switches, however, did not trigger any activity in the autopod.
Teleost fish–a vast group that includes almost all of the world’s important sport and commercial fish–are widely studied. But the researchers began to realize they were not the ideal comparison for studies of how ancient genes were regulated. When they searched for wrist and digit-building genetic switches, they found “a lack of sequence conservation” in teleost species.
They traced the problem to a radical change in the genetics of teleost fish. More than 300 million years ago, after the fish-like creatures that would become tetrapods split off from other bony fish, a common ancestor of the teleost lineage went through a whole-genome duplication (WGD)–a phenomenon that has occurred multiple times in evolution.
By doubling the entire genetic repertoire of teleost fish, this WGD provided them with enormous diversification potential. This may have helped teleosts to adapt, over time, to a variety of environments worldwide. In the process, “the genetic switches that control autopod-building genes were able to drift and shuffle, allowing them to change some of their function, as well as making them harder to identify in comparisons to other animals, such as mice,” said Andrew Gehrke, a graduate student in the Shubin lab and lead author of the study.
Not all bony fishes went through the whole genome duplication, however. The spotted gar, a primitive freshwater fish native to North America, split off from teleost fishes before the WGD.
When the research team compared Hox gene switches from the spotted gar with tetrapods, they found “an unprecedented and previously undescribed level of deep conservation of the vertebrate autopod regulatory apparatus.” This suggests, they note, a high degree of similarity between “distal radials of bony fish and the autopod of tetrapods.”
They tested this by inserting gar gene switches related to fin development into developing mice. This evoked patterns of activity that were “nearly indistinguishable,” the authors note, from those driven by the mouse genome.
“Overall,” the researchers conclude, “our results provide regulatory support for an ancient origin of the ‘late’ phase of Hox expression that is responsible for building the autopod.”
This study was supported by the Brinson Foundation; the National Science Foundation; the Brazilian National Council for Scientific and Technological Development grants; the National Institutes of Health; the Volkswagen Foundation, Germany; the Alexander von Humboldt-Foundation, the Spanish and Andalusian governments; and Proyecto de Excelencia.
Additional authors include Mayuri Chandran and Tetsuya Nakamura from the University of Chicago; Igor Schneider from the Instituto de Ciencias Biologicas, Universida de Federal do Para, Belem, Brazil; Elisa de la Calle-Mustienes, Juan J. Tena, Carlos Gomez-Marin and José Luis Gómez-Skarmeta from the Centro Andaluz de Biología del Desarrollo, Sevilla, Spain; and Ingo Braasch and John H. Postlethwait from the Institute of Neuroscience, University of Oregon.
Reference:
Andrew R. Gehrke, Igor Schneider, Elisa de la Calle-Mustienes, Juan J. Tena, Carlos Gomez-Marin, Mayuri Chandran, Tetsuya Nakamura, Ingo Braasch, John H. Postlethwait, José Luis Gómez-Skarmeta, and Neil H. Shubin. Deep conservation of wrist and digit enhancers in fish. PNAS, December 22, 2014 DOI: 10.1073/pnas.1420208112
The surface of Mars was once wet, but no water flows there now. UC San Diego chemists and others took a close look at meteorite that may have been blasted from this huge rift across the planet’s surface. The image is a composite of hundreds of photos taken by NASA’s Viking missions in the 1970s. Credit: USGS, NASA
A new analysis of a Martian rock that meteorite hunters plucked from an Antarctic ice field 30 years ago this month reveals a record of the planet’s climate billions of years ago, back when water likely washed across its surface and any life that ever formed there might have emerged.
Scientists from the University of California, San Diego, NASA and the Smithsonian Institution report detailed measurements of minerals within the meteorite in the early online edition of the Proceedings of the National Academy of Sciences this week.
“Minerals within the meteorite hold a snapshot of the planet’s ancient chemistry, of interactions between water and atmosphere,” said Robina Shaheen, a project scientist at UC San Diego and the lead author of the report.
The unlovely stone, which fell to Earth 13 thousand years ago, looked a lot like a potato and has quite a history. Designated ALH84001, it is the oldest meteorite we have from Mars, a chunk of solidified magma from a volcano that erupted four billion years ago. Since then something liquid, probably water, seeped through pores in the rock and deposited globules of carbonates and other minerals.
The carbonates vary subtly depending on the sources of their carbon and oxygen atoms. Both carbon and oxygen occur in heavier and lighter versions, or isotopes. The relative abundances of isotopes forms a chemical signature that careful analysis and sensitive measurements can uncover.
Mars’s atmosphere is mostly carbon dioxide but contains some ozone. The balance of oxygen isotopes within ozone are strikingly weird with enrichment of heavy isotopes through a physical chemical phenomenon first described by co-author Mark Thiemens, a professor of chemistry at UC San Diego, and colleagues 25 years ago.
“When ozone reacts with carbon dioxide in the atmosphere, it transfers its isotopic weirdness to the new molecule,” said Shaheen, who investigated this process of oxygen isotope exchange as a graduate student at the University of Heidelberg in Germany. When carbon dioxide reacts with water to make carbonates, the isotopic signature continues to be preserved.
The degree of isotopic weirdness in the carbonates reflects how much water and ozone was present when they formed. It’s a record of climate 3.9 billion years ago, locked in a stable mineral. The more water, the smaller the weird ozone signal.
This team measured a pronounced ozone signal in the carbonates within the meteorite, suggesting that although Mars had water back then, vast oceans were unlikely. Instead, the early Martian landscape probably held smaller seas.
“What’s also new is our simultaneous measurements of carbon isotopes on the same samples. The mix of carbon isotopes suggest that the different minerals within the meteorite had separate origins,” Shaheen said. “They tell us the story of the chemical and isotopic compositions of the atmospheric carbon dioxide.”
ALH84001 held tiny tubes of carbonate that some scientists saw as potential evidence of microbial life, though a biological origin for the structures has been discarded. On December 16, NASA announced another potential whiff of Martian life in the form of methane sniffed by the rover Curiosity.
Carbonates can be deposited by living things that scavenge the minerals to build their skeletons, but that is not the case for the minerals measured by this team. “The carbonate we see is not from living things,” Shaheen said. “It has anomalous oxygen isotopes that tell us this carbonate is abiotic.”
By measuring the isotopes in multiple ways, the chemists found carbonates depleted in carbon-13 and enriched in oxygen-18. That is, Mars’s atmosphere in this era, a period of great bombardment, had much less carbon-13 than it does today.
The change in relative abundances of carbon and oxygen isotopes may have occurred through extensive loss of Martian atmosphere. A thicker atmosphere would likely have been required for liquid water to flow on the planet’s chilly surface.
“We now have a much deeper and specific insight into the earliest oxygen-water system in the solar system,” Thiemens said. “The question that remains is when did planets, Earth and Mars, get water, and in the case of Mars, where did it go? We’ve made great progress, but still deep mysteries remain.”
Reference:
Robina Shaheen, Paul B. Niles, Kenneth Chong, Catherine M. Corrigan, and Mark H. Thiemens. Carbonate formation events in ALH 84001 trace the evolution of the Martian atmosphere. PNAS, December 22, 2014 DOI: 10.1073/pnas.1315615112
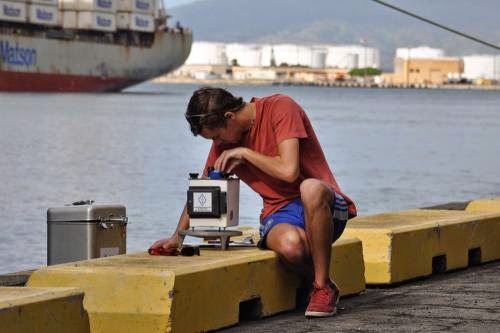
Before leaving port, an undergraduate student acquires important control data (on-shore gravimetrics) using a gravitometer. Credit: Aric Velbel, Jurassic Magnetism
Imagine one day you woke up, and the North Pole was suddenly the South Pole.
This geomagnetic reversal would cause your hiking compass to seem impossibly backwards. However, within our planet’s history, scientists know that this kind of thing actually has happened… not suddenly and not within human time scales, but the polarity of the planet has in fact reversed, which has caused scientists to wonder not only how it’s happened, but why.
This week, as the National Science Foundation (NSF) research vessel R/V Sikuliaq continues its journey towards its home port in University of Alaska Fairbanks’ Marine Center in Seward, Alaska, she detours for approximately 35 days as researchers take advantage of her close proximity to the western Pacific Ocean’s volcanic sea floors. With the help of three types of magnetometers, they will unlock more of our planet’s geomagnetic history that has been captured in our Earth’s crust there.
“The geomagnetic field is one of the major physical properties of planet Earth, and it is a very dynamic property that can change from milliseconds to millions of years. It is always, always changing,” said the expedition’s chief scientist, Masako Tominaga, an NSF-funded marine geophysicist from Michigan State University. “Earth’s geomagnetic field is a shield, for example. It protects us from magnetic storms—bursts from the sun—so very pervasive cosmic rays don’t harm us. Our research will provide data to understand how changes in the geomagnetic field have occurred over time and give us very important clues to understand the planet Earth as a whole.”
Flipping and flopping
Reportedly, the last time, a geomagnetic reversal occurred was 780,000 years ago, known as the Brunhes-Matuyama reversal. Bernard Brunhes and Motonori Matuyama were the geophysicists who identified that reversal in 1906.
Researchers Tominaga, Maurice Tivey (from Woods Hole Oceanographic Institution) and William Sager (from University of Houston) have an interest that goes further back in history to the Jurassic period, 145-200 million years ago when a curious anomaly occurred. Scientists originally thought that during this time period, no geomagnetic reversals had happened at all. However, data—like the kind that Tominaga’s team will be collecting—revealed that in fact, the time period was full of reversals that occurred much more quickly.
“We came to the conclusion that it was actually ‘flipping flopping,’ but so fast that it did not regain the full strength of the geomagnetic field of Earth like today’s strength. That’s why it was super, super low,” Tominaga explained. “The Jurassic period is very distinctive. We think that understanding this part of the geomagnetic field’s behavior can provide important clues for computer simulation where researchers have been trying to characterize this flipping and flopping. Our data could help predict future times when we might see this flipping flopping again.”
Interestingly, historical records have shown points where the flipping seems likely to occur but then seems to change its mind, almost like a tease, where it returns to its original state. Those instances actually do occur on a shorter time scale than the full-fledged flipping and flopping. Again, scientists are looking for answers on why they occur as well.
Better tools equal better data
For approximately three decades, researchers like Tominaga have been probing this area of the western Pacific seafloor. With her cruise on R/V Sikuliaq, Tominaga and Tivey come with even more technology in hand.
Thirty years ago, researchers didn’t have access to autonomous underwater vehicles (AUV) that could go to deeper, harder-to-reach ocean areas. However, that is just one of three ways Tominaga’s team will deploy three magnetometers during its time at sea. One magnetometer will work from aboard R/V Sikuliaq. Another will trail behind the ship, and the third will be part of the AUV.
“The seafloor spreading at mid-ocean ridge occurred because of volcanic eruption over time. And when this molten lava formed the seafloor, it actually recorded ambient geomagnetic data. So when you go from the very young ocean seafloor right next to the mid-ocean ridge to very, very old seafloor away from the mid-ocean ridge, a magnetometer basically unveils changes in the geomagnetic field for us,” Tominaga said. “The closer we can get to the seafloor, the better the signal. That’s the rule of thumb for geophysics.”
With the help of R/V Sikuliaq’s ship’s crew, Tominaga and Tivey, a cruise archivist who is also a computer engineer/scientist, and seven students (three of whom are undergraduates), the team will run daily operations 24 hours a day/seven days a week, deploying the magnetometers, collecting data and then moving on to the next site.
Naturally, the weather can waylay even the best plans. “Our goal is always about the science, but the road likely will be winding,” Tominaga said. “The most enjoyable part of this work is to be able to work together with this extremely diverse group of people. The Sikuliaq crew, the folks at UAF and those connected to the ship from NSF have all been committed to seeing this research happen, which is incredibly gratifying…. When we make things happen together as a team, it is really rewarding.”
Focus on fundamentals
Not surprisingly, this kind of oceanographic research is among some of the most fundamental, serving as a foundation for other research where it might correlate or illuminate. Additionally, because the causes and impacts of these geomagnetic changes are unknown, connections to currents, weather patterns, and other geologic phenomenon can still be explored also.
“NSF, along with the entire science community, has waited years for this unique state-of-the-art Arctic vessel, and the timing couldn’t be more critical,” said Rose DuFour, NSF program director. “Our hope is to use R/V Sikuliaq to help carry out the abundant arctic-based seagoing science missions that go beyond NSF-funded science and extend to those from other federal agencies, like Office of Naval Research as well.”
Tominaga notes that another key part to the cruise’s mission is record keeping; it’s why an archivist is part of her team. He even will blog daily (with pictures). As foundational research, it’s important to “keep every single record intact,” and she believes this broadcasting daily narrative will assist in this effort. Additionally, the plan is to share the collected data as soon as possible with other researchers who can benefit from it as well. “Without going there, getting real data—providing ground truth—how do we know what is going on?” Tominaga said, explaining fieldwork’s importance.
Tominaga is quite clear on what prompts her to keep one of the busiest fieldwork schedules, even during a season usually reserved for family and friends, sipping eggnog or champagne. “I was raised as a scientist/marine geophysicist, and I don’t just mean academically,” she said. “I really looked up to my mentors and friends and how they handed down what they know-so unselfishly. And when I was finishing my Ph.D., I realized that there will be a time I will hand down these things to the next generation. Now, as a professor at Michigan State University, I’m the one who has to pass the torch, if you will—knowledge, experience, and skills at sea. That’s what drives me.”
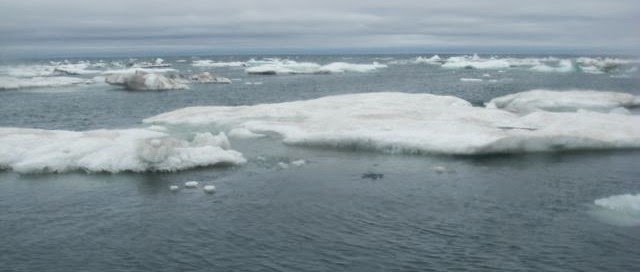
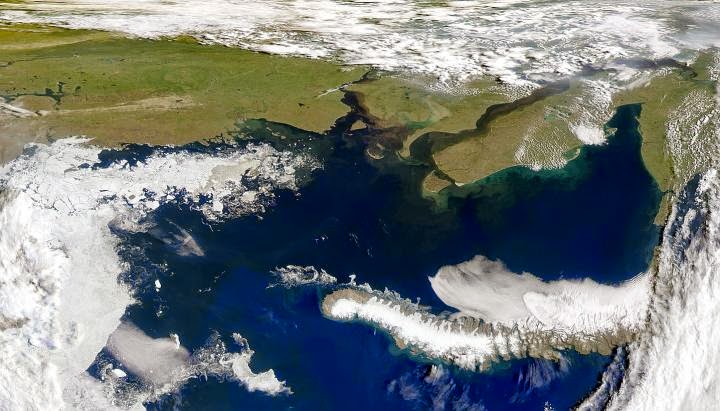
The sea ice in July 2014 as it begins to retreat from the Alaskan coast. Credit: University of Washington
The rapidly thawing Arctic Ocean may be a new frontier but some of the latest news from there concerns a clam that is believed to date back more than a million years.
Some bivalves retrieved from the ocean depths during a 2010 mapping mission in the Beaufort Sea turn out to be members of a species previously unknown to science, according to a study published in the journal ZooKeys.
Scientists from the U.S. Geological Survey, who were exploring the area aboard a Coast Guard icebreaking cutter, found the clam shells in a core sample dug with a 4-inch-diameter pipe into the seafloor.
The shells were found in the seafloor in water nearly 1.5 miles deep.
Once the shells were extricated from the Arctic Ocean sediment, a process accomplished at the USGS lab in Menlo Park, Calif., scientists could see that they were different from all other known species.
“I certainly didn’t know what they were,” said Paul Valentich-Scott, curator of malacology at the Santa Barbara Museum of Natural History, a mollusk expert recruited by the USGS geologists to be the lead author of the newly published study. “I definitely knew it wasn’t anything I had seen before.”
The clams, though small, were far bigger than others found far out in the Beaufort Sea – a couple of centimeters across instead of a couple of millimeters, Valentich-Scott said. They had a far rounder shape than others found in the general region, and maintained a thick brown skin, known as a periostracum, that was unlike the much thinner skin found on other clams, he said.
About 20 shells or shell fragments were found in sediments ranging from less than an inch below the seafloor to about 15 feet below.
Geologists, not biologists, conducted the mapping mission that resulted in the clams’ discovery, but they could tell that the shells were unusual, Valentich-Scott said.
“The chief scientist (Brian Edwards) recognized that there were some special animals out there,” he said.
That realization got Valentich-Scott involved in the project to identify the clams, work that included a comparison with known species documented as far away as Japan, New Zealand and Britain.
It turns out that this Beaufort Sea clam is not only a new species, but also a new genus, or category of species.
The genus is now named Wallerconcha, in honor of Thomas Waller, a paleontologist at the Smithsonian Institution. The new species name is Wallerconcha sarae, in honor of co-author Charles Powell’s daughter Sara.
Just how long the newly discovered clams lived in the region is unclear.
The site was a conical underwater formation known as the Canning Seafloor Mound, which rises about 590 feet high and stretches nearly 4,000 feet across. It is more than 90 miles off the coast of the Arctic National Wildlife Refuge. The expedition that made the discovery was a joint U.S.-Canada Beaufort Sea mapping mission, with scientists aboard both the Healy and a Canadian Coast Guard icebreaker, the Louis S. St-Laurent.
The most deeply buried samples were in sediment that, based on fossils it contained, was 1.8 million years old, Valentich-Scott said. But other samples closer to the seafloor surface were in far newer sediment, indicating that the clam may not be extinct.
The 1.8 million-year figure is considered “the oldest possible age it could be,” said Powell, a USGS research geologist. “Most likely, it’s been there for over a million years,” he said.
Live versions of the clams might even be somewhere near the samples collected in 2010, possibly right on the same sea mound but missed during the core sampling, he said. Unlike near-shore areas of the Arctic that have been transformed as sea levels rose and fell over past millennia, the habitat of this clam has not changed much, he said.
“It’s been pretty steady,” he said. “It’s dark and cold.”
Kara Sea is a section of the Arctic Ocean between Novaya Zemlya and the Yamal Peninsula on the Siberian mainland. Siberian permafrost extends to the seabed of the Kara Sea, and it is thawing. Credit : NASA
Yamal Peninsula in Siberia has recently become world famous. Spectacular sinkholes, appeared as out of nowhere in the permafrost of the area, sparking the speculations of significant release of greenhouse gas methane into the atmosphere.
What is less known, is that there is a lot of greenhouse gas methane released from the seabed offshore the West Yamal Peninsula. Gas is released in an area of at least 7500 m2, with gas flares extending up to 25 meters in the water column. Anyhow, there is still a large amount of methane gas that is contained by an impermeable cap of permafrost. And this permafrost is thawing.
“The thawing of permafrost on the ocean floor is an ongoing process, likely to be exaggerated by the global warming of the world´s oceans.” says PhD Alexey Portnov at Centre for Arctic Gas Hydrate, Climate and Environment (CAGE) at UiT, The Arctic University of Norway.
Portnov and his colleagues have recently published two papers about permafrost offshore West Yamal, in the Kara Sea. Papers look into the extent of permafrost on the ocean floor and how it is connected to the significant release of the greenhouse gas methane.
Permanently frozen soil
Permafrost, as the word implies, is the soil permanently frozen for two or more years. For something to stay permanently frozen, the temperature must of course stay bellow 0°C.
“Terrestrial Arctic is always frozen, average ground temperatures are low in Siberia which maintains permafrost down to 600-800 meters ground depth. But the ocean is another matter. Bottom water temperature is usually close to or above zero. Theoretically, therefore, we could never have thick permafrost under the sea,” says Portnov “However, 20 000 years ago, during the last glacial maximum, the sea level dropped to minus 120 meters. It means that today´s shallow shelf area was land. It was Siberia. And Siberia was frozen. The permafrost on the ocean floor today was established in that period.
Last glacial maximum was the period in the history of the planet when ice sheets covered significant part of the Northern hemisphere. These ice sheets profoundly impacted Earth’s climate, causing drought, desertification, and a dramatic drop in sea levels. Most likely the Yamal Peninsula was not covered with ice, but it was exposed to extremely cold conditions.
When the ice age ended some 12 000 years ago, and the climate warmed up, the ocean levels increased. Permafrost was submerged under the ocean water, and started it´s slow thawing. One of the reasons it has not thawed completely so far, is that bottom water temperatures are low, some – 0,5 degrees . That could very well change.
A fragile seal that is leaking
It was previously proposed that the permafrost in the Kara Sea, and other Arctic areas, extends to water depths up to 100 meters, creating a seal that gas cannot bypass. Portnov and collegues have found that the West Yamal shelf is leaking, profoundly, at depths much shallower than that.
Significant amount of gas is leaking at depths between 20 and 50 meters. This suggests that a continuous permafrost seal is much smaller than proposed. Close to the shore the permafrost seal may be few hundred meters thick, but tapers off towards 20 meters water depth. And it is fragile.
“The permafrost is thawing from two sides. The interior of the Earth is warm and is warming the permafrost from the bottom up. It is called geothermal heat flux and it is happening all the time, regardless of human influence. ” says Portnov.
Evolution of permafrost
Portnov used mathematical models to map the evolution of the permafrost, and thus calculate its degradation since the end of the last ice age. The evolution of permafrost gives indication to what may happen to it in the future.
If the bottom ocean temperature is 0,5°C, the maximal possible permafrost thickness would likely take 9000 years to thaw. But if this temperature increases, the process would go much faster, because the thawing also happens from the top down.
“If the temperature of the oceans increases by two degrees as suggested by some reports, it will accelerate the thawing to the extreme. A warming climate could lead to an explosive gas release from the shallow areas.”
Permafrost keeps the free methane gas in the sediments. But it also stabilizes gas hydrates, ice-like structures that usually need high pressure and low temperature to form.
“Gas hydrates normally form in water depths over 300 meters, because they depend on high pressure. But under permafrost the gas hydrate may stay stable even where the pressure is not that high, because of the constantly low temperatures.”
Gas hydrates contain huge amount of methane gas, and it is destabilization of these that is believed to have caused the craters on the Yamal Peninsula.
Video:
References:
Portnov, A. Mienert, J. Serov, P. 2014 Modeling the evolution of climate-sensitive Arctic subsea permafrost in regions of extensive gas expulsion at the West Yamal shelf. Journal of Geophysical Research: Biogeosciences 119 (11) http://onlinelibrary.wiley.com/doi/10.1002/2014JG002685/abstract
A volcano in southern Japan is spewing volcanic magma rocks. A regional weather observatory says this could be Mt. Aso’s first magma eruption in 22 years.
The term ‘living fossil’ was coined by Darwin and has since been applied to various species that appear not to have changed for millions of years. But when Africa Gómez and colleagues took a closer look at tadpole shrimps they concluded we should ditch the term for good.
In On the Origin of Species, Darwin used the term ‘living fossil’ informally, to convey how little lungfish and platypus had changed over millions of years. The label stuck, and is now commonly used to refer to species such as the coelacanth, the horseshoe crab and the ginkgo tree. Tadpole shrimps gained this epithet because ancient fossils of these small, pond-dwelling crustaceans appear almost indistinguishable from living species. Indeed, for over a century, tadpole shrimps (or more precisely the two genera Triops and Lepidurus which make up the order Notostraca) were regarded as a group that had diversified remarkably little since their origin over 300 million years ago – what we refer to as ‘morphological conservatism’.
Tadpole shrimps can be up to 10cm long when fully grown and have a broad oval carapace or shell at their front end and a long slender abdomen, giving them a tadpole-like shape. They live in temporary stands of water and their eggs can survive for a long time in dry sediment. In fact you may have encountered Triops ‘kits’ in shops – packets of eggs and food from which you can hatch your own small Triops as pets. The fact that these are often marketed as ‘from the age of the dinosaurs’ or ‘prehistoric sea monsters’ suggests the living fossil tag is firmly lodged in popular imagination.
But ‘living fossil’ has been taken to mean that evolution has stopped altogether. This was not what Darwin meant but in any case, is it true?
Tadpole shrimps may be morphologically conservative but a closer look reveals there’s a lot more to them, in particular the different ways they reproduce. Many populations are dioecious – they have equal frequencies of males and females – but others have mostly hermaphrodites and only a small proportion of males. This rare mechanism, known as androdioecy, is found in only a handful of animals. The hermaphrodites in androdioecious populations have sperm-producing lobes in their ovaries and they can both self-fertilise and mate with males.
Building on earlier work (see Planet Earth Winter 2008, www.planetearth.nerc.ac.uk/features/story.aspx?id=212) we set out to investigate the evolution of sexual systems in tadpole shrimps. In particular, we wanted to know when and how many times hermaphroditism had evolved, and whether it had favoured colonisation – after all, it would only take a single self-fertilising hermaphrodite to establish a new population. In order to do this, we had to establish an evolutionary tree for tadpole shrimps.
The first step was to spend months in the lab, hatching recalcitrant eggs from mud samples from around the world. Once we had enough individuals from each species we recorded the sex ratio and reproductive mode for each and sequenced a sample of nuclear and mitochondrial genes. Given the morphological conservatism of the group, we couldn’t use tadpole shrimp fossils to date episodes of diversification. So we reviewed the literature on other branchiopod crustaceans – the taxonomic group that includes Triops, water fleas and fairy shrimps – to find key dated fossils of related species. Then we calibrated evolutionary models with those dates and used our gene sequences to produce a dated evolutionary tree of tadpole shrimps.
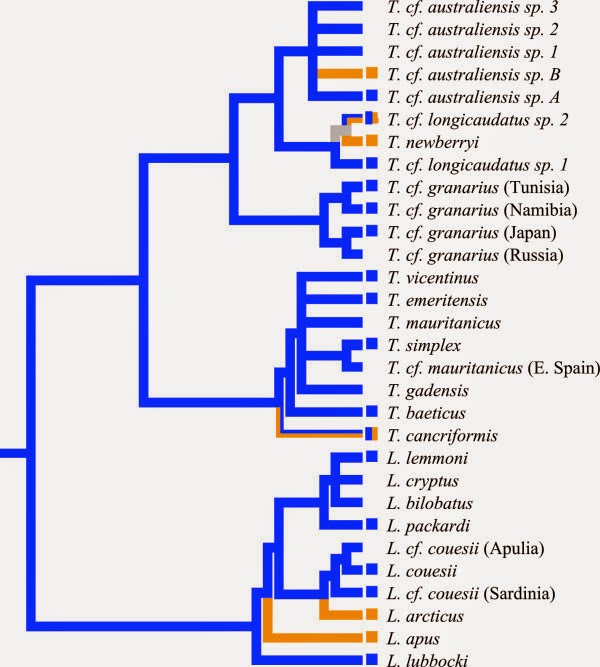
Once we had the evolutionary tree, we could use established computer programs to map the reproductive modes onto it to investigate how they had evolved. We found that five different evolutionary branches – or lineages – had hermaphroditic reproduction, and that they had most likely evolved independently.
We had seen in previous work that northern Europe was recolonised after the ice ages by hermaphroditic or androdioecious lineages of the European tadpole shrimp Triops cancriformis. This time we confirmed the correlation between hermaphroditism and latitude for the whole group: we found that species that live closer to the poles, and hence are likely to have colonised the area more recently after the ice ages, were more likely to be hermaphroditic. This supports the hypothesis that hermaphroditism confers an evolutionary advantage – because it only requires one individual it’s a surer way of colonising newly available environments. So the way tadpole shrimps reproduce has evolved over time to meet environmental challenges.
Evolutionary tree of reproductive mode.
Previous work had also revealed the presence of ‘cryptic species’ of Triops: species that look very similar but are genetically divergent and can’t interbreed. Our results revealed at least 38 species but there are probably many more waiting to be found in remote areas of the world. This abundance of cryptic species makes it very hard to assign tadpole shrimp fossils to a particular lineage – they just look so similar.
As a result the fossil record doesn’t reveal very much about patterns of evolution and diversification within the group and it’s this that misleads researchers to conclude that tadpole shrimps have changed little over their long evolutionary history. Our results showed that tadpole shrimps have in fact undergone several periods of radiation and extinction. Living tadpole shrimp species are much younger than the remarkably similar fossil ones and have had at least two episodes of evolutionary radiations. For example, 250-million-year-old fossils have been assigned to the living European species Triops cancriformis whereas our results indicate this species evolved less than 25 million years ago.
A multidisciplinary approach, using DNA sequences, fossils and natural history data from modern species, can give us a very detailed understanding of the evolution of different groups, and is critical to studies of enigmatic creatures like these.
Tadpole shrimps haven’t stopped evolving at all: their reproduction and physiology have evolved and they have experienced bouts of radiation, at least one of them quite recently. Our results agree with molecular and morphological studies of other so-called living fossils, which show they too evolve like any other organism – it’s just that their external form has survived the test of time. In short, evolution is not just skin-deep, or in this case carapace-deep, and we think the term ‘living fossil’ should be abandoned for good. Reference :
Africa Gómez is a lecturer in evolutionary biology at the University of Hull. The team comprised: Thomas Mathers, now at the Genome Analysis Centre in Norwich; Rob Hammond, University of Leicester; Bernd Hänfling, University of Hull; and Ronald Jenner, Natural History Museum, London.
Email: [email protected]
These free access papers detail the research reported here:
Mathers TC, Hammond RL, Jenner RA, Hänfling B, Gómez A (2013) Multiple global radiations in tadpole shrimps challenge the concept of ‘living fossils’. Peer J 1:e62. http://dx.doi.org/10.7717/peerj.62
Mathers, TC, Hammond, RL, Jenner, RA, Zierold, T, Hänfling, B, and Gómez, A (2013). High lability of sexual system over 250 million years of evolution in morphologically conservative tadpole shrimps. BMC evolutionary biology, 13(1), 30. http://www.biomedcentral.com/1471-2148/13/30
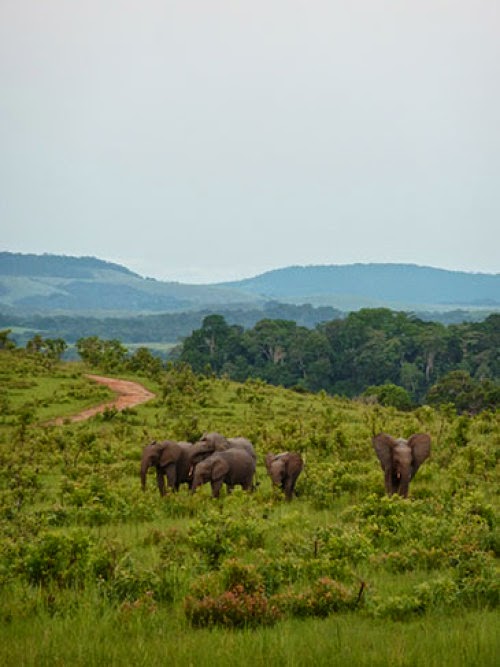
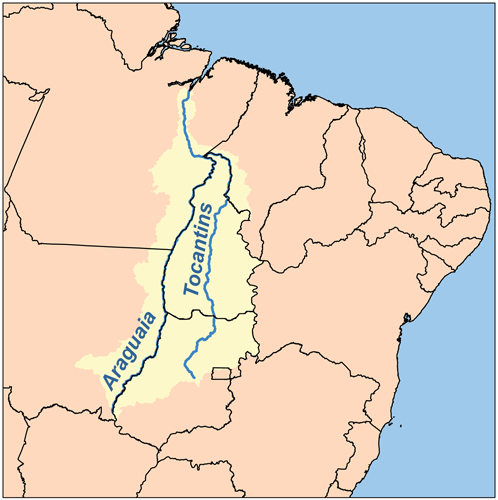
The Araguaia River is one of the major rivers of Brazil, and the principal tributary of the Tocantins, though it is almost equal in volume at its confluence with the Tocantins. It has a total length of approximately 2,627 km. Araguaia means “river of (red) macaws” in the Tupi language.
Geography
Because of the vast number of tributaries, it is not easy to define its source. Important tributaries originate in the Araras mountain range in Mato Grosso as well in the Divisões mountain range situated in Goiás (according to other sources however, the Araguaia comes from the Caiapó Range, at the Goiás-Mato Grosso border). From there it flows northeast to a junction with the Tocantins near the town of São João.
Along its course, the river forms the border between the Brazilian federal states of Goiás, Mato Grosso, Tocantins and Pará. Roughly in the middle of its course, the Araguaia splits into two forks (with the western one retaining the name Araguaia and the eastern one being called Rio Javaés). These later reunite, forming the Ilha do Bananal, the world’s largest river island. The mouth of the Javaés forms a broad inland delta where it pours back into the main Araguaia, a 100,000 hectare expanse of igapó flooded forest, blackwater river channels, and oxbow lakes called Cantão. This is one of the biologically richest areas of the eastern Amazon, with over 700 species of birds, nearly 300 species of fish, large populations of threatened species such as the giant otter, the black cayman, the world’s largest freshwater fish, the pirarucú, and the endemic Araguaian river dolphin (or Araguaian boto) all occurring within a relatively small area.
A large portion of the Araguaia’s course is navigable all year, but the river below the Cantão wetlands is interrupted by rapids.
The combined watershed of Araguaia and Tocantins rivers (named the Araguaia Tocantins Basin) covers approximately 9.5% of Brazil’s national territory. This area is an integral part of the Amazon Basin. However, the Araguaia River is not a tributary of the Amazon.
“Araguaia” means “River of the Macaws” in the native Tupi language.
Tributaries
Its principal tributary is the Rio das Mortes, which rises in the Serra de São Jerônimo, near Cuiabá, Mato Grosso, and is navigable to Pará.
Other important tributaries include the Bonito, Garcas, Cristallino and Tapirape on the west, and the Pitombas, Claro, Vermelho, Tucupa and Chavante on the east.
Note : The above story is based on materials provided by Wikipedia.
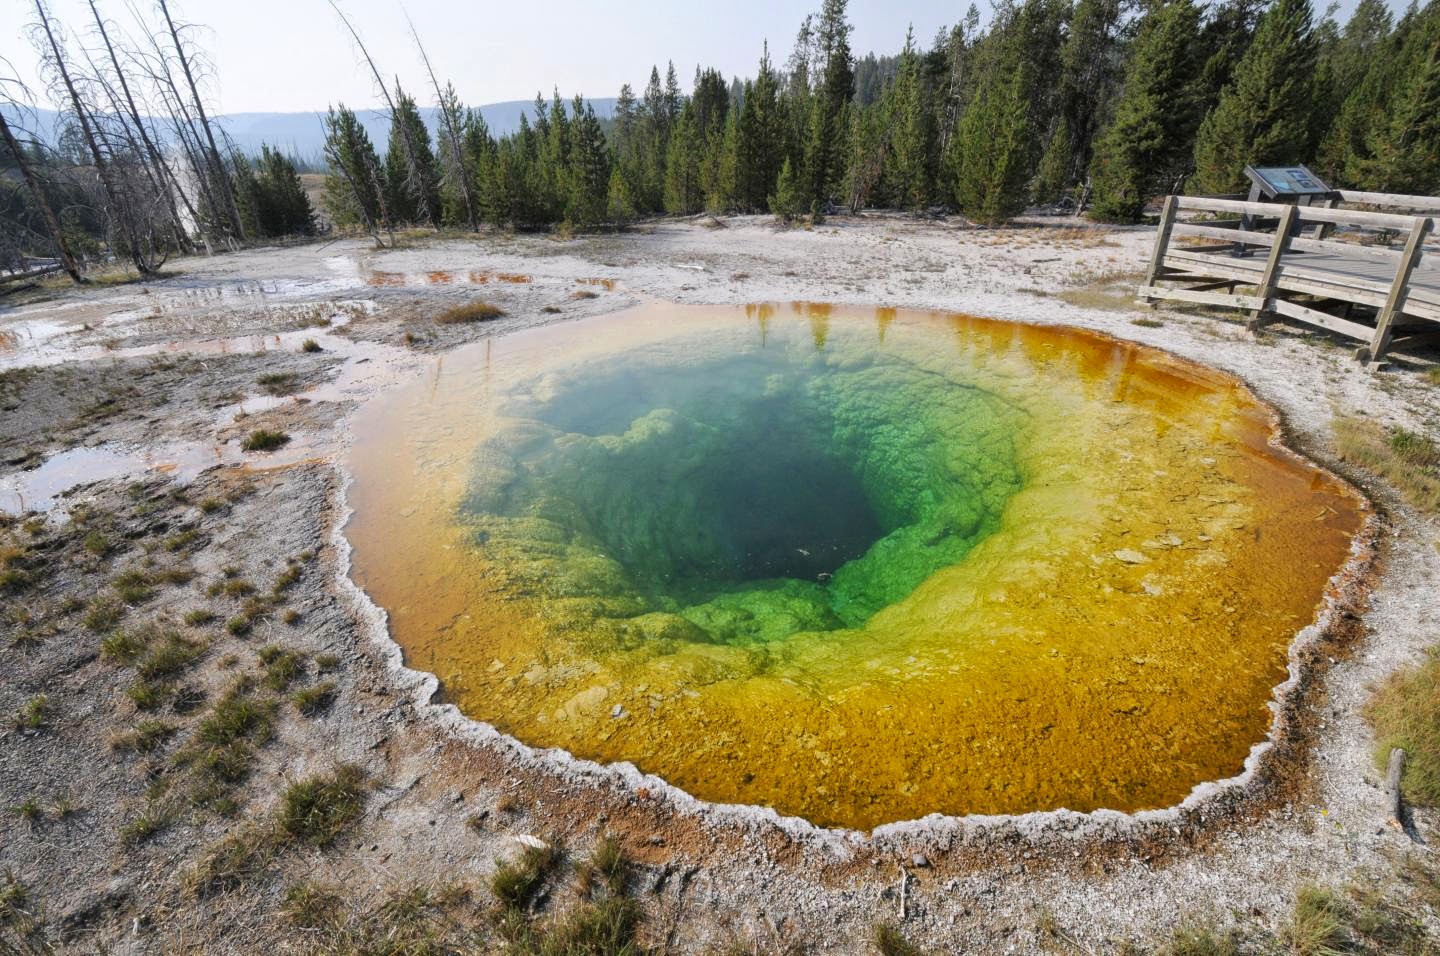
This is a photograph of Morning Glory Pool from Aug. 23, 2012. Credit: Joseph Shaw, Montana State University
Researchers at Montana State University and Brandenburg University of Applied Sciences in Germany have created a simple mathematical model based on optical measurements that explains the stunning colors of Yellowstone National Park’s hot springs and can visually recreate how they appeared years ago, before decades of tourists contaminated the pools with make-a-wish coins and other detritus.
The model, and stunning pictures of the springs, appear today in the journal Applied Optics, which is published by The Optical Society (OSA).
If Yellowstone National Park is a geothermal wonderland, Grand Prismatic Spring and its neighbors are the ebullient envoys, steaming in front of the camera and gracing the Internet with their ethereal beauty. While the basic physical phenomena that render these colorful delights have long been scientifically understood — they arise because of a complicated interplay of underwater vents and lawns of bacteria — no mathematical model existed that showed empirically how the physical and chemical variables of a pool relate to their optical factors and coalesce in the unique, stunning fashion that they do.
“What we were able to show is that you really don’t have to get terribly complex – you can explain some very beautiful things with relatively simple models,” said Joseph Shaw, a professor at Montana State University and director of the university’s Optical Technology Center. Shaw, along with his Ph.D. student Paul Nugent and German colleague Michael Vollmer, co-authored the new paper.
Using a relatively simple one-dimensional model for light propagation, the group was able to reproduce the brilliant colors and optical characteristics of Yellowstone National Park’s hot springs by accounting for each pool’s spectral reflection due to microbial mats, their optical absorption and scattering of water and the incident solar and diffuse skylight conditions present when measurements were taken.
“When we started the study, it was clear we were just doing it for fun,” Vollmer said. But they quickly discovered there was very little in the scientific literature on the subject. That’s when things got interesting.
Montana State University, in Bozeman, Mont., is a short drive away from Yellowstone National Park. In the summer of 2012, Vollmer, on sabbatical from the Brandenburg University of Applied Sciences, travelled with Shaw and Nugent to the park. Using handheld spectrometers, digital SLR cameras for visible images and long wave infrared thermal imaging cameras for non-contact measurement of the water temperatures, the group took measurements at a number of pools in Yellowstone, including Morning Glory Pool, Sapphire Pool and Grand Prismatic Spring. Using these data, along with previously available information about the physical dimensions of the pools, they were able to create a simple model whose renderings of the pools were strikingly similar to actual photographs.
In the case of Morning Glory Pool, they were even able to simulate what the pool once looked like between the 1880s and 1940s, when its temperatures were significantly higher. During this time, its waters appeared a uniform deep blue. An accumulation of coins, trash and rocks over the intervening decades has partially obscured the underwater vent, lowering the pool’s overall temperature and shifting its appearance to a terrace of orange-yellow-green. This change from blue was demonstrated to result from the change in composition of the microbial mats, as a result of the lower water temperature.
A general relationship between shallow water temperature (hence microbial mat composition) and observed colors was confirmed in this study. However, color patterns observed in deeper segments of the pool are caused more by absorption and scattering of light in the water. These characteristics – mats having greater effect on color in shallow water, and absorption and scattering winning out in the deeper areas – are consistent across all the measured pools.
“Our paper describes a very simple, 1-dimensional model, that gives the first clue if you really want to do more,” Vollmer said.
“We didn’t start this project as experts on thermal pools,” Shaw said. “We started this project as experts on optical phenomena and imaging, and so we had a lot to learn.”
“There are people at my university who are world experts in the biological side of what’s going on in the pools,” Shaw said. “They’re looking for ways to monitor changes in the biology – when the biology changes, that causes color changes – so we’re actually looking at possibilities of collaborating in the future.”
Future work for Nugent, Vollmer and Shaw includes delving further into infrared imaging at Yellowstone National Park.
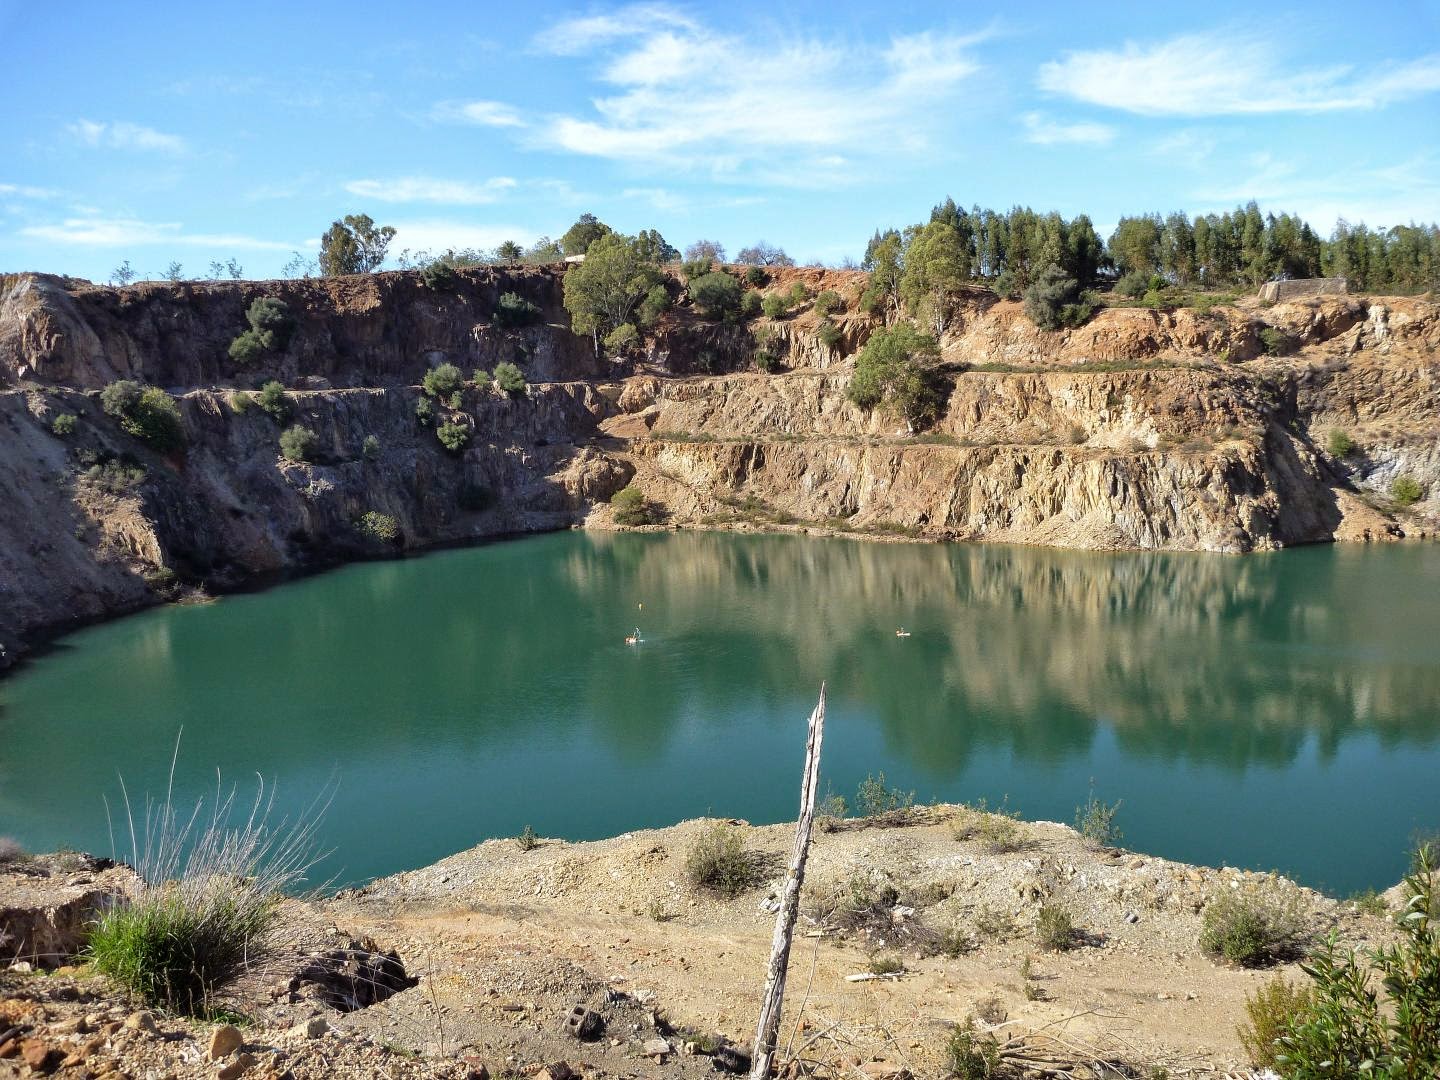
This is the pit Lake Guadiana in the former mining area Herrerias in Andalusia, Spain. Credit: Photo: Bertram Boehrer/UFZ
Puebla del Guzman (Andalusia) / Magdeburg. Being part of the mining area Herrerias in Andalusia, deep waters of Pit Lake Guadiana show extremely high concentration of dissolved carbon dioxide (CO2). In the case of a spontaneous ebullition, human beings close-by would be jeopardized.
To demonstrate the danger and the possible solution, scientists of the Spanish Institute of Geology and Mining, the University of the Basque Country (UPV/EHU, Bilbao) and the Helmholtz Centre for Environmental Research (UFZ) constructed a pilot plant for degassing. A fountain pulls deep water through a pipe to the surface, where the gas can escape from the water. The buoyancy produced by the bubbles provides the energy required for driving the flow.
„The deep water in the residual lake Guadiana contains an extremely high volume of carbon dioxide (CO2). Oxidation of ores has created a very acidic milieu, which is also known from other mining areas. In the mining area Herrerias however, this acidity dissolves carbonate from the rocks and produces carbonic acid (dissolved CO2), which can be accumulated under the high pressures of deep waters in the lake. There is not much circulation beyond 25 meter depth to remove the gas load” says Dr. Bertram Boehrer of UFZ, who is physicist and has been investigating stratification in lakes at many places on Earth. Due to the high hydrostatic pressure, each liter of deep water contains about 2.5 liters of CO2 gas. As long as the stratification remains stable, the gas is retained in the deep water. A land slide or other processes producing large water movements could facilitate a sudden release of gas previously confined under high pressure. Inhaled air of 8 percent CO2 are considered deadly for humans.
Now the scientists installed a degasing pipe which is the heart of the new pilot plant: Deep water enters a pipe at 61m depth. On the way up, hydrostatic pressure drops and gas bubbles form. The reduced density of the water-gas-mixture allows that deep water is pushed out of the pipe at the upper end to form a fountain above the water table, where gas is released to the atmosphere. This is an elegant solution, as the system does not require any additional driver, and the controlled release of CO2 does not pose any problem. „With this pilot plant, we could demonstrate that this approach also works in Guadiana pit lake. This can now be proposed to authorities as a possible approach to deal with the gas load.” Though the lake in the mining area is fenced and access is not permitted to the public, this prohibition is difficult to survey.
Earlier installations in Lake Nyos in Cameroon served as a good example for this approach. In this lake, degassing pipes had been installed, which released the gas load with three fountains. On August 21st 1986, a large volume of gas escaped from the lake suddenly. The gas entered valleys of the surrounding area. 1700 human beings and thousands of animals were killed. The trigger could have been a land slide though this was never really proven. To avoid a repetition of this disaster, the gas load is slowly removed from the lake. One more crater lake called Monoun in Cameroon suffocated 37 human beings close to its shores in a similar eruption. Also in Monoun degasing fountains have been installed.
In Guadiana pit lake we do not see the same danger as in Lake Nyos, due to smaller size and depth. In addition, a density gradient between surface waters and deep waters is keeping the system stable. However, gas concentrations are so high that precaution must be taken. More detailed investigations must be implemented and remediation must be considered, says Dr. Boehrer. For the formation of such extreme gas loads, lakes must be sufficiently deep with incomplete winter recirculation (meromixis) and a strong carbon dioxide source. At the moment, we do not have such a lake in Germany.
University of Pittsburgh researchers have shared their findings from three studies related to shale gas in a recent special issue of the journal Energy Technology, edited by Götz Veser, the Nickolas A. DeCecco Professor of Chemical and Petroleum Engineering in Pitt’s Swanson School of Engineering.
In the special issue focusing on shale gas, Pitt faculty authors look at “smart wells” that use wireless communication, wastewater management, and information gaps between legislators, regulators, industry representatives, researchers, and the public on the health and environmental impacts of shale gas drilling. The issue also includes contributions from experts from across the United States, Europe, and Asia.
Veser, who is on the journal’s editorial board, says, “I saw an opportunity to create visibility for the journal by issuing a special issue on this topic, which has garnered much attention worldwide, and at the same time highlight some of the world-class expertise in this area on our campus as well.”
Pitt faculty members contributed three papers to the issue.
Smart Wells
Andrew Bunger and his co-authors propose the development of a series of sensors sunk into wells that will allow drilling companies to pull data from the deep and use that information to optimize sections of productive wells, ramp up or shut down unproductive sections, and find pockets of gas or oil that have been overlooked.
Bunger, assistant professor of civil and environmental engineering, along with Ervin Sejdić, assistant professor of electrical and computer engineering, Nicholas Franconi, a PhD candidate in electrical and computer engineering, and Marlin Mickle, professor emeritus of electrical and computer engineering, believe academics and industry are poised to improve extraction through wireless communication.
Bunger likens this nascent technology to cell phone communication, with the signal being passed from tower to tower on a call from, say, Pittsburgh to Los Angeles rather than beamed directly over great distance. The stepwise process is necessary, he says, because of the difficulty of sending data long distances through rock and other geological media.
Wastewater Management
Pitt’s Radisav Vidic investigates methods to safely reuse drilling wastewater and ways of removing potentially harmful substances, including naturally occurring radioactive materials, from the wastewater.
Vidic, the William Kepler Whiteford Professor and Chair in the Department of Civil and Environmental Engineering and a nationally recognized expert in water issues related to fracking, reviews the management of wastewater produced during fracking in Pennsylvania’s Marcellus Shale reserve. In this paper, he is joined by co-authors Can He, Tieyuan Zhang, Xuan Zheng, and Yang Li, all of Pitt’s Department of Civil and Environmental Engineering.
Information Gaps
Shanti Gamper-Rabindran examines the gaps in the collection of information–and access to that information–which prevents the public, researchers, regulators, and investors from fully understanding the health and environmental impacts from the shale industry. Resolving these information gaps would enable further innovations in risk-management strategies and, thus, benefit the industry and society.
She is an associate professor in Pitt’s Graduate School of Public and International Affairs and the Department of Economics within the Kenneth P. Dietrich School of Arts and Sciences.
“Informed public debate in the lifecycle of unconventional shale gas development is critical because of the uncertainties in its benefits and risks, the unequal distribution of these benefits and risks in society, and the need to make evidence-based trade-offs between the benefits and costs of risk-mitigation strategies,” Gamper-Rabindran writes.