back to top
27.8 C
New York
Sunday, November 17, 2024
Home Blog Page 261

Rock-dwelling microbes remove methane from deep sea

Illustration of methane mound on seafloor near Santa Monica Bay. Credit: Kelly Lance ©2013 MBARI

Methane-breathing microbes that inhabit rocky mounds on the seafloor could be preventing large volumes of the potent greenhouse gas from entering the oceans and reaching the atmosphere, according to a new study by Caltech researchers.

The rock-dwelling microbes, which are detailed in the Oct. 14 issue of Nature Communications, represent a previously unrecognized biological sink for methane and as a result could reshape scientists’ understanding of where this greenhouse gas is being consumed in subseafloor habitats, says Professor of Geobiology Victoria Orphan, who led the study.

“Methane is a much more powerful greenhouse gas than carbon dioxide, so tracing its flow through the environment is really a priority for climate models and for understanding the carbon cycle,” Orphan says.

Orphan’s team has been studying methane-breathing marine microorganisms for nearly 20 years. The microbes they focus on survive without oxygen, relying instead on sulfate ions present in seawater for their energy needs. Previous work by Orphan’s team helped show that the methane-breathing system is actually made up of two different kinds of microorganisms that work closely with one another. One of the partners, dubbed “ANME” for “ANaerobic MEthanotrophs,” belongs to a type of ancient single-celled creatures called the archaea.

Through a mechanism that is still unclear, ANME work closely with bacteria to consume methane using sulfate from seawater. “Without this biological process, much of that methane would enter the water column, and the escape rates into the atmosphere would probably be quite a bit higher,” says study first author Jeffrey Marlow, a geobiology graduate student in Orphan’s lab.

Until now, however, the activity of ANME and their bacterial partners had been primarily studied in sediments located in cold seeps, areas on the ocean bottom where methane is escaping from subseafloor sources into the water above. The new study marks the first time they have been observed to oxidize methane inside carbonate mounds, huge rocky outcroppings of calcium carbonate that can rise hundreds of feet above the seafloor.

If the microbes are living inside the mounds themselves, then the distribution of methane consumption is significantly different from what was previously thought. “Methane-derived carbonates represent a large volume within many seep systems, and finding active methane-consuming archaea and bacteria in the interior of these carbonate rocks extends the known habitat for methane-consuming microorganisms beyond the relatively thin layer of sediment that may overlay a carbonate mound,” Marlow says.

Orphan and her team detected evidence of methane-breathing microbes in carbonate rocks collected from three cold seeps around the world: one at a tectonic plate boundary near Costa Rica; another in the Eel River basin off the coast of northwestern California; and at Hydrate Ridge, off the Oregon coast. The team used manned and robotic submersibles to collect the rock samples from depths ranging from 2,000 feet to nearly half a mile below the surface.

Marlow has vivid memories of being a passenger in the submersible Alvin during one of those rock-retrieval missions. “As you sink down, the water outside your window goes from bright blue surface water to darker turquoise and navy blue and all these shades of blue that you didn’t know existed until it gets completely dark,” Marlow recalls. “And then you start seeing flashes of light because the vehicle is perturbing the water column and exciting florescent organisms. When you finally get to the seafloor, Alvin’s exterior lights turn on, and this crazy alien world is illuminated in front of you.”

The carbonate mounds that the subs visited often serve as foundations for coral and sponges, and are home to rockfishes, clams, crabs, and other aquatic life. For their study, the team members gathered rock samples not only from carbonate mounds located within active cold seeps, where methane could be seen escaping from the seafloor into the water, but also from mounds that appeared to be dormant.

Alvin surfacing after dive to the methane seeps and maneuvering towards ship. Research ship R/V Atlantis can be seen in the distance. Credit: V. Orphan

Once the carbonate rocks were collected, they were transported back to the surface and rushed into a cold room aboard a research ship. In the cold room, which was maintained at the temperature of the deep sea, the team cracked open the carbonates in order to gather material from their interiors. “We wanted to make sure we weren’t just sampling material from the surface of the rocks,” Marlow says.

Using a microscope, the team confirmed that ANME and sulfate-reducing bacterial cells were indeed present inside the carbonate rocks, and genetic analysis of their DNA showed that they were related to methanotrophs that had previously been characterized in seafloor sediment. The scientists also used a technique that involved radiolabeled 14C-methane tracer gas to quantify the rates of methane consumption in the carbonate rocks and sediments from both the actively seeping sites and the areas appearing to be inactive. They found that the rock-dwelling methanotrophs consumed methane at a slower rate than their sediment-dwelling cousins.

Mound 12 in Costa Rica (~1000 meters water depth) taken from the inside of the Alvin submersible. From the view port you see an active methane seep with sulfide-oxidizing chemosynthetic mussels colonizing authigenic carbonates exposed at the seabed. Credit: V. Orphan

“The carbonate-based microbes breathed methane at roughly one-third the rate of those gathered from sediments near active seep sites,” Marlow says. “However, because there are likely many more microbes living in carbonate mounds than in sediments, their contributions to methane removal from the environment may be more significant.”

The rock samples that were harvested near supposedly dormant cold seeps also harbored microbial communities capable of consuming methane. “We were surprised to find that these marine microorganisms are still viable and, if exposed to methane, can continue to oxidize this greenhouse gas long after surface expressions of seepage have vanished.” Orphan says.

More information:
“Carbonate-hosted methanotrophy represents an unrecognized methane sink in the deep sea.” Marlow, Jeffrey J. and Steele, Joshua A. and Ziebis, Wiebke and Thurber, Andrew R. and Levin, Lisa A. and Orphan, Victoria J. (2014) Carbonate-hosted methanotrophy represents an unrecognized methane sink in the deep sea. Nature Communications, 5 (10). Art. No. 6094. ISSN 2041-1723. resolver.caltech.edu/CaltechAU… S:20141002-104139439

Note : The above story is based on materials provided by California Institute of Technology

Fossilized bird egg offers clues to Brazil’s prehistoric past

The first fossil avian egg from Brazil. Credit: Júlio Cesar. de A. Marsola et al. The first fossil avian egg from Brazil. Alcheringa: An Australasian Journal of Palaeontology, 2014; : 1 DOI: 10.1080/03115518.2014.926449

Brazilian scientists have discovered a near-intact fossilised bird egg — the country’s first — in Sao Paulo State.

As Julio Cesar de A. Marsola and his colleagues explain in the journal Alcheringa, their discovery is significant for many reasons. Compared to the abundance of eggs from non-avian dinosaurs, finds of complete eggs from Mezosoic birds are relatively scarce.

Although no remains were found inside this particular egg, known formally as LPRP USP-0359, the team’s extensive tests revealed important information about both the egg itself and its wider context. Their observations suggest that LPRP-USP0359 is, in fact, one of the smallest and thinnest shelled Mesozoic bird eggs ever found.

Moreover, similarities between the Brazilian egg and specimens from Argentina suggests an affinity between them as Ornithothoraces. Given further similarities in where and how the eggs were found, the researchers suggest that the two birds may also have preferred the same types of breeding and nesting habitats — important clues that will help palaeontologists build up a more detailed picture of South America’s Mesozoic past.

Journal Reference:
Júlio Cesar. de A. Marsola, Gerald Grellet-Tinner, Felipe C. Montefeltro, Juliana M. Sayão, Annie Schmaltz Hsiou, Max C. Langer. The first fossil avian egg from Brazil. Alcheringa: An Australasian Journal of Palaeontology, 2014; 1 DOI: 10.1080/03115518.2014.926449

Note : The above story is based on materials provided by Taylor & Francis.

Prehistoric crocodiles’ evolution mirrored in living species

Three species of Machimosaurus are shown with a human diver for scale. Credit: Dmitry Bogdanov

Crocodiles which roamed the world’s seas millions of years ago developed in similar ways to their modern-day relatives, a study has shown.

Fresh research into a group of prehistoric marine crocs known as Machimosaurus reveals key details of how and where they lived.

Each species adapted features that enabled them to live and hunt in a range of habitats, just like modern-day crocodiles. They varied in body length, body skeleton, skull and lower jaw shape, and in their teeth.

The ancient croc group included a nine-metre long saltwater species, which was adapted for living in open seas, and fed on marine turtles. Its closest relatives, by contrast, lived in coastal, choppy environments.

The prehistoric crocs’ development mirrors those of today’s crocodiles, whose saltwater varieties are far bigger and suited to larger territories compared with their smaller cousins that live closer to shore or in freshwater.

A team of researchers, led by the University of Edinburgh, examined fossil specimens from museums around Europe. From detailed analysis, they were able to determine key elements of the animals’ anatomy and lifestyle, and concluded that not all were of the same species.

Until now, scientists were unsure whether more than one species of Machimosaurus existed. However, their findings show that there were at least three distinct species — one of which has been fully identified for the first time. The study is published in the journal Royal Society Open Science.

Dr Mark Young, of the University of Edinburgh’s School of GeoSciences, who led the study, said: “Interesting parallels can be seen between groups of ancient crocodiles and those living today, with some able to swim out in the open sea, with others restricted to the coast. With more fossils being discovered, we look forward to learning more about this giant group of Jurassic predators.”

Note : The above story is based on materials provided by University of Edinburgh.

Meteorite fragments discovered 20 years after bolide event in Czech Republic

First three Benešov meteorites found in April 2011, with metal detectors. From left to right: H5 chondrite of 1.56 g, LL3.5 chondrite of 7.72 g with achondrite clast, and LL3.5 chondrite of 1.99 g [2]. Credit: Image courtesy of Astronomy & Astrophysics
Astronomy & Astrophysics is publishing the spectacular discovery of meteorite fragments 20 years after the corresponding bolide was seen in the skies of the Czech Republic. This discovery was made possible by reanalyzing the trajectory, which moved the impact line by 330 meters. Interestingly, the meteorites found on the ground are of different types, pointing to a parent asteroid of heterogeneous composition.Collisions of meter-sized meteoroids with Earth’s atmosphere are relatively rare, occurring about 40 times a year. They cause very spectacular events, known as superbolides. One of the best known such events, the Benešov bolide, occurred on 7 May 1991 at 23h 03m 46s UT over the Czech Republic. It was recorded during systematic photographic observations by the European Fireball Network and certainly ended in a multiple meteorite fall, but no meteorite was found in the weeks and years after the fall, despite many attempts.In February 2011, nearly 20 years after the event, P. Spurný and his colleagues [1] measured the records again and analyzed the data with improved methods. This led to a new picture of the whole event with a revised atmospheric trajectory and a new impact location. This allowed the team to recover the Benešov meteorites, 20 years after the fall, exactly in the newly predicted area. It is the first time a meteorite is found so long after the bolide observation.The team found four small, highly-weathered meteorites with a total mass of 12 g. The probability that these four fragments come from different meteoroids and were found by chance at the same place is estimated to be 1 in 100,000 or less. Even more interestingly, these four meteorites are of three different mineralogical types. This means that the Benešov meteoroid was heterogeneous and contained at least three different types of material. After the Almahata Sitta fall, this is the second time that such a heterogeneous composition has been found. It raises the possibility that a significant fraction of all asteroids are heterogeneous and that they were strongly reprocessed by collisions with other asteroids in the main belt.

[1] The team includes P. Spurný, J. Haloda, J. Borovička, L. Shrbený, and P. Halodová.
[2] The reader can find details about the meterorite classification on various, well-documented web sites such as http://www.meteorite.fr/en/news/or http://www4.nau.edu/meteorite.

Note : The above story is based on materials provided by Astronomy & Astrophysics.

Evidence for basaltic volcanism on the Moon within the past 100 million years

Some of the 70 irregular mare patches (s – smooth; u – uneven) Dr Braden and her colleagues identified on the Moon’s surface. Image credit: NASA / GSFC / Arizona State University.

A new study published in the journal Nature Geoscience has identified 70 volcanic features scattered across the lunar surface, all younger than 100 million years old.

Episodes of excessive basaltic magmatism occurred on the Moon from 3.9 to 3.1 billion years ago. And volcanic activity continued until it halted 1 billion years ago – or so researchers have long thought.

However, the discovery of previously unknown geologic features shows that the Moon has seen small eruptions of basaltic lava during the past 100 million years.

These features, termed irregular mare patches (0.1–5 km wide), are too small to be seen from our planet.

One of the largest, a well-studied area called Ina, was imaged from lunar orbit by Apollo 15 astronauts in the 1970s.

Researchers have found evidence for 70 young volcanic structures on the moon’s near side. NASA/GSFC/Arizona State University

Some early studies indicated that Ina could be very young (10 million years or less), but only a few irregular mare patches were known then, and their significance was unclear.

The ages of the 70 irregular mare patches come from previous studies of crater sizes and numbers within a given area. These crater-counting dates are linked to lab ages provided by Apollo and Luna samples.

The results show that instead of volcanism stopping abruptly about a billion years ago, it ended more gradually, continuing until less than 50 million years ago.

Activity at Ina, the scientists found, ended about 33 million years ago, and at another irregular mare patch, Sosigenes, it stopped only about 18 million years ago.

“The existence and young age of the irregular mare patches provides a new constraint for models of the lunar interior’s thermal evolution. The lunar mantle had to remain hot enough for long enough to provide magma for the small-volume eruptions,” said study lead author Dr Sarah Braden of Arizona State University.

These young volcanic features are now prime targets for future exploration, both robotic and human.

S. E. Braden et al. Evidence for basaltic volcanism on the Moon within the past 100 million years. Nature Geoscience, published online October 12, 2014; doi: 10.1038/ngeo2252

Note : The above story is based on materials provided by Sci-News

Some sections of the San Andreas Fault system in San Francisco Bay Area are locked, overdue

San Andreas Fault. Credit: © davetroesh123 / Fotolia

Four urban sections of the San Andreas Fault system in Northern California have stored enough energy to produce major earthquakes, according to a new study that measures fault creep. Three fault sections — Hayward, Rodgers Creek and Green Valley — are nearing or past their average recurrence interval, according to the study published in the Bulletin of the Seismological Society of America (BSSA).

The earthquake cycle reflects the accumulation of strain on a fault, its release as slip, and its re-accumulation and re-release. Fault creep is the slip and slow release of strain in the uppermost part of the Earth’s crust that occurs on some faults between large earthquakes, when much greater stress is released in only seconds. Where no fault creep occurs, a fault is considered locked and stress will build until it is released by an earthquake.

This study estimates how much creep occurs on each section of the San Andreas Fault system in Northern California. Enough creep on a fault can diminish the potential size of its next earthquake rupture.

“The extent of fault creep, and therefore locking, controls the size and timing of large earthquakes on the Northern San Andreas Fault system,” said James Lienkaemper, a co-author of the study and research geophysicist at U.S. Geological Survey (USGS). “The extent of creep on some fault sections is not yet well determined, making our first priority to study the urban sections of the San Andreas, which is directly beneath millions of Bay Area residents.”

Understanding the amount and extent of fault creep directly impacts seismic hazard assessments for the region. The San Andreas Fault system in Northern California consists of five major branches that combine for a total length of approximately 1250 miles. Sixty percent of the fault system releases energy through fault creep, ranging from 0.1 to 25.1 mm (.004 to 1 inch) per year, and about 28 percent remains locked at depth, according to the authors.

Monitoring of creep on Bay Area faults has expanded in recent years. The alignment array measurements made by the San Francisco State University Creep Project and recently expanded GPS station networks provide the primary data on surface creep, which the authors used to estimate the average depth of creep for each fault segment. Where available, details of past ruptures of individual faults, unearthed in previous paleoseismic studies, allowed the authors to calculate recurrence rates and the probable timing and size of future earthquakes.

According to the study, four faults have accumulated sufficient strain to produce a major earthquake. Three creeping faults have large locked areas (less than 1 mm or .04 inches of creep per year) that have not ruptured in a major earthquake of at least magnitude 6.7 since the reporting of earthquakes by local inhabitants: Rodgers Creek, northern Calaveras and southern Green Valley. The southern Hayward fault, which produced a magnitude 6.8 earthquake in 1868, is now approaching its mean recurrence time based on paleoseismic studies.

The authors also estimate three faults appear to be nearing or have exceeded their mean recurrence time and have accumulated sufficient strain to produce large earthquakes: the Hayward (M 6.8), Rodgers Creek (M 7.1) and Green Valley (M 7.1).

“The San Andreas Fault and its two other large branches, the Hayward and Northern Calaveras, have been quiet for decades. This study offers a good reminder to prepare today for the next major earthquake,” said Lienkaemper.

Note : The above story is based on materials provided by Seismological Society of America.

Earth’s magnetic field could flip within a human lifetime

The ‘north pole’ — that is, the direction of magnetic north — was reversed a million years ago. This map shows how, starting about 789,000 years ago, the north pole wandered around Antarctica for several thousand years before flipping 786,000 years ago to the orientation we know today, with the pole somewhere in the Arctic. Credit: Image courtesy of University of California – Berkeley

Imagine the world waking up one morning to discover that all compasses pointed south instead of north.

It’s not as bizarre as it sounds. Earth’s magnetic field has flipped — though not overnight — many times throughout the planet’s history. Its dipole magnetic field, like that of a bar magnet, remains about the same intensity for thousands to millions of years, but for incompletely known reasons it occasionally weakens and, presumably over a few thousand years, reverses direction.

Now, a new study by a team of scientists from Italy, France, Columbia University and the University of California, Berkeley, demonstrates that the last magnetic reversal 786,000 years ago actually happened very quickly, in less than 100 years — roughly a human lifetime.

“It’s amazing how rapidly we see that reversal,” said UC Berkeley graduate student Courtney Sprain. “The paleomagnetic data are very well done. This is one of the best records we have so far of what happens during a reversal and how quickly these reversals can happen.”

Sprain and Paul Renne, director of the Berkeley Geochronology Center and a UC Berkeley professor-in- residence of earth and planetary science, are coauthors of the study, which will be published in the November issue of Geophysical Journal International and is now available online.

Flip could affect electrical grid, cancer rates

The discovery comes as new evidence indicates that the intensity of Earth’s magnetic field is decreasing 10 times faster than normal, leading some geophysicists to predict a reversal within a few thousand years.

Though a magnetic reversal is a major planet-wide event driven by convection in Earth’s iron core, there are no documented catastrophes associated with past reversals, despite much searching in the geologic and biologic record. Today, however, such a reversal could potentially wreak havoc with our electrical grid, generating currents that might take it down.

And since Earth’s magnetic field protects life from energetic particles from the sun and cosmic rays, both of which can cause genetic mutations, a weakening or temporary loss of the field before a permanent reversal could increase cancer rates. The danger to life would be even greater if flips were preceded by long periods of unstable magnetic behavior.

“We should be thinking more about what the biologic effects would be,” Renne said.

Dating ash deposits from windward volcanoes

The new finding is based on measurements of the magnetic field alignment in layers of ancient lake sediments now exposed in the Sulmona basin of the Apennine Mountains east of Rome, Italy. The lake sediments are interbedded with ash layers erupted from the Roman volcanic province, a large area of volcanoes upwind of the former lake that includes periodically erupting volcanoes near Sabatini, Vesuvius and the Alban Hills.

Italian researchers led by Leonardo Sagnotti of Rome’s National Institute of Geophysics and Volcanology measured the magnetic field directions frozen into the sediments as they accumulated at the bottom of the ancient lake.

Sprain and Renne used argon-argon dating, a method widely used to determine the ages of rocks, whether they’re thousands or billions of years old, to determine the age of ash layers above and below the sediment layer recording the last reversal. These dates were confirmed by their colleague and former UC Berkeley postdoctoral fellow Sebastien Nomade of the Laboratory of Environmental and Climate Sciences in Gif-Sur-Yvette, France.

Because the lake sediments were deposited at a high and steady rate over a 10,000-year period, the team was able to interpolate the date of the layer showing the magnetic reversal, called the Matuyama-Brunhes transition, at approximately 786,000 years ago. This date is far more precise than that from previous studies, which placed the reversal between 770,000 and 795,000 years ago.

“What’s incredible is that you go from reverse polarity to a field that is normal with essentially nothing in between, which means it had to have happened very quickly, probably in less than 100 years,” said Renne. “We don’t know whether the next reversal will occur as suddenly as this one did, but we also don’t know that it won’t.”

Unstable magnetic field preceded 180-degree flip

Whether or not the new finding spells trouble for modern civilization, it likely will help researchers understand how and why Earth’s magnetic field episodically reverses polarity, Renne said.

The magnetic record the Italian-led team obtained shows that the sudden 180-degree flip of the field was preceded by a period of instability that spanned more than 6,000 years. The instability included two intervals of low magnetic field strength that lasted about 2,000 years each. Rapid changes in field orientations may have occurred within the first interval of low strength. The full magnetic polarity reversal — that is, the final and very rapid flip to what the field is today — happened toward the end of the most recent interval of low field strength.

Renne is continuing his collaboration with the Italian-French team to correlate the lake record with past climate change.

Renne and Sprain’s work at the Berkeley Geochronology Center was supported by the Ann and Gordon Getty Foundation.

Note : The above story is based on materials provided by University of California – Berkeley. The original article was written by Robert Sanders.

GPlates “Interactive Visualisation Of Plate-tectonics”

GPlates is desktop software for the interactive visualisation of plate-tectonics.

GPlates offers a novel combination of interactive plate-tectonic reconstructions, geographic information system (GIS) functionality and raster data visualisation. GPlates enables both the visualisation and the manipulation of plate-tectonic reconstructions and associated data through geological time. GPlates runs on Windows, Linux and MacOS X.
GPlates is free software (also known as open-source software), licensed for distribution under the GNU General Public License (GPL), version 2.

Screenshots

GPlates 1.2.0 (January 2012) his screenshot shows a map view of the classic “Blue Marble” bathymetry and topography raster reconstructed using present day static polygons and an age grid. Also shown is the Small Circle tool being used to create small circle features.
GPlates 1.4.0 (April 2014) Velocities smoothed across a plate boundary avoid abrupt changes in nearby plate velocities.
GPlates 1.3.0 (May 2013) The General Bathymetric Chart of the Ocean (GEBCO) raster.
GPlates 1.3.0 (May 2013) Cross sections through the mantle temperature scalar field coloured by isovalue (temperature) with topological plate boundaries overlaid on top. Cooler sections show up as green/yellow and highlight subducting plates.
GPlates 1.3.0 (May 2013) Mantle temperature isosurface with semi-transparent deviation window. The surface mask includes the entire surface of the globe except the Eurasian plate. The polygon walls show isolines where the isosurface and its two deviation isosurfaces intersect the wall.

Download

GPlates 1.4 : Download 

GPlates-compatible data : Download

Load data in GPlates

To load the global coastline file and the rotation file in GPlates:
  1. Download each data file and save it to disk.
  2. Pull down the GPlates File menu.
  3. Select the operation Open Feature Collection….
To load a sequence of time-dependent raster images (for example, Bernhard Steinberger’s dynamic topography images) in GPlates:
  1. Download the file “dynamic-topography.zip”, save it to disk, and unzip it.
  2. Pull down the GPlates File menu and select the operation Import Time-dependent Raster….
  3. Click the Add Directory button.
  4. Choose the “jpg” folder inside the “dynamic topography” folder. (Don’t browse into the “jpg” folder; instead, click the folder once to select it, then press the Choose button.)
  5. Choose the Next button of the dialog to finish the import wizard.
Copyright © GPlates

Challenges and ethics of harvesting the mineral wealth of the deep sea

Scientists launch the autonomous underwater vehicle Sentry during an investigation of the Kermadec Arc in 2011. Credit: GNS Science

One of the great challenges facing all societies is to achieve a balance between economic growth and environmental integrity. It’s not easy and it requires buy-in from all sectors of society.

As a maritime nation, New Zealand has an Exclusive Economic Zone (EEZ) and Extended Continental Shelf (ECS) totalling about 5.7 million km2. The active geological nature of the area means parts of New Zealand’s EEZ are now of great interest for the mining of seabed minerals. One such area is the Kermadec Volcanic Arc.

In this area, breaks in the submarine crust of the Earth’s surface allow cold sea-water to enter into the rock, where it is heated. This hot water, which contains metals such as gold, copper, silver, zinc and also rare earth elements, is forced out of the ground to form chimney-like hydrothermal vent systems. Given their high metal content, the chimneys and vent sites (collectively called seafloor massive sulphide deposits) are potential sites of future mining activity. Associated with these deposits are well-developed and often unique biological communities that will be damaged or destroyed when mining commences.

Initial assessments of global mineral wealth from the seafloor put the value of these resources well into the trillions of dollars. Increasing world demand for minerals, plus technological advances, have combined to make deep-sea mineral extraction a possibility right now.

New Zealand is likely to consider mining activities within its EEZ in the future. Large areas were licenced for prospecting as far back as 2002 and new legislation, such as the Exclusive Economic Zone and Continental Shelf (Environmental Effects) Act 2012, has been enacted with seabed mining specifically in mind.

Ongoing research, funded by the New Zealand government and by industry, is identifying and characterising the location and extent of mineral deposits. Based on the size and economic potential of mineral deposits, the mining industry suggests that one in every 10, or perhaps one in every 20, seafloor massive sulphide deposits may be economically viable and therefore mineable.

The New Zealand public is generally very aware of environmental issues, both on land and in the sea. There are however, a number of key questions that need to be answered before mining commences so that the mining company/ies, the New Zealand Government and the people of New Zealand all understand and agree to the costs and benefits of this opportunity.

If mining is to commence then it needs to be environmentally sustainable and to cause minimum ecosystem damage. To achieve this we need detailed site-specific and broader regional information about directions and strengths of current flow, and about where the new biological recruits come from (the source populations) and where they go (the sink populations). Because vent sites may act like “stepping stones” for dispersal of animals along a ridge, it is crucially important to understand the impact of mining activity at each site. The loss of an individual site to mining activity may have profound consequences on the stepping stone model of connectivity among vent sites if animals cannot disperse beyond it. Thus, science has an important role to play in the identification of sites to be mined and sites that are not to be mined (what are called “set asides”) because of their biological importance.

It is clear that the mineral wealth of the deep sea is vast and that mining technology has developed to a stage where many mineral deposits are now extractable. It is also clear that this new opportunity to access rare and commercially important metals presents society and resource managers with questions and challenges about the limits and balances of blue growth and the maritime economy. Within New Zealand, further debate is needed so that informed decisions can be made about the balance between exploitation and conservation that we, as a society, wish to pursue.

 Note : The above story is based on materials provided by Victoria University

St. Marys River

St. Marys River connects Lake Superior (top left) to Lake Huron (bottom and right)

The St. Marys River (French: rivière Sainte-Marie), sometimes written as the St. Mary’s River, drains Lake Superior, starting at the end of Whitefish Bay and flowing 74.5 miles (119.9 km) southeast into Lake Huron, with a fall of 23 feet (7.0 m). For its entire length it is an international border, separating Michigan in the United States from Ontario, Canada.

The twin cities of Sault Ste. Marie, Ontario, and Sault Ste. Marie, Michigan are connected across the St. Marys River by the Sault Ste. Marie International Bridge. The St. Marys Rapids are just below the river’s exit from Lake Superior and can be bypassed through the Soo Locks and the Sault Ste. Marie Canal.

Two of the Ontario tributaries of this river are the Garden River and the Bar River. Other Canadian tributaries include Fort Creek, the Root River, the Little Carp River, the Big Carp River, the Lower Echo River, Desbarats River, and the Two Tree River. The American tributaries to the St. Mary River are the Gogomain River, the Munuscong River, the Little Munuscong River, the Charlotte River, and the Waiska River.

Islands

  • Drummond Island (Michigan)
  • Neebish Island (Michigan)
  • St. Joseph Island (Ontario)
  • Squirrel Island (Ontario / Garden River First Nation)
  • Sugar Island (Michigan)
  • Whitefish Island (Ontario / Batchewana First Nation)

Note : The above story is based on materials provided by Wikipedia

Supersized dinosaurs divided up their dinner

Skulls of Camarasaurus (left) and Diplodocus (right). The pair above show the models of the skulls with reconstructed muscle groups, and the ones below show the reconstructed stresses in the skulls (low stress is blue, through to high stress in red). Photograph: David Button

The giant sauropod dinosaurs such as Diplodocus and Apatosaurus are familiar thanks to their huge sizes and unique body shapes of a long neck and tail with a tiny head perched on top. Among their ranks were the largest terrestrial animals of all time, and yet an enduring mystery remains: how did so many animals of this size get to be so big?

Take a look at modern faunas. There are rarely more than one or two megaherbivores – multi-tonne giants that can (and generally do) eat any plant material they can get hold of. Although we are lacking a number of big species now thanks to various relatively recent extinctions, it is still pretty normal for mammal faunas to have only a handful of giant herbivorous species over a tonne or so.

For the sauropods, though, there were often numerous species (many of which would easily top 10 tonnes, and plenty were many times this figure) in the same ecosystem. Even allowing for the propensity of dinosaurs to get very big, this is something of an ecological anomaly. Large species are typically not too selective about what they eat (their size allows them to effectively digest even tough things like wood, while they can’t afford to be picky eaters and go for only small, if high-quality, foods such as seeds) so we would only expect a few species to be able to coexist.

A new study published in the Proceedings of the Royal Society of London, however, tackles this problem. It had been noted that the skulls and teeth of sauropods could be used to break them down into two basic groups: those with relatively lightly built skulls and teeth suitable for nipping, and animals with stronger skulls and larger teeth apparently more suitable for tougher foods. So researchers sought to compare the two for their mechanical performance and see if these different heads really were well suited for different tasks.

Digital scans were made of the skulls of Diplodocus and Camarasaurus – animals that lived alongside each other in the Jurassic of North America and that are now preserved in rocks termed the Morrison Formation. The two sauropods selected represent the nipping and strong skull types, respectively, and are excellent examples of the two basic forms and, unlike many sauropods, both have good skull material available. Based on marks on the skulls and comparisons to living animals, the muscles of the jaws could be added to the model to give the heads real bite. This then allows researchers to assess how much power could be delivered and how the arrangements of the heads would resist the forces from biting.

Camarasaurus was seen to have a much stronger bite and was better able to deal with such stress in the bones of the cranium. This implies they were adapted to a more coarse diet and although they doubtless would take what they could get, they would have been able to effectively handle tough, and especially woody, food. This is also a good match for wear marks on the teeth that indicate a diet of primarily coarse foodstuffs, but the pattern contrasts sharply with Diplodocus. Here the skull was weaker and could not deliver so powerful a bite. Instead the head seems better adapted to softer vegetation, and both wear on the teeth and adaptations seen in the bones of the neck show that these animals would feed by stripping branches and twigs of their leaves rather than biting through them.

The lead author on the study, David Button of the University of Bristol, said: “The Morrison Formation represents a particularly interesting case in Earth’s history as it presents a staggering diversity of sauropods, but yet was a seasonally semi-arid environment not conducive to excessive plant productivity. The results from our various analyses corroborate previous works looking at gross anatomy and tooth wear, and together give us a decent grounding of the ecology of these animals. Although a lot of work still needs to be done to refine this picture, we can see that their ecological interactions were really pretty sophisticated, which would have been important in supporting the observed diversity.”

A second analysis in the study compared a whole series of sauropod skulls in terms of their shape and structure. This shows that other sauropods in the Morrison that lived alongside Diplodocus and Camarasaurus fell somewhere on the gradient between these two extremes, or even adopted very different skulls shapes entirely.

In short, although these huge animals would have been strongly competing for food, they had evolved rather different ways of tacking the available plant material, which would have reduced competition between them. This separation would have been enhanced (in adults at least) by different neck lengths and body sizes, which would have facilitated different species feeding at different heights on the available plants, just as giraffe, rhino and zebra typically feed at different levels today. As Button notes, “sauropod skulls also provide interesting data in the broader context of the evolution of sauropod feeding mechanisms, where we see the repeated evolution of similar functional complexes.”

There is clearly further complexity to be unravelled here, for example juveniles of large species might well have interfered with the adults of those with a lesser reach, and some sauropod faunas have such huge diversity that a few different head shapes do not seem to separate them far enough to have allowed so many species to coexist. Even so, this analysis is a major step forwards in our understanding of sauropod evolution and ecology and how this group of enigmatic giants ate their way across the Mesozoic landscapes.

Button, D.J., Rayfield, E.J., Barrett, P.M. 2014. Cranial biomechanics underpins high sauropod diversity in resource-poor environments. Proceedings of the Royal Society B.

Note : The above story is based on materials provided by  Dr Dave Hone for theguardian.com

Physics determined ammonite shell shape

The mechanical model predicts the correlations observed between rib frequency and amplitude and the shell’s general shape in ammonites (blue morphological space) and nautili (red morphological space) The 3D-views produced by the model are juxtaposed with fossil specimens, ammonites and nautili, that have a similar shape. The ribs tend to disappear for the broadly open shell shapes that have characterized nautili for almost 200 million years. W = expansion rate D = coiling tightness Credit: Copyright: © Derek Moulton, Alain Goriely and Régis Chirat

Ammonites are a group of extinct cephalopod mollusks with ribbed spiral shells. They are exceptionally diverse and well known to fossil lovers. Régis Chirat, researcher at the Laboratoire de Géologie de Lyon: Terre, Planètes et Environnement (CNRS/Université Claude Bernard Lyon 1/ENS de Lyon), and two colleagues from the Mathematical Institute at the University of Oxford have developed the first biomechanical model explaining how these shells form and why they are so diverse. Their approach provides new paths for interpreting the evolution of ammonites and nautili, their smooth-shelled distant “cousins” that still populate the Indian and Pacific oceans. This work has just been published on the website of the Journal of Theoretical Biology.

The shape of living organisms evolves over time. The questions raised by this transformation have led to the emergence of theories of evolution. To understand how biological shapes change over a geological time scale, researchers have recently begun to investigate how they are generated during an individual’s development and growth: this is known as morphogenesis. Due to the exceptional diversity of their shell shapes and patterns (particularly the ribs), ammonites have been widely studied from the point of view of evolution but the mechanisms underlying the coiled spirals were unknown until now. Researchers therefore attempted to elucidate the evolution of these shapes without knowing how they had emerged.

Régis Chirat and his team have developed a model that explains the morphogenesis of these shells. By using mathematical equations to describe how the shell is secreted by ammonite and grows, they have demonstrated the existence of mechanical forces specific to developing mollusks. These forces depend on the physical properties of the biological tissues and on the geometry of the shell. They cause mechanical oscillations at the edge of the shell that generate ribs, a sort of ornamental pattern on the spiral.

By examining various fossil specimens in light of the simulations produced by the model, the researchers observed that the latter can predict the number and shape of ribs in several ammonites. The model shows that the ornamentation of the shell evolves as a function of variables such as tissue elasticity and shell expansion rate (the rate at which the diameter of the opening increases with each spiral coil).

By providing a biophysical explanation for how these ornamentations form, this theoretical approach explains the diversity existing within and between species. It thus opens new perspectives for the study of the morphological evolution of ammonites, which seems to be largely governed by mechanical and geometric constraints. This new tool also sheds light on an old mystery. For almost 200 million years, the shells of nautili, distant “cousins” of ammonites, have remained essentially smooth and free of distinctive ornamentation. The model shows that having maintained this shell shape does not mean that nautili — wrongly referred to as “living fossils” — have not evolved, but is due to a high expansion rate, leading to the formation of smooth shells that are difficult to distinguish from one another.

More generally, this work highlights the value of studying the physical bases of biological development: understanding the “construction rules” underlying the morphological diversity of organisms makes it possible to partially predict how their shape evolves.

Note : The above story is based on materials provided by CNRS (Délégation Paris Michel-Ange).

How dinosaurs divided their meals at the Jurassic dinner table

The completed skull model of the Late Jurassic North American sauropod dinosaur, Camarasaurus. Credit: David Button

How the largest animals to have ever walked the Earth fed, and how this allowed them to live alongside one another in prehistoric ecosystems is the subject of new research from the University of Bristol and the Natural History Museum, London.

The sauropods — large, long-necked plant-eating dinosaurs such as Diplodocus and Brachiosaurus — dominated the land between 210 and 65 million years ago. They were the largest land animals of all time, with the biggest weighing 80 tonnes (more than 11 elephants) and would have needed vast amounts of food.

Despite this, multiple sauropod species often lived alongside each other. The most notable example is the community of the Late Jurassic Morrison Formation, a distinctive sequence of sedimentary rock in the western United States from which over 10 species of sauropod are known.

How so many giant herbivores could have coexisted has long been a mystery: even the highly diverse faunas seen in modern Africa only support one truly gigantic species, the elephant. This is made even more puzzling by the harsh, semi-arid environment of the Morrison Formation during the Jurassic, which would have limited plant growth.

A study conducted by David Button, a PhD student in Bristol’s School of Earth Sciences and the Natural History Museum, and colleagues used a novel combination of approaches to investigate this problem.

Although sauropods were gigantic, their heads were comparatively very small and so how they ingested enough food has puzzled many scientists. The researchers focussed on the skull and jaws of sauropods, using a variety of biomechanical techniques to investigate how they functioned and what this would mean for sauropod ecology.

Using CT scans, the researchers digitally reconstructed the skulls of the sauropods Camarasaurus and Diplodocus, along with the jaw and neck muscles of both species from the traces left on the bones where these muscles were attached in life. These two species are very common in the Morrison Formation, and are known to have widely co-existed. From this data, a biomechanical computer model of the skull of Camarasaurus was built using Finite Element Analysis (FEA), a modelling technique often employed in engineering and design to calculate stress and strain distribution in complex shapes. This model was then compared to a pre-existing model of Diplodocus in order to investigate how the dinosaurs fed.

David Button said: “Our results show that although neither could chew, the skulls of both dinosaurs were sophisticated cropping tools. Camarasaurus had a robust skull and strong bite, which would have allowed it to feed on tough leaves and branches. Meanwhile, the weaker bite and more delicate skull of Diplodocus would have restricted it to softer foods like ferns. However, Diplodocus could also have used its strong neck muscles to help it detach plant material through movements of the head. This indicates differences in diet between the two dinosaurs, which would have allowed them to coexist.”

The researchers also used a series of biomechanical measurements from other sauropod species to calculate the functional disparity in their skulls and jaws and found that other Morrison Formation sauropods were also highly varied in feeding adaptations, suggesting different diets.

Co-author, Professor Emily Rayfield of the University of Bristol said: “In modern animal communities differences in diet such as this — termed ‘dietary niche partitioning’ — allow multiple similar species to coexist by reducing competition for food. Although, dietary niche partitioning has been suspected between Morrison Formation sauropods based on their structural features and patterns of tooth-wear, this is the first study to provide strong, numerical, biomechanical evidence for its presence in this fossil community.”

The research also helps to shed light on the evolution of sauropod feeding mechanisms and how these gigantic creatures managed to eat enough food to sustain their tremendous bulk. Whereas earlier sauropods would have been able to eat a wide range of plants, later lineages show the parallel evolution of traits suggesting that they were more specialized in their feeding habits.

Co-author Professor Paul Barrett of the Natural History Museum added: “Our study provides insight not only into the ecology of dinosaurs but more generally into the mechanisms supporting species-richness in other animal communities, both from the fossil record and in the present-day.”

Note : The above story is based on materials provided by University of Bristol.

Ancient rhino-relatives were water-loving

Pictured here are two jaws from anthracobunids recovered from 48 million year old sediments next to a horse skull. The study found that anthracobunids were an ancient relative of horses, rhinos, and tapirs. Credit: Copyright Cooper Lab, NEOMED

The discovery of new bones from a large land mammal that lived about 48 million years ago has led scientists to identify a new branch of mammals closely related to modern horses, rhinos, and tapirs, according to a study published October 8, 2014 in the open-access journal PLOS ONE by Lisa Noelle Cooper from Northeast Ohio Medical University and colleagues.

This family of large mammals, Anthracobunidae, is only known from India and Pakistan and was commonly considered to be ancestors of modern elephants and sea cows. Geographically, this was a puzzling idea, because elephants and their relatives were groups that were known from Africa, not Asia. These new fossils indicate that anthracobunids are related to the tiny tapirs that are well known from the Pakistani rocks, and that perissodactyls probably originated in Asia.

Researchers also analyzed stable isotopes and bone shape, finding that these animals most likely fed on land and were large and lumbering, but spent a considerable amount of time near water, similar to modern rhinos and tapirs. Dr. Lisa Noelle Cooper added, “Anthracobunids are just one of many lineages of vertebrates that evolved from terrestrial animals, but then left to live in a shallow water habitat and had thick bones. These thick bones probably acted like ballast to counteract body buoyancy. You can see that kind of bone structure in modern hippos, otters, penguins, and cormorants.”

Co-author Erik Seiffert added, “The evidence that has been accumulating from fossils and genes strongly suggests that the ancestor of elephants and sea cows lived in Africa, and at a time when that continent was totally isolated, so anthracobunids’ Asian distribution was hard to explain.”

Note : The above story is based on materials provided by PLOS.

Sleeping sands of the Kalahari awaken after more than 10,000 years

Without grasses to anchor the dunes in place, their sand grains blow in the wind. Credit: Paolo D’Odorico

In Africa’s Kalahari desert, red sand dunes stretch as far as the eye can see–and beyond. Kalahari dunes, asleep for more than 10,000 years, have awakened: They’re moving across the landscape. Scientists are tracking the dunes to find out why. Credit: Paolo D’Odorico

Kalahari. The name conjures an arid, almost lifeless expanse, its red, iron oxide sands stretching to the horizon and beyond.

Kgala, Tswana natives called it, the great thirst. Kgalagadi, it’s also named: the waterless place.

But huge subterranean water reserves lie under the Kalahari, which covers parts of Botswana, Namibia and South Africa. Dragon’s Breath Cave, the largest non-subglacial underground lake on Earth, is buried there.

The Kalahari was once a much wetter place, with ancient Lake Makgadikgadi covering today’s Makgadikgadi Pan. The lake dried out 10,000 years ago.

Today the Kalahari’s wettest areas receive 20 inches of rain each year; its driest, four to eight inches. Grasses green up in the rainy season.

After it rains, grazing animals have a field day. And therein may be the Kalahari’s greatest challenge, say scientists Paolo D’Odorico of the University of Virginia and Greg Okin of the University of California, Los Angeles (UCLA).

As nomadic as the Kalahari’s San bushmen, D’Odorico and Okin move from place to place, setting up camp in game reserves, local village farms and communal lands to study the desert’s dunes.

Sleeping sands awaken

The sands, last on-the-move more than 10,000 years ago, have awakened. “The dunes are active again,” says D’Odorico, “and it’s happened in just the last three to four decades.”

The introduction of pumps to ferry water from deep under the Kalahari to its surface has provided sustenance for livestock and fostered increasing herd sizes. The boreholes allow ranchers to use arid areas once grazed only in wet years.

“The shift from traditional pastoralism to borehole-dependent ranching, however, has resulted in the degradation of the Kalahari,” says D’Odorico.

Cattle-grazing has led to the takeover of grasslands by shrubs and other woody vegetation.

Between 1930 and 1990, the grazed area of the Kgalagadi district in the southern Kalahari increased from 5,019 square miles to 12,355 square miles, and the number of boreholes increased from eight in 1955 to more than 380 in 1990.

Are we trampling the life out of the Kalahari?

Without grasses to anchor the dunes in place, their sand grains are blowing in the wind.

“Vegetation stabilizes the sediments,” says Okin. “Where there’s enough plant cover, the wind blows on by.” Once the grasses are gone, the sands start moving, their grains carried to new destinations by passing breezes.

“Many dune fields around the world have undergone alternating periods of mobilization and stabilization in response to changes in winds and rainfall,” write D’Odorico and Okin in a paper published in the January 2014, issue of the Ecological Society of America journal Ecosphere.

Co-authors of the paper are Abinash Bhattachan of the University of Virginia, Kebonyethata Dintwe of UCLA, and Scott Collins of the University of New Mexico.

“In modern times, disturbances associated with land use are believed to be a dominant factor contributing to the activation of stabilized vegetated dunes in drylands,” the scientists write.

“The process could lead to an activation of aeolian [wind-borne] transport in the region, with important implications for the biogeochemistry of downwind terrestrial and marine ecosystems.”

Sand dune tipping point?

It’s unclear, say D’Odorico and Okin, whether the Kalahari’s dunes hang on the edge of a tipping point between their current state—”vegetated fixed linear dunes”—or have moved to what researchers call a degraded state, “barren and active dunes.”

Dunes transform from stable to active after plant cover is reduced beyond a critical level.

“It’s important to understand whether a landscape is undergoing a transition to degraded conditions,” says D’Odorico, “and whether a reduction in land-use intensity might lead to the recovery of vegetation in active dune fields.”

For example, in the Negev Desert along the Egypt-Israel border, the Israeli side’s dunes are stabilized by vegetation; on the Egyptian side, however, the dunes are moving because overgrazing has left them barren.

Since the border was established in 1982, wood-gathering and grazing have ceased on the Israeli side. Its once-degraded dunes restabilized within two years.

In the Kalahari, dune mobilization is ongoing, especially in overgrazed areas close to boreholes and villages, D’Odorico and Okin have found.

“Understanding thresholds and tipping points is fundamental to predicting the future behavior of Earth’s surface under changing environmental conditions,” says Paul Cutler, program director in the National Science Foundation’s Division of Earth Sciences, which funds the Kalahari dune research.

“This project aims to improve our understanding of the land-use practices that play a part in potentially far-reaching changes, and to sharpen predictions of atmospheric dust loading from the Southern Hemisphere.”

From dust to dust: Kalahari sands reborn in the sea?

Drylands are the main sources of Earth’s atmospheric dust. To date, the Northern Hemisphere has accounted for about 90 percent of global atmospheric dust emissions.

Such dust emissions from the Southern Hemisphere have been relatively low, “but reductions in vegetation cover due to land use or climate change may allow new sources like the Kalahari to emerge,” says D’Odorico.

Where would all that dust—in this case, from Kalahari sands—end up?

Dust grains from the red dunes may be carried on the wind from Africa as far as the Southern Ocean. Once deposited there, their iron content could be enough to boost the productivity of marine phytoplankton, feeding new blooms of these microscopic algae and altering ocean ecosystems.

From dust to dust—or dune to plankton.

Note : The above story is based on materials provided by National Science Foundation

Major new fault found in New Zealand capital

Large cracks caused by an earthquake on July 21, 2013 pictured at the Port Wellington Container terminal

A new geological fault capable of generating a 7.1-magnitude earthquake has been found in Wellington, confirming the New Zealand capital’s status as one of the world’s most seismically active cities, scientists revealed Wednesday.

Geologists from the official NIWA research agency said the Aotea fault began on the floor of Wellington Harbour and was believed to extend through the central city and southern suburbs.

NIWA marine geologist Philip Barnes said there was evidence that the most recent earthquake caused by the fault occurred about 6,200 years ago and it was impossible to know if another temblor was overdue.

“We do believe that it has recurrence intervals of several thousand years,” he told reporters. “We have no idea when it might rupture in the future.”

New Zealand Prime Minister John Key said it was “fanciful” to suggest the country’s capital should be moved because of the quake threat.

“It doesn’t actually change anything—there are other big fault lines in Wellington,” he told reporters.

“This just shows we’re getting better at finding out where they are.”

GeoNet earthquake geologist Russ Van Dissen said the latest discovery was just one of “dozens” of active faults crisscrossing the Wellington terrain, the biggest capable of generating an 8.5-magnitude tremor.

He said the city’s existing building codes should deal with any quake from the new fault.

“There’s no way of saying that a magnitude seven is inconsequential, it would be damaging,” he said. “But the level of shaking for this fault, we anticipate, would be less than what this city’s already designed for.”

Van Dissen said there were probably more undiscovered faults beneath the city.

“How does it compare internationally? You’ve got the North Anatolian fault going right through Istanbul, there’s a number of other cities, Tokyo, San Francisco, Los Angeles, Seattle that all have a significant active fault earthquake hazard,” he said.

New Zealand, known colloquially as the Shaky Isles, lies on the boundary of the Australian and Pacific tectonic plates, forming part of the so-called “Ring of Fire”, and experiences up to 15,000 tremors a year.

In 2011, a devastating 6.3-magnitude quake on a previously unknown fault in the South Island city of Christchurch killed 185 people—one of the nation’s deadliest disasters of the modern era.

Wellington was the scene of the country’s most powerful earthquake in 1855.

That 8.2-magnitude jolt changed the city’s entire geography, pushing the shoreline out 200 metres (660 feet) as it thrust the harbour floor upwards, but only caused four deaths.

The capital has experienced three quakes measuring 6.3 or above since July last year, with little damage beyond items falling off shelves and cracked masonry.

Shaking from a 5.1 tremor on the other side of the North Island was felt in the city as recently as Monday, barely raising comment among locals.

Note : The above story is based on materials provided by © 2014 AFP

Observing the Birkeland currents

Plots of AMPERE magnetic perturbations and radial current density from the northern hemisphere for 24 February 2014 with start times from 1530 UT through 1700 UT. Credit: Image courtesy of Wiley

When the supersonic solar wind hits Earth’s magnetic field, a powerful electrical connection occurs with Earth’s field, generating millions of amperes of current that drive the dazzling auroras. These so-called Birkeland currents connect the ionosphere to the magnetosphere and channel solar wind energy to Earth’s uppermost atmosphere. Solar storms release torrential blasts of solar wind that cause much stronger currents and can overload power grids and disrupt communications and navigation.

Now for the first time, scientists are making continuous, global measurements of the Birkeland currents, opening a new window on our understanding of our home planet’s response to solar storms. Using the Active Magnetosphere and Planetary Electrodynamics Response Experiment, based on the 66 Iridium satellites orbiting Earth, authors of a Geophysical Research Letters study have discovered that Earth’s response to onsets in forcing from the solar wind occurs in two distinct stages.

Currents first appear near noon in the polar regions and remain steady for about half an hour. Then the second stage begins, when strong currents appear near midnight and eventually join the initial currents near noon. Most of the solar wind energy is deposited in the polar atmosphere by processes initiated in the second stage. The authors note that scientists are working to understand how the delay between the first and second stages could give near-term warning of impending space weather disruptions.

Note : The above story is based on materials provided by Wiley.

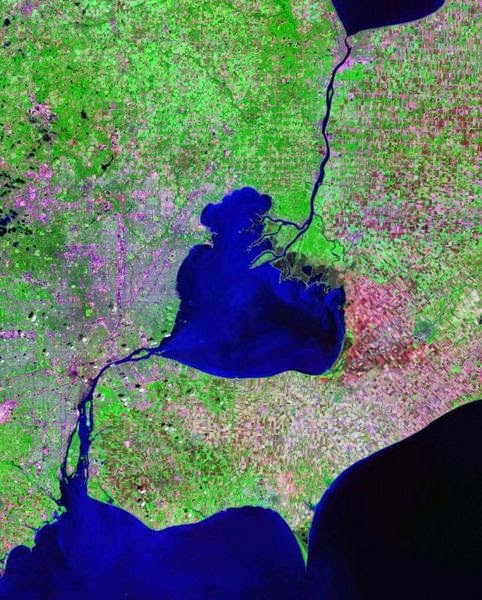
St. Clair River

Landsat satellite photo, showing Lake Saint Clair (center), as well as St. Clair River connecting it to Lake Huron (to the North) and Detroit River connecting it to Lake Erie (to the South)

The St. Clair River is a 40.5-mile-long (65.2 km) river in central North America which drains Lake Huron into Lake St Clair, forming part of the international boundary between the Canadian province of Ontario and the U.S. state of Michigan. The river is a significant component in the Great Lakes Waterway, with shipping channels permitting cargo vessels to travel between the upper and lower Great Lakes.

Location

The river, which some consider a “strait,” flows in a southerly direction, connecting the southern end of Lake Huron to the northern end of Lake St. Clair. It branches into several channels near its mouth at Lake St. Clair, creating a broad delta region known as the St. Clair Flats.

Size

The river is 40.5 miles (65.2 km) long and drops 5 feet (2 m) in elevation from Lake Huron to Lake St. Clair. The flow rate averages around 182,000 cubic feet per second (5,200 m3/s), and the drainage area is 223,600 square miles (579,000 km2). This takes into account the combined drainage areas of Lakes Huron, Michigan, and Superior.

Erosion and Great Lakes Drainage

Federal officials have long acknowledged that dredging and riverbed mining in the St. Clair dropped the long-term average of Great Lakes Huron and Michigan by about 16 inches. A bi-national Great Lakes water-level study concluded in 2013 that unexpected erosion since the last major St. Clair dredging project in the early 1960s has dropped the lakes’ long-term average by an additional 3 to 5 inches. Today, these lakes are nearly 2 feet lower than before human modifications to the riverbed of the St. Clair River. This record low has raised concerns about the long-term health of the lakes. Activists urge remediation to slow the flow of waters through the St. Clair River and out of the lake system, to restore former water levels.

Note : The above story is based on materials provided by Wikipedia

Researchers gather extensive dataset from Icelandic volcano eruption

Tungurahua Volcano Photograph by Dolores Ochoa, AP

A team of researchers from Cambridge’s Department of Earth Sciences have recently returned from Iceland where, thanks to a bit of luck, they have gathered the most extensive dataset ever from a volcanic eruption, which will likely yield considerable new insights into how molten rock moves underground, and whether or not it erupts.

The team, led by Professor Bob White, has been monitoring activity near the Bárðarbunga and Holuhraun volcanoes since 2006, using up to 70 broadband seismometers.

Luckily, the seismometers and field researchers were still in Iceland at the time that this most recent volcanic activity began, as the team had recently finished recovering 25 seismometers from the Vatnajökull ice cap where they had been used for a study of small quakes caused by ice cracking.

Here, White and PhD student Tim Greenfield discuss their work, and what it’s like to be up close to such a spectacular eruption.

Video:

Note : The above story is based on materials provided by University of Cambridge

Arctic bacteria show long evolution in toxic mercury resistance

The researchers dig holes in the snowpack over sea ice to establish vertical snow profiles used for sampling of the snow at different depths. Credit: Niels Kroer

With Mars and Europa out of reach, many scientists have turned to studying some of the Arctic and Antarctic microbes that have adapted to similarly harsh conditions on Earth.

One recent study has traced the evolutionary branches of Arctic bacterial resistance to toxic mercury—an adaptation that appears to have an ancient lineage. The results of a previous expedition to the Arctic found that up to 31 percent of bacteria retrieved from various locations and grown in lab cultures contain the mercuric reductase gene(merA), a genetic sequence that encodes an enzyme that is capable of breaking down toxic mercury into a more harmless chemical form. That’s a crucial survival trait, as growing mercury emissions from human sources add to natural sources to dump more than 300 tons of the toxic contaminant in the Arctic every year. The latest research finds evidence of merA having both recent and ancient evolutionary lineages among the samples of Arctic bacteria.

“This suggests that merA has been present in the High Arctic for an extended time period, and that mercury contamination of the Arctic is not a new phenomenon,” said Niels Kroer, a microbiologist and head of the Department of Environmental Science at Aarhus University in Denmark. “In other words, transport of mercury to the high Arctic by the atmosphere is a natural process predating the Industrial Revolution.”

The merA resistance works by reducing the Hg(II) form of mercury to Hg(0). The latter represents an elemental form of mercury that can evaporate into the atmosphere and lead to detoxification of the bacteria’s immediate environment. Chemical reduction through exposure to sunlight does most of the mercury removal work in snow, but Kroer’s team of Danish and U.S. researchers previously estimated that the mercury-resistant bacteria help remove between 2 and 10 percent of the mercury in Arctic snow. Their recent work, detailed in the journal FEMS Microbiology Ecology, looked more closely at the diversity of merA genes among mercury-resistant bacteria in the Arctic.

Holes about 40 cm deep were drilled in the sea ice to collect brine water. Credit: Niels Kroer

The researchers may not have had to travel to Mars, but they still faced a tough journey to the sampling site at Station Nord, located about 575 miles south of the North Pole in Greenland. Kroer’s first attempt to fly to the site aboard a C-130 Hercules military aircraft of the Danish Air Force in early April failed when bad weather prevented it from landing. A second successful attempt in May coincided with good weather—sunshine 24 hours a day and a brisk temperature of -25 degrees Celsius—that allowed the researchers to gather samples from high Arctic snow, freshwater and sea-ice brine.

Genetic testing found seven different varieties of merA genes among the 71 mercury-resistant bacterial samples, including three new varieties of previously undiscovered merA genes. But the biggest surprise of the study came from finding merA genes among just 5 of the 18 bacteria samples that showed they could reduce Hg(II) to Hg(0). The finding suggests there are likely many more undiscovered merA genes in the Arctic beyond the three newly identified varieties.

The discovery of the same merA gene variants among many different taxonomic subgroups of bacteria indicates that many Arctic microbes gained their mercury resistance through horizontal transfer—the swapping of DNA molecules, called plasmids, which can self-replicate independently of the main chromosomes. Known merA varieties can be found around the world at locations as diverse as sugar beet leaves in the UK, to 120,000-year-old Siberian permafrost samples, and within a mercury mine in Central Asia.

The spread of merA genes among Arctic bacteria likely reflects a combination of such horizontal transfers, local selective pressure, and certain common DNA sequences that have been conserved across species despite millions of years of evolution, Kroer said. A whole-genome sequencing test of the bacterium Flavobacterium SOK62 also revealed the presence of an arsR regulator gene often associated with more ancient mercury-resistant lineages.

Kroer’s group also found a wide range of mercury resistance within different Arctic sub-environments. Less than 2 percent of the sample bacteria from an ice-covered freshwater lake and sea-ice brine demonstrated mercury resistance. By comparison, almost one-third of the snow bacteria samples were resistant to mercury.

The latest study is just a small step toward building a more comprehensive picture of the distribution of merA genes among Arctic microbes. Kroer anticipates more studies would need to be done at a variety of other locations, as well as more whole-genome sequencing tests that could help identify more mystery merA varieties among Arctic microbes. That knowledge could also help researchers better understand the processes leading to the buildup of mercury in life forms such as seals and polar bears.

In a broader sense, understanding the evolutionary lineage of genes that help organisms adapt to harsh environments has bigger-picture implications for understanding life’s survival in the broader universe. It’s no accident that Kroer’s recent research on Arctic microbes was partly funded by the NASA Exobiology and Evolutionary Biology Program.

“Various physiological adaptations, such as increased membrane fluidity, synthesis of cold- adapted enzymes and production of cold shock and antifreeze proteins enable bacteria to survive under cold conditions, and bacterial activity has been detected at sub-zero temperatures in sea ice and snow,” Kroer said. “The same mechanism may also be important for extraterrestrial life.”

More information: 
Møller, A. K., Barkay, T., Hansen, M. A., Norman, A., Hansen, L. H., Sørensen, S. J., Boyd, E. S. and Kroer, N. (2014), “Mercuric reductase genes (merA) and mercury resistance plasmids in High Arctic snow, freshwater and sea-ice brine.” FEMS Microbiology Ecology, 87: 52–63. doi: 10.1111/1574-6941.12189

Note : The above story is based on materials provided by Astrobio.net

Related Articles