back to top
27.8 C
New York
Saturday, November 16, 2024
Home Blog Page 262

Studying ancient landforms using new technology

Professor Tim Little and the four villagers who walked as guides and carriers the 88km from Agaun to Kewansesap

Professor Tim Little and Dr Kevin Norton from Victoria’s School of Geography, Environment and Earth Sciences are leading an international team in studying a unique active fault in the south-western Pacific nation.

The two scientists recently undertook a 10 day trip to the study area in the Owen Stanley Mountains of southeastern Papua New Guinea to conduct reconnaissance fieldwork before they return next year with a larger group of scientists and students to study the Maiu’iu Fault in greater detail.

Victoria’s Professor Diane Seward is also a principal investigator on the project—the rest of the group is comprised of PhD and Master’s students from Victoria, along with investigators from GNS Science, University of Liverpool, and two universities in the United States.

With financial assistance from the Royal Society’s Marsden Fund, the team hopes to get some insights into the mechanics of large faults in active continental rifts by measuring how rapidly a single large fault can move, to determine whether such slips can accumulate slowly and steadily without earthquakes, and to analyse how much friction the fault has.

What’s special about the fault, says Professor Little, is that it is moving extremely quickly and is inclined on a very low angle relative to the horizontal. “This implies the fault may be frictionally weak and slippery. The rapid slip leads to the uplift and exposure of a smooth fault surface, which can be studied in great detail in the field. More than a 25 kilometre width of the uplifted fault surface is currently visible in the landscape, rising from near sea level at the base of the scarp to an elevation of greater than 2800 metres near the crest of the mountains,” he says.

“The average rate of tectonic slip on this fault is very high, perhaps one centimetre a year, which is the fastest rate for a fault of its kind in the world. It’s being pulled up so rapidly that erosion isn’t able to keep pace, which means a smooth expanse of the fault surface is preserved in the landscape.

“There are examples of this kind of low-angle ‘normal’ fault in many ancient continental rift settings but only a handful of active examples are known to exist globally, so it’s kind of like a natural laboratory,” says Professor Little.

The analysis of the fault will draw on Dr Norton’s specialisation in cosmogenic dating, a technology which can accurately determine the ages of landforms. Victoria University is currently the only place in New Zealand that has a laboratory where this can be done.

“We can use cosmic radiation to determine how old a landform is,” he says. “When the radiation hits rock it turns some of the atoms into new different elements called cosmogenic nuclides. The longer a rock sits at the surface, the more these nuclides accumulate—we collect samples and measure them using accelerator mass spectrometry. We are lucky at Victoria to have a new state of the art cosmogenic nuclide laboratory.

“For the Papua New Guinea site we’re using cosmogenic nuclides taken from the fault to measure how fast it’s moving—the further up the exposed area of the fault we go, the older it is and the longer it’s been exposed to cosmic rays, so we can take samples from different points and work out the slip rate.”

Dr Norton says the location of the fault proved challenging at times—they had to walk for days across rugged terrain to access it. “We walked 88 kilometres through three different language zones in seven days,” says Dr Norton. “There were times when the path was a 10 centimetre-wide ledge and we were hanging on to roots trying not to fall off.

“I’ve never worked in this type of environment before—I’m usually in the European Alps where you can grab a coffee or an ice-cream in between taking samples,” he jokes.

The pair had to carefully negotiate with local people along the way to get permission to study the fault up close. “Traditional land rights are very powerful there, so we simply wouldn’t be able to work there if we didn’t get their approval,” says Dr Norton. “We made a lot of good contacts though—we talked with a lot of them and they’re extremely helpful and interesting.”

The research team plans to begin detailed investigation of the fault in Papua New Guinea by the middle of next year.

Note : The above story is based on materials provided by Victoria University

Scientific drilling project underway on Alpine Fault

This satellite image shows the aftermath of a severe blizzard that hit the South Island of New Zealand in July 2003. Higher regions are draped in snow, clearly delineating the escarpment northwest of the Southern Alps, formed by the 600 km (370 mi) long Alpine Fault. © NASA’s Earth Observatory

The ambitious project near Whataroa, north of Franz Josef Glacier, is expected to take about two months to complete. It will enable scientists to install monitoring equipment deep inside the fault to record small earthquakes and measure temperature, pressure and chemical conditions close to where earthquakes are generated.

The goal of the Deep Fault Drilling Project is to improve understanding of earthquake processes by sampling and analysing rock and fluid materials retrieved from what scientists sometimes refer to as ‘the earthquake machine’.

Other major faults around the world have been drilled in this way, but it has always been after a big earthquake. This is the first time a major fault has been drilled before it ruptures.

The team plans to intersect the fault at about 1km depth and drill a further 300m into the underlying Australian tectonic plate.

Up to 100 scientists and engineers will be working in shifts around the clock while drilling and sampling are underway.

The project is being jointly led by GNS Science, Victoria University of Wellington, and the University of Otago and involves scientists from other New Zealand organisations and from the United States, United Kingdom, Germany, Canada, France, Italy, Japan, Australia, China, and Taiwan.

It is funded by the International Continental Scientific Drilling Program (ICDP), the Marsden Fund of the Royal Society of New Zealand, the participating scientists own organisations, and a range of other sources.

“We really don’t know what we will find once we get deep into the fault zone. No-one has ever drilled this deep into a major New Zealand fault,” said project co-leader Rupert Sutherland of GNS Science.

“Similar projects overseas have shown that a huge amount of information can be extracted from samples retrieved from the heart of the fault zone,” Dr Sutherland said.

“For instance, we are fairly sure that presence of clay minerals and water pressure gradients are important factors affecting the fault’s mechanical behaviour, and we plan to collect several types of data that will help us look at this in detail.”

Another project co-leader, Virginia Toy of the University of Otago, said it was always a challenge to get fragile rock samples to the surface, but this project was doing everything possible to ensure good rates of sample retrieval from the borehole.

Project overview—4 min 40 seconds

“Rock and fluid samples from inside the fault will be shared among the science team with some analysed in New Zealand and the rest sent to more than a dozen overseas laboratories for analysis,” Dr Toy said.

“Our collaborations with cutting-edge international laboratories will allow maximum information to be extracted from these hard-won samples.”

The Alpine Fault, which is visible from space, extends for about 650km from south of Fiordland along the spine of the Southern Alps and into Marlborough.

It is among the more active plate boundary faults in the world and is one of the most scientifically appealing faults to study because of its size, fast rate of movement, and accessibility. In between major quakes it remains locked and produces small seismic tremor that can be picked up by sensitive instruments.

Earthquakes of about magnitude 8.0 occur on the fault about every 200 to 400 years, with the average gap between successive large earthquakes being about 330 years.

The fault last ruptured 297 years ago in 1717 and scientists estimate it has a 28 per cent probability of rupturing in the next 50 years, which is high by global standards.

Near Whataroa, it dips beneath the western ranges of the Southern Alps at about 45 degrees, which means it can be investigated with a vertical borehole without the need for expensive angle drilling.

In 2011, scientists drilled two boreholes into the fault to about 150m depth at Gaunt Creek, about 6km southwest of the current drilling site. That was the first substantial drilling investigation on the Alpine Fault.

One of the main findings of the 2011 project was the existence of a finely-ground impermeable layer of rock in the centre of the fault zone, holding back large amounts of fluid on the upper east side of the fault.

 Project Safety—1 min 50 seconds

This was a surprise as it had not been anticipated from the many surface studies of the fault dating back to the 1970s.

Scientists believe the large difference in fluid pressures on either side of the fault zone could play a role in initiating the first slipping movements as an earthquake begins.

Their hope is that the deep borehole will shed more light on the relationship between fluid pressure, the internal structure of the fault zone, and the mechanics of earthquakes.

Another co-leader of the project, John Townend of Victoria University of Wellington, said a key motivation for the project was to obtain new understanding of how large faults evolve and how earthquake rupture starts and travels along a fault.

“We hope this study and ongoing monitoring of conditions within the fault zone will ultimately lead to a better understanding of how faults slip and generate seismic waves during large earthquakes, and what specifically is likely to happen in a future Alpine Fault earthquake,” Dr Townend said.

“The Alpine Fault appears to save up all its energy for one big showdown every few hundred years. In between its big ruptures, it seems to stay locked and produce mostly minor earthquakes, but what controls this timing behaviour isn’t clear.”

It was possible to glean an enormous amount of information about a fault’s inner workings by scientific drilling, and by integrating the detailed measurements made at one location with other geological and geophysical results collected over a wider area.

The borehole is being drilled with low-impact techniques used routinely in environmentally sensitive groundwater and geotechnical applications.

Dr Townend added that new knowledge and understanding gained from this project would benefit earthquake science globally and enable New Zealand to better prepare for a future large earthquake on the Alpine Fault.

Note : The above story is based on materials provided by Victoria University

Making oxygen before life

UC Davis chemists have shown how ultraviolet light can split carbon dioxide to form oxygen in one step. Credit: Zhou Lu

About one fifth of Earth’s atmosphere is oxygen, pumped out by green plants as a result of photosynthesis and used by most living things on the planet to keep our metabolisms running. But before the first photosynthesizing organisms appeared about 2.4 billion years ago, the atmosphere likely contained mostly carbon dioxide, as is the case today on Mars and Venus.

Over the past 40 years, researchers have thought that there must have been a small amount of oxygen in the early atmosphere. Where did this abiotic (“non-life”) oxygen come from? Oxygen reacts quite aggressively with other compounds, so it would not persist for long without some continuous source.

Now UC Davis graduate student Zhou Lu, working with professors in the Departments of Chemistry and of Earth and Planetary Sciences, has shown that oxygen can be formed in one step by using a high energy vacuum ultraviolet laser to excite carbon dioxide. (The work is published Oct. 3 in the journal Science).

“Previously, people believed that the abiotic (no green plants involved) source of molecular oxygen is by CO2 + solar light –> CO + O, then O + O + M –> O2 + M (where M represents a third body carrying off the energy released in forming the oxygen bond),” Zhou said in an email. “Our results indicate that O2 can be formed by carbon dioxide dissociation in a one step process. The same process can be applied in other carbon dioxide dominated atmospheres such as Mars and Venus.”

Zhou used a vacuum ultraviolet laser to irradiate CO2 in the laboratory. Vacuum ultraviolet light is so-called because it has a wavelength below 200 nanometers and is typically absorbed by air. The experiments were performed by using a unique ion imaging apparatus developed at UC Davis.

Such one-step oxygen formation could be happening now as carbon dioxide increases in the region of the upper atmosphere, where high energy vacuum ultraviolet light from the Sun hits Earth or other planets. It is the first time that such a reaction has been shown in the laboratory. According to one of the scientists who reviewed the paper for Science, Zhou’s work means that models of the evolution of planetary atmospheres will now have to be adjusted to take this into account.

Coauthors on the paper are, in the UC Davis Department of Chemistry, postdoctoral researcher Yih Chung Chang, Distinguished Professor Cheuk-Yiu Ng and Distinguished Professor emeritus William M. Jackson; and Professor Qing-Zhu Yin, Department of Earth and Planetary Sciences. The work was principally funded by NASA, NSF, and the U.S. Department of Energy.

Note : The above story is based on materials provided by University of California – Davis. The original article was written by Andy Fell.

Violence of volcanoes is helping scientists monitor Earth’s sensitive side

A spectacular volcanic eruption seen from a distance in Holuhraun, Iceland. Photograph: Einar Gudmann / Barcroft Media/Einar Gudmann / Barcroft Media

The Earth seems to have been smoking a lot recently. Volcanoes are erupting in Iceland, Hawaii, Indonesia, Ecuador and Mexico, as well as the recent eruption of Japan’s Mount Ontake. Others, in the Philippines and Papua New Guinea, erupted recently but seem to have calmed down. Many of these have threatened homes and forced evacuations. Among their spectators, these eruptions raise question: is there such a thing as a season for volcanic eruptions?

While volcanoes may not have “seasons” as we know them, scientists have started to discern intriguing patterns in their activity.

Eruptions caused by a shortened day

The four seasons are caused by the Earth’s axis of rotation tilting toward and away from the sun. But our planet undergoes another, less well-known change, which affects it in a more subtle way, perhaps even volcanically.

Due to factors such as the gravitational pull of the sun and moon, the speed at which the Earth rotates constantly changes. Accordingly the length of a day actually varies from year to year. The difference is only in the order of milliseconds. But new research suggests that this seemingly small perturbation could bring about significant changes on our planet – or more accurately, within it.

A study published in the journal Terra Nova in February showed that, since the early 19th century, changes in the Earth’s rotation rate tended to be followed by increases in global volcanic activity. It found that, between 1830 and 2013, the longest period for which a reliable record was available, relatively large changes in rotation rate were immediately followed by an increase in the number of large volcanic eruptions. And, more than merely being correlated, the authors believe that the rotation changes might actually have triggered these large eruptions.

Altering the spin of a planet, even by a small amount, requires a huge amount of energy. It has been estimated that changes in the Earth’s rotation rate dissipate around 120,000 petajoules of energy each year – enough to power the United States for the same length of time.

This energy is transferred into the Earth’s atmosphere and subsurface. And it is this second consequence that the Terra Nova authors believe could affect volcanoes.

The vast quantities of energy delivered to the subsurface by rotation changes are likely to perturb its stress field. And, since the magma that feeds volcanic eruptions resides in the Earth’s crust, stress variations there may make it easier for the liquid rock to rise to the surface, and thereby increase the rate of volcanic eruptions.

The Terra Nova study is far from conclusive. Nevertheless, the idea that minute changes to the Earth’s spin could affect volcanic motions deep within the planet is intriguing.

But there’s another natural phenomenon that has a much stronger claim to affecting volcanic activity: climate change.

Eruptions caused by climate change

In recent decades, it has become apparent that the consequences of planetary ice loss may not end with rising sea levels. Evidence has been building that in the past, periods of severe loss of glaciers were followed by a spike in volcanic activity.

Around 19,000 years ago, glaciation was at a peak. Much of Europe and North America was under ice. Then the climate warmed, and the glaciers began to recede. The effect on the planet was generally quite favourable for humankind. But, since the mid-1970s, a number of studies have suggested that, as the ice vanished, volcanic eruptions became much more frequent. A 2009 study, for example, concluded that between 12,000 and 7,000 years ago, the global level of volcanic activity rose by up to six times. Around the same period the rate of volcanic activity in Iceland soared to at least 30 times today’s level.

There is supporting evidence from continental Europe, North America and Antarctica that volcanic activity also increased after earlier deglaciation cycles. Bizarrely, then, volcanic activity seems – at least sometimes – to rise and fall with ice levels. But why? This strange effect might come down to stress.

Eruptions caused by the melting of ice

Ice sheets are heavy. Each year, Antarctica’s loses around 40bn metric tons of ice. The sheets are so heavy, in fact, that as they grow, they cause the Earth’s crust to bend – like a plank of wood when placed under weight. The corollary of this is that, when an ice sheet melts, and its mass is removed, the crust springs back. This upward flexing can lead to a drop in stress in the underlying rocks, which, the theory goes, makes it easier for magma to reach the surface and feed volcanic eruptions.

The link between climate change and volcanism is still poorly understood. Many volcanoes do not seem to have been affected by it. Nor is it a particularly pressing concern today, even though we face an ice-free future. It can take thousands of years after the glaciers melt for volcanic activity to rise.

Yet while it may not be an immediate hazard, this effect shows how our planet can respond to change in unforeseen ways. Contrary to their brutish reputation, volcanoes help scientists understand just how sensitive our planet can be.

This article appeared in Guardian Weekly, which incorporates material from the Washington Post

Note : The above story is based on materials provided by Robin Wylie for the Washington Post

New method for detecting water on Mars

Washington State University senior Kellie Wall has helped develop a new method for detecting water on Mars. Her findings appear in Nature Communications, one of the most influential general science journals Credit: Washington State University photo

A Washington State University undergraduate has helped develop a new method for detecting water on Mars.
Kellie Wall, 21, of Port Orchard, Wash., looked for evidence that water influenced crystal formation in basalt, the dark volcanic rock that covers most of eastern Washington and Oregon. She then compared this with volcanic rock observations made by the rover Curiosity on Mars’ Gale Crater.

“This is really cool because it could potentially be useful for not only the study of rocks on Earth but on Mars and other planets,” said Wall.

She is the lead author of the article in Nature Communications.

Co-authors include Michael Rowe, a former WSU research professor now at New Zealand’s University of Auckland, and Ben Ellis, a former WSU post-doctoral researcher now at the Institute of Geochemistry and Petrology in Zurich, Switzerland. The other authors are Mariek Schmidt of Brock University in Canada and Jennifer Eccles of the University of Auckland.

Wall was fascinated by volcanoes as a child, touring the Cascade mountain range with her father and marveling at features like the lava tubes under Mount St. Helens.

“I was really excited because I thought that just on the other side of the walls there could be lava,” she said.

Still, she started out as a communications major at WSU, choosing a geology class to fulfill a science requirement.

“I loved it so much that I changed my major,” she said.

In her sophomore year, Rowe and Ellis asked if she would like to look at the eruption styles of Earth and Mars volcanoes.

“I was really crazy about it — really intrigued by the buzzword ‘Mars,'” she said.

“I’ve worked with a lot of undergraduate researchers over the years and she’s the best that I’ve come across,” said Rowe. “That’s why we gave her so much responsibility on this project, because we knew she would do it well.”

The researchers established a method to quantify the texture of volcanic rock using an index called “groundmass crystallinity.” Wall compares it to the texture of a chocolate chip cookie, which can vary according to how it is cooked and cooled.

“We were interested in the cookie dough part of the cookie,” she said.

Liquid volcanic rock cools rapidly as it hits water, flash-freezing to form mostly glass. Without water, it takes longer to cool and forms crystals within the groundmass, the cookie dough part.

Using an x-ray diffraction machine on the WSU campus, home to one of the most sophisticated basalt labs in the world, Wall analyzed rock samples from the Northwest, New Zealand and Italy’s Mount Etna and compared them to rocks analyzed by Curiosity’s x-ray diffractometer.

“The rocks that erupted and interacted with water, which we call phreatomagmatic, all had a groundmass crystallinity as low as 8 percent and ranging up to about 35 percent,” she said. “The rocks that erupted without interaction with water had groundmass crystallinities from about 45 percent upwards to almost totally crystalline.

“The analyses we did on the Mars soil samples fell in the range of the magmatic type eruptions, which are the ones erupted without water interaction,” she said.

Water is a key indicator for the potential of microbial life on the red planet. While Wall and her colleagues didn’t see evidence of it from two sites they studied, their method could look for water elsewhere.

“I think this quantification of volcanic textures is a new facet of the water story that hasn’t yet been explored,” Wall said. “Most of the studies searching for water have focused on either looking for sedimentary structures — large- and small-scale — for evidence of water, or looking for rocks like limestones that actually would have formed in a water-rich environment.

“But being able to determine the environment through the texture of a volcanic rock is something pretty cool and different,” she said. “I think it’s an interesting avenue for future research.”

Video:

Note : The above story is based on materials provided by Washington State University. The original article was written by Eric Sorensen.

52-million-year-old amber preserves ‘ant-loving’ beetle

Scientists have uncovered the fossil of a 52-million-year old beetle that likely was able to live alongside ants—preying on their eggs and usurping resources—within the comfort of their nest. Credit: © AMNH/J. Parker

Scientists have uncovered the fossil of a 52-million-year old beetle that likely was able to live alongside ants — preying on their eggs and usurping resources — within the comfort of their nest. The fossil, encased in a piece of amber from India, is the oldest-known example of this kind of social parasitism, known as “myrmecophily.” Published today in the journal Current Biology, the research also shows that the diversification of these stealth beetles, which infiltrate ant nests around the world today, correlates with the ecological rise of modern ants.

“Although ants are an integral part of most terrestrial ecosystems today, at the time that this beetle was walking the Earth, ants were just beginning to take off, and these beetles were right there inside the ant colonies, deceiving them and exploiting them,” said lead author Joseph Parker, a research associate at the American Museum of Natural History and postdoctoral researcher at Columbia University, who is a specialist on these beetles. “This tells us something not just about the beetles, but also about the ants — their nests were big enough and resource-rich enough to be worthy of exploitation by these super-specialized insects. And when ants exploded ecologically and began to dominate, these beetles exploded with them.”

Today, there are about 370 described species belonging to Clavigeritae, a group of myrmecophilous, or “ant-loving” beetles about 1-3 millimeters in length, and Parker estimates that several times this number of species still await discovery. Remarkable adaptations enable these beetles to bypass the fortresslike security of ant nests, which employ a pheromone code of recognition that ants use to identify, and then dismember and consume, intruders. Through ways that scientists are still trying to understand, Clavigeritae beetles pass through these defenses and integrate seamlessly into colony life.

“Adopting this lifestyle brings lots of benefits. These beetles live in a climate- controlled nest that is well protected against predators, and they have access to a great deal of food, including the ants’ eggs and brood, and, most remarkably, liquid food regurgitated directly to their mouths by the worker ants themselves,” Parker said. “But pulling off this way of life means undergoing drastic morphological changes.”

Clavigeritae beetles look quite different from their closest relatives, with fusions of segments within the abdomen and antennae — likely meant to provide additional protection from the ants, which often pick the beetles up and carry them around the nest — and mouthparts that are recessed inside the head in order to accept liquid food from worker ants. They also have glands that cover the body with oily secretions, and thick brushes of hair on top of their abdomens, called trichomes, which act as candlewicks and conduct chemical-containing secretions from nearby glands. The makeup of these chemicals is unknown, but they are thought to encourage ants to “adopt” rather than attack the beetles.

“If you watch one of these beetles interact inside an ant colony, you’ll see the ants running up to it and licking those brush-like structures,” Parker said.

Although Clavigeritae beetles are species-rich, they are quite rarely encountered in nature and so, unsurprisingly, the newly discovered specimen — brought to Parker’s attention by American Museum of Natural History curator David Grimaldi, who is an expert in amber fossils — is thought to be the first fossil of this group to be discovered. Named Protoclaviger trichodens by Parker and Grimaldi, the Eocene fossil is from an amber deposit in what was once a rain-forest environment in modern-day India. Although its body is very similar to modern Clavigeritae beetles, with two stark, hook-like trichomes, some of its characteristics are clearly more primitive. For example, Protoclaviger’s abdominal segments are still distinct, whereas in modern beetles they are fused together into a single shieldlike segment.

“Protoclaviger is a truly transitional fossil,” Parker said. “It marks a big step along the pathway that led to the highly modified social parasites we see today, and it helps us figure out the sequence of events that led to this sophisticated morphology.”

Note : The above story is based on materials provided by American Museum of Natural History.

Previously unseen details of seafloor exposed in new map

A new seafloor map reveals new details on earthquakes (red dots), seafloor spreading ridges, and faults. Credit: Image courtesy of University of California – San Diego

Accessing two previously untapped streams of satellite data, scientists at Scripps Institution of Oceanography at UC San Diego and their colleagues have created a new map of the world’s seafloor, creating a much more vivid picture of the structures that make up the deepest, least-explored parts of the ocean. Thousands of previously uncharted mountains rising from the seafloor and new clues about the formation of the continents have emerged through the new map, which is twice as accurate as the previous version produced nearly 20 years ago.

Developed using a scientific model that captures gravity measurements of the ocean seafloor, the new map extracts data from the European Space Agency’s (ESA) CryoSat-2 satellite, which primarily captures polar ice data but also operates continuously over the oceans, and Jason-1, NASA’s satellite that was redirected to map the gravity field during the last year of its 12-year mission.

Combined with existing data and drastically improved remote sensing instruments, the new map, described in the journal Science, has revealed details of thousands of undersea mountains, or seamounts, extending a kilometer or more from the ocean bottom. The new map also gives geophysicists new tools to investigate ocean spreading centers and little-studied remote ocean basins.

“The kinds of things you can see very clearly now are abyssal hills, which are the most common land form on the planet,” said David Sandwell, lead scientist of the paper and a geophysics professor in the Cecil H. and Ida M. Green Institute of Geophysics and Planetary Physics (IGPP) at Scripps.

The authors of the study say the map provides a new window into the tectonics of the deep oceans. Previously unseen features in the map include newly exposed continental connections across South America and Africa, and new evidence for seafloor spreading ridges at the Gulf of Mexico that were active 150 million years ago and are now buried by mile-thick layers of sediment.

“One of the most important uses of this new marine gravity field will be to improve the estimates of seafloor depth in the 80 percent of the oceans that remains uncharted or is buried beneath thick sediment,” the authors say in the report.

“Although CryoSat-2’s primary mission is in the cryosphere, we knew as soon as we selected its orbit that it would be invaluable for marine geodesy, and this work proves the point,” said Richard Francis, a coauthor of the paper and project manager for the development of CryoSat-2 at the European Space Agency, and honorary professor in the Department of Earth Sciences at University College London.

The new map also provides the foundation for the upcoming new version of Google’s ocean maps to fill large voids between shipboard depth profiles.

“The team has developed and proved a powerful new tool for high-resolution exploration of regional seafloor structure and geophysical processes,” says Don Rice, program director in the National Science Foundation’s (NSF) Division of Ocean Sciences. “This capability will allow us to revisit unsolved questions and to pinpoint where to focus future exploratory work.”

“The use of satellite altimeter data and Sandwell’s improved data processing technique provides improved estimates of marine gravity and bathymetry world-wide, including in remote areas,” said Joan Cleveland, Office of Naval Research (ONR) deputy director, Ocean Sensing and Systems Division. “Accurate bathymetry and identifying the location of seamounts are important to safe navigation for the U.S. Navy.”

The map can be accessed at: http://topex.ucsd.edu/grav_outreach/

Video :

Note : The above story is based on materials provided by University of California – San Diego.

Underwater landslide doubled size of 2011 Japanese tsunami

An ocean engineer at the University of Rhode Island has found that a massive underwater landslide, combined with the 9.0 earthquake, was responsible for triggering the deadly tsunami that struck Japan in March 2011.

Professor Stephan Grilli, an international leader in the study of tsunamis, said the generally accepted explanation for the cause of the tsunami had been the earthquake, the fifth largest ever measured, which created a significant uplift and subsidence of the seafloor. While that adequately explains the 10-meter surge that affected much of the impacted area, Grilli said it cannot account for the 40-meter waves that struck a 100-kilometer area of Japan’s mountainous Sanriku Coast.

“Computer models have not been able to explain the large inundation and run-up on the Sanriku Coast using the earthquake alone,” Grilli said. “Our model could only get inundation up to 16 or 18 meters, not 40. So we knew there must be another cause.”

His findings were published this week in the journal Marine Geology.

In a series of models, Grilli and his former doctoral student Jeff Harris worked backwards in time to recreate the movement of the seafloor from the earthquake and concluded that an additional movement underwater about 100 kilometers north of the earthquake’s epicenter must have occurred to propagate the large waves that struck Sanriku. So the URI engineers and colleagues at the British Geological Survey and the University of Tokyo went looking for evidence that something else happened there.

Reviewing surveys of the seafloor conducted by Japanese scientists before and after the earthquake, the scientists found signs of a large slump on the seafloor — a rotational landslide 40 kilometers by 20 kilometers in extent and 2 kilometers thick that traveled down the slope of the Japan Trench, leaving a horizontal footprint the size of Paris that could only have been created by a 100-meter uplift in the seafloor. The earthquake only raised the seafloor 10 meters.

“Underwater landslides tend to create shorter period tsunami waves, and they tend to concentrate their energy in a small stretch of coastline,” said Grilli. “The train of waves from the landslide, combined with the earthquake generated waves, together created the 40 meter inundation along the Sanriku Coast.”

Grilli said it has been difficult to convince his Japanese colleagues of his research group’s results. Most assumed that the massive size of the earthquake was enough to create the waves that were observed.

“It raises questions about how we’ve been doing tsunami predictions in the past,” he said. “We generally have just considered the largest possible earthquake, but we seldom consider underwater landslides as an additional source,” even though large tsunamis in 1998 in Papua New Guinea and in 1946 in the Aleutian Islands were found to be generated by a combination of earthquakes and underwater landslides.

Grilli also said that his analysis is under considerable scrutiny because it brings into question whether Japan had adequately prepared for natural disasters prior to the 2011 event.

“There is a lot at stake in Japan,” he said. “Tsunami scientists working for government agencies use tsunami return periods that are much too low in their calculations, leading them to underestimate the tsunami risk. All of the safety procedures they have in place, including at nuclear power plants, are still based on underestimating the maximum earthquake likely to strike Japan, and they underestimate the maximum tsunami, too. Japan is working toward revising their approach to tsunami hazard assessment, but this will take time.”

Video

Note : The above story is based on materials provided by University of Rhode Island.

Changing Antarctic waters could trigger steep rise in sea levels

Current changes in the ocean around Antarctica are disturbingly close to conditions 14,000 years ago that new research shows may have led to the rapid melting of Antarctic ice and an abrupt 3-4 metre rise in global sea level.

The research published in Nature Communications found that in the past, when ocean temperatures around Antarctica became more layered — with a warm layer of water below a cold surface layer — ice sheets and glaciers melted much faster than when the cool and warm layers mixed more easily.

This defined layering of temperatures is exactly what is happening now around the Antarctic.

“The reason for the layering is that global warming in parts of Antarctica is causing land-based ice to melt, adding massive amounts of freshwater to the ocean surface,” said ARC Centre of Excellence for Climate System Science researcher Prof Matthew England an author of the paper.

“At the same time as the surface is cooling, the deeper ocean is warming, which has already accelerated the decline of glaciers on Pine Island and Totten. It appears global warming is replicating conditions that, in the past, triggered significant shifts in the stability of the Antarctic ice sheet.”

The modelling shows the last time this occurred, 14,000 years ago, the Antarctic alone contributed 3-4 metres to global sea levels in just a few centuries.

“Our model simulations provide a new mechanism that reconciles geological evidence of past global sea level rise,” said researcher UNSW ARC Future Fellow Dr Chris Fogwill.

“The results demonstrate that while Antarctic ice sheets are remote, they may play a far bigger role in driving past and importantly future sea level rise than we previously suspected.”

The accelerating melting of land ice into the sea makes the surface of the ocean around Antarctica colder, less salty and more easily frozen, leading to extensive sea ice in some areas. It is one of the reasons ascribed to the increasing trend in sea ice around Antarctica.

To get their results the researchers used sophisticated ice sheet and climate models and verified their results with independent geological observations from the oceans off Antarctica. The geological data clearly showed that when the waters around the Antarctic became more stratified, the ice sheets melted much more quickly.

“The big question is whether the ice sheet will react to these changing ocean conditions as rapidly as it did 14,000 years ago,” said lead author Dr Nick Golledge, a senior research fellow at Victoria’s Antarctic Research Centre.

“With 10 per cent of the world’s population, or 700 million people, living less than 10 metres above present sea level, an additional three metres of sea level rise from the Antarctic alone will have a profound impact on us all.”

Note : The above story is based on materials provided by University of New South Wales.

Solving the mystery of the ‘Man in the Moon’

The moon as observed in visible light (left), topography (center, where red is high and blue is low), and the GRAIL gravity gradients (right). The Procellarum region is a broad region of low topography covered in dark mare basalt. The gravity gradients reveal a giant rectangular pattern of structures surrounding the region. Credit: NASA/Colorado School of Mines/MIT/JPL/Goddard Space Flight Center

New data obtained by NASA’s GRAIL mission reveals that the Procellarum region on the near side of the moon — a giant basin often referred to as the “man in the moon” — likely arose not from a massive asteroid strike, but from a large plume of magma deep within the moon’s interior.

The Procellarum region is a roughly circular, volcanic terrain some 1,800 miles in diameter — nearly as wide as the United States. One hypothesis suggested that it was formed by a massive impact, in which case it would have been the largest impact basin on the moon. Subsequent asteroid collisions overprinted the region with smaller — although still large — basins.

Now researchers from MIT, the Colorado School of Mines, and other institutions have created a high-resolution map of the Procellarum, and found that its border is not circular, but polygonal, composed of sharp angles that could not have been created by a massive asteroid. Instead, researchers believe that the angular outline was produced by giant tension cracks in the moon’s crust as it cooled around an upwelling plume of hot material from the deep interior.

Maria Zuber, the E.A. Griswold Professor of Geophysics and also MIT’s vice president for research, says that as cracks occurred, they formed a “plumbing system” in the moon’s crust through which magma could meander to the surface. Magma eventually filled the region’s smaller basins, creating what we see today as dark spots on the near side of the moon — features that have inspired the popular notion of a “man in the moon.”

“A lot of things in science are really complicated, but I’ve always loved to answer simple questions,” says Zuber, who is principal investigator for the GRAIL (Gravity Recovery and Interior Laboratory) mission. “How many people have looked up at the moon and wondered what produced the pattern we see — let me tell you, I’ve wanted to solve that one!”

Zuber and her colleagues publish their results this week in the journal Nature.

Making Less of an Impact

The team mapped the Procellarum region using data obtained by GRAIL — twin probes that orbited the moon from January to December 2012. Researchers measured the distance between the probes as they chased each other around the moon. As the leading probe passed over a region of lower density, it briefly slowed, caught by that region’s gravitational pull. As the probes circled the moon, they moved in accordion fashion, the distance between them stretching and contracting in response to varying gravitational attraction due to the mass variations in the lunar interior.

From the variable distance between the probes, Zuber and her team determined the strength of gravity across the moon’s surface, creating a highly detailed map, which they then used to determine where the lunar crust thickens and thins.

From this mapping, the researchers observed that the rim of the Procellarum region is composed of edges that abut at 120-degree angles. As asteroid impacts tend to produce circular or elliptical craters, Zuber says the Procellarum’s angular shape could not have been caused by an impact.

Instead, the team explored an alternative scenario: Some time after the moon formed and cooled, a large plume of molten material rose from the lunar interior, around where the Procellarum region is today. The steep difference in temperature between the magma plume and the surrounding crust caused the surface to contract over time, creating a pattern of fractures that provided a conduit for molten material to rise to the surface.

To test the hypothesis, the researchers modeled the region’s gravitational signal if it were to contain volcanic intrusions — magma that seeped up to just beneath the moon’s surface and, over time, cooled and crystallized. The resulting simulation matched the gravity signal recorded by GRAIL, supporting the idea that the Procellarum was caused by a magma plume, and not an asteroid.

“How such a plume arose remains a mystery,” Zuber says. “It could be due to radioactive decay of heat-producing elements in the deep interior. Or, conceivably, a very early large impact triggered the plume. But in the latter case, all evidence for such an impact has been completely erased. People who thought that all this volcanism was related to a gigantic impact need to go back and think some more about that.”

Note : The above story is based on materials provided by Massachusetts Institute of Technology. The original article was written by Jennifer Chu.

Detroit River

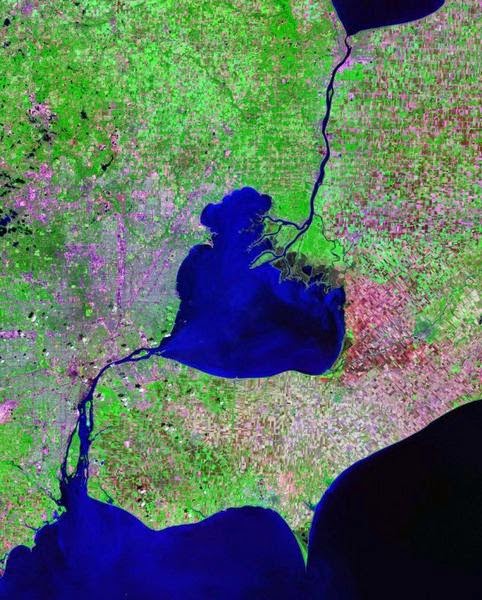
Landsat satellite photo showing the St. Clair River (top), Lake St. Clair (center), and the Detroit River connecting it to Lake Erie (bottom)

The Detroit River is a 24-nautical-mile-long (44 km; 28 mi) river in the Great Lakes system. The name comes from the French Rivière du Détroit, which translates literally as River of the Strait. The Detroit River has served an important role in the history of Detroit and is one of the busiest waterways in the world. The river travels west and south from Lake St. Clair to Lake Erie, and the whole river carries the international border between Canada and the United States. The river divides the major metropolitan areas of Detroit, Michigan and Windsor, Ontario — an area referred to as Detroit–Windsor. The two are connected by the Ambassador Bridge and the Detroit–Windsor Tunnel.

The river serves as an important transportation route connecting Lake Michigan, Huron, and Superior to the St. Lawrence Seaway and Erie Canal. When Detroit underwent rapid industrialization at the turn of the 20th century, the Detroit River became notoriously polluted and toxic. In recent years, however, the ecological importance of the river has warranted a vast restoration effort, and the river today has a wide variety of economical and recreational uses. There are numerous islands in the Detroit River, and much of the lower portion of the river is incorporated into the Detroit River International Wildlife Refuge. The portion of the river in the city of Detroit has been organized into the Detroit International Riverfront and the William G. Milliken State Park and Harbor. The Detroit River is designated an American Heritage River and a Canadian Heritage River — the only river to have this dual designation.

Table of Contents

Geography

The Detroit River flows for 24 nautical miles (44 km; 28 mi) from Lake St. Clair to Lake Erie. By definition, this classifies it as both a river and a strait — a strait being a narrow passageway connecting two large bodies of water. That is why the river was originally called the River of the Strait by early French settlers. However, today, the Detroit River is rarely referred to as a strait, because bodies of water referred to as straits are typically much wider. The Detroit River is only 0.5 to 2.5 miles (0.80 to 4.02 km) wide. The Detroit River starts on an east to west flow but then bends and runs north to south. The deepest portion of the Detroit River is 53 feet (16 m) deep in the northern portion of the river. At its source, the river is at an elevation of 574 feet (175 m) above sea level. The river drops only three feet before entering into Lake Erie at 571 feet (174 m). As the river contains no dams and no locks, it is easily navigable by even the smallest of vessels. The watershed basin for the Detroit River is approximately 700 square miles (1,800 km2). Since the river is fairly short, it has few tributaries. Its largest tributary is the River Rouge in Michigan, which is actually four times longer than the Detroit River and contains most of the basin. The only other major American tributary to the Detroit River is the much smaller Ecorse River. Tributaries on the Canadian side include Little Creek and the River Canard. The discharge for the Detroit River is relatively high for a river of its size. The river’s average discharge is approximately 188,000 cubic feet per second (5,324 m³/s), and the river’s flow is constant.

The Detroit River forms a major element of the international border between the United States and Canada. The river on the American side is all under the jurisdiction of Wayne County, Michigan, and the Canadian side is under the administration of Essex County, Ontario. The largest city along the Detroit River is Detroit, and most of the population along the river lives in Michigan. The Detroit River has only two automobile traffic crossings connecting the United States and Canada: the Ambassador Bridge and the Detroit–Windsor Tunnel. Both of these are heavily protected by the U.S. Customs and Border Protection and the Canada Border Services Agency.

The upper portion of the river is one of the few places where a Canadian city lies directly south of an American city. In this case, the city of Detroit is directly north of the city of Windsor, Ontario. The only other location where this occurs is Fort Erie, Ontario, lying south of several cities in Niagara County, New York. The cities and communities southwest of Detroit along the American side of the river are popularly referred to as the Downriver area, because those areas are said to be “down the river” from Detroit. Several of these communities do not actually border the Detroit River; the term “Downriver” is used to refer to a cluster of 18 suburban communities that lie to the southwest of the city of Detroit and to the west of the Detroit River.

Islands

The Detroit River contains numerous islands. Ownership and control of the islands varies by their geographic location along the river. The majority of islands are on the American side of the river. There are no islands in the Detroit River that are divided by the international border. Many of the islands are very small and uninhabited. Most of the islands in the Detroit River are in the southern portion of the waterway near Grosse Ile and close to where the river empties into Lake Erie. Belle Isle, in the northern section of the river, is entirely used as a Detroit city park, and is open to the public via a bridge connection with the city.

Note : The above story is based on materials provided by Wikipedia

How dinosaur arms turned into bird wings

(A) Whole-mount alcian blue staining confirms the ulnare is the first carpal formed in avian embryos, distal to the ulna. Thereafter, a distal carpal 3 (referred to as “element x” in previous embryological descriptions) is formed distal to the ulnare, coexisting with it. Finally, the ulnare disappears, whereas dc3 persists. Credit: J. Botelho et al.; DOI: 10.1371/journal.pbio.1001957

Although we now appreciate that birds evolved from a branch of the dinosaur family tree, a crucial adaptation for flight has continued to puzzle evolutionary biologists. During the millions of years that elapsed, wrists went from straight to bent and hyperflexible, allowing birds to fold their wings neatly against their bodies when not flying.

How this happened has been the subject of much debate, with substantial disagreement between developmental biologists, who study how the wings of modern birds develop in the growing embryo, and palaeontologists who study the bones of dinosaurs and early birds. A resolution to this impasse is now provided by an exciting new study publishing on September 30 in PLOS Biology.

Underlying this striking evolutionary transformation change is a halving in the number of wrist bones, but developmental biologists and palaeontologists have different names for most of them, and seldom agree on the correspondence between specific dinosaur bones and those of their bird descendants. Indeed, each field has radically different data sources, methods, and research objectives, talking little to each other.

The critical advance made in the new study involved combining these two strands of research. Using an interdisciplinary approach, the lab run by Alexander Vargas at the University of Chile has re-examined fossils stored at several museum collections, while at the same time collecting new developmental data from seven different species of modern birds. Joao Botelho, a Brazilian student in Vargas’ lab, developed a revolutionary new technique that allows him to study specific proteins in 3D embryonic skeletons. By combining these data from both fossils and embryos, the research team has made a major step forward in clarifying how the bird wrist evolved.

From early dinosaur ancestors with as many as nine wrist bones, birds have only kept four during the course of evolution, but which of the original bones are they? The identity of each of these bones was debated. For instance, the late Yale professor John Ostrom famously pointed out in the 1970’s that the wrists of both birds and bird-like dinosaurs possess a very similar, half-moon shaped bone called the semilunate, and that this bone resulted from the merging of two bones present in dinosaurs. This formed part of Ostrom’s then-controversial argument that birds descended from dinosaurs. However, the failure of developmental biologists to confirm this raised doubts that it was the same bone, and even that birds came from dinosaurs.

Now, the new data obtained by the Vargas lab has revealed the first developmental evidence that the bird semilunate was formed by the fusion of the two dinosaur bones. They go on to show that another bone — the pisiform — was lost in bird-like dinosaurs, but then re-acquired in the early evolution of birds, probably as an adaptation for flight, where it allows transmission of force on the downstroke while restricting flexibility on the upstroke. Combined, the fossil and developmental data provide a compelling scenario for a rare case of evolutionary reversal.

The study by the Vargas lab also settled the identity of the other two bones of the bird wrist, which were commonly misidentified in both fields. This emphasizes the downsides of not integrating all data sources, and reveals a situation perhaps akin to that of astronomy and experimental physics in the pursuit of cosmology: Together, palaeontology and development can come much closer to telling the whole story of evolution — this integrative approach resolves previous disparities that have challenged the support for the dinosaur-bird link and reveals previously undetected processes, including loss of bones, fusion of bones, and re-evolution of a transiently lost bone.

Reference:
João Francisco Botelho, Luis Ossa-Fuentes, Sergio Soto-Acuña, Daniel Smith-Paredes, Daniel Nuñez-León, Miguel Salinas-Saavedra, Macarena Ruiz-Flores, Alexander O. Vargas. New Developmental Evidence Clarifies the Evolution of Wrist Bones in the Dinosaur–Bird Transition. PLoS Biology, 2014; 12 (9): e1001957 DOI: 10.1371/journal.pbio.1001957

Note : The above story is based on materials provided by PLOS.

Volcano expert comments on Japan eruption

Loÿc Vanderkluysen, PhD, who recently joined Drexel as an assistant professor in Department of Biodiversity, Earth and Environmental Science in the College of Arts and Sciences, returned Friday from fieldwork in Indonesia monitoring the active Sinabung volcano – just in time to learn of the tragic events unfolding in Japan with the sudden eruption of Mt. Ontake.

Vanderkluysen can provide insight into the science of volcanos and what challenges remain during the ongoing rescue effort in Japan. Below are his responses to some common questions.

Why did this happen? Did the agency in charge of volcano monitoring in Japan make a massive blunder?

It doesn’t appear that way. Japan has one of densest volcano monitoring systems in the world, and a very sophisticated warning system. The reality is that the eruption simply didn’t have precursors.

Don’t all eruptions have precursors?

No, not necessarily. Modern volcano monitoring tools are designed to detect the presence and motion of magma (which is hot, molten rock) inside volcanoes. However, on occasion, volcanoes can have eruptions where no magma is involved. Many volcanoes have active hydrothermal systems, which is simply heated groundwater. A number of factors can lead to hydrothermal reservoir pressures increasing, to the point where they can explode. This is termed a “phreatic” eruption.

In the coming days, I expect volcanologists to look at samples from the eruption of Ontake-san, to look for any sign that fresh magma was involved. I suspect that they won’t find any. The absence of precursors and the apparent steam-heavy plume produced by the eruption seem to indicate that Mt. Ontake experienced a phreatic eruption.

Are phreatic eruptions common?

They are rather common, and the absence of obvious precursors represent a major challenge for the volcanological community. This is especially true given that many dormant volcanoes are popular touristic spots… and can also host active hydrothermal systems. In New Zealand in 2007, a skier, who was staying overnight in a lodge at the summit Mt Ruapehu, got his leg crushed by a block ejected during a phreatic eruption. Such eruptions without precursors have come to be known as “blue sky” eruptions there, and have occurred five times in the last 45 years at that volcano. Last year, five hikers got killed by a phreatic eruption on Mayon volcano in the Philippines.

Are all phreatic eruptions this big?

In the world of phreatic eruptions, it appears that Saturday’s in Japan was a relatively large one. However, phreatic eruptions tend to be very small compared to their regular volcanic equivalents.

What are the main hazards associated with phreatic eruptions?

There are two, principally: large blocks falling out of the sky, and inhalation of ash. During phreatic explosions, large blocks (that can be the size of a piano or a small car) are ejected in the air and can travel typically no more than a mile or two from the eruption source. Volcanologists working on active volcanoes have taken the habit of wearing a helmet, and tourists hiking on dormant volcanoes should do the same. Volcanic ash is composed of very small particles of volcanic rocks (smaller than 2mm, and commonly around 100 microns – that’s 1/500th of an inch). Inhaling large amounts of volcanic ash can lead to suffocation, which seems to have been a major component in the disaster at Ontake volcano. Wearing a dust mask helps or, in the absence of one, covering the nose and mouth with a wet piece of clothing.

People should be reminded that volcanic ash can be very heavy, and impose a heavy load on structures when accumulating on the roof. Seeking shelter should be a temporary solution, as it is known that roof collapse has traditionally been a major source of fatalities during volcanic eruptions.

What issues will first responders encounter during relief efforts?

The first issue will be the accumulation of ash. Approaching the area by helicopter will be complicated, as the freshly deposited ash can be remobilized, and choke and damage engines. Approaching on foot will also be made difficult by the presence of ash.

The second issue will be the steam plume. Even though the eruption appears to be over, a steam plume continues to cloud the volcano summit. It’s likely that a number of toxic gases are currently being emitted at dangerous levels, particularly the poisonous hydrogen sulfide (the “rotten egg” smell), and possibly sulfur dioxide (which is an irritant). It’s been reported that rescue efforts had to be put on hold for a time on Sunday, both because of the ash and the presence of a (unspecified) “toxic gas”.

That said, the situation remains volatile and it can’t be ruled out that more phreatic eruptions will occur in the next few days. This could affect further rescue efforts, as well as the safety of rescue workers.

About Loÿc Vanderkluysen’s research: During his Sept. 2014 fieldwork with colleagues Brett Carr from Arizona State University and Bima Eko Dhanu of Gadjah Mada University, Vanderkluysen monitored the ongoing eruption at Sinabung volcano, in northern Sumatra. After ten centuries of quiescence, Sinabung volcano started erupting in December 2013, spewing a thick, viscous lava flow on its southern flank, which has now reached 2.8 km (1.7 mi) in length. Ten months into the eruption, the lava flow’s advance has slowed down considerably, giving local populations a false sense of security. The flow’s steep flanks remain highly unstable, and pyroclastic flows triggered by rock collapse are common. Pyroclastic flows are one of the most devastating volcanic hazards: they consist of a fast-moving cloud of hot volcanic ash, capable of transporting large boulders at its base. Fatal pyroclastic flows occurred at Sinabung in February 2014.

Note : The above story is based on materials provided by Drexel University

Eastern basin of the South Aral Sea completely dry for the first time in modern history

Acquired August 19, 2014

Summer 2014 marked another milestone for the Aral Sea, the once-extensive lake in Central Asia that has been shrinking markedly since the 1960s. For the first time in modern history, the eastern basin of the South Aral Sea has completely dried.

This image pair from the Moderate Resolution Imaging Spectroradiometer (MODIS) on NASA’s Terra satellite shows the sea without its eastern lobe on August 19, 2014 (top). Substantial changes are apparent when compared to an image from August 25, 2000 (bottom), and again when compared to the approximate location of the shoreline in 1960 (black outline).

“This is the first time the eastern basin has completely dried in modern times,” said Philip Micklin, a geographer emeritus from Western Michigan University and an Aral Sea expert. “And it is likely the first time it has completely dried in 600 years, since Medieval desiccation associated with diversion of Amu Darya to the Caspian Sea.”

In the 1950s and 1960s, the government of the former Soviet Union diverted the Amu Darya and the Syr Darya—the region’s two major rivers—to irrigate farmland. The diversion began the lake’s gradual retreat. By the start of the Terra series in 2000, the lake had already separated into the North (Small) Aral Sea in Kazakhstan and the South (Large) Aral Sea in Uzbekistan. The South Aral had further split into western and eastern lobes.

The eastern lobe of the South Aral nearly dried in 2009 and then saw a huge rebound in 2010. Water levels continued to fluctuate annually in alternately dry and wet years.

Acquired August 25, 2000

According to Micklin, the desiccation in 2014 occurred because there has been less rain and snow in the watershed that starts in the distant Pamir Mountains; this has greatly reduced water flow on the Amu Darya. In addition, huge amounts of river water continue to be withdrawn for irrigation. The Kok-Aral Dam across the Berg Strait—a channel that connects the northern Aral Sea with the southern part—played some role, but has not been a major factor this year, he said.

“This part of the Aral Sea is showing major year-to-year variations that are dependent on flow of Amu Darya,” Micklin said. “I would expect this pattern to continue for some time.”

More information: 
Micklin, P. (2010, September) “The past, present, and future Aral Sea.” Lakes & Reservoirs: Research & Management, 15 (3), 193. Accessed September 25, 2014. dx.doi.org/10.1111/j.1440-1770.2010.00437.x

Note : The above story is based on materials provided by NASA

Tooth buried in bone shows prehistoric predators tangled across land, sea

Teeth from phytosaurs, a reptile from the Triassic Period about 210 million years ago in what is now the western United States. The blue tooth on the left is a 3-D printed replica of a tooth embedded in the thigh bone of a rauisuchid, another Triassic period carnivore. The details of the tooth were digitally extracted using CT scans. Credit: Virginia Tech

About 210 million years ago when the supercontinent of Pangea was starting to break up and dog-sized dinosaurs were hiding from nearly everything, entirely different kinds of reptiles called phytosaurs and rauisuchids were at the top of the food chain.

It was widely believed the two top predators didn’t interact much as the former was king of the water, and the latter ruled the land. But those ideas are changing, thanks largely to the contents of a single bone.

In a paper published online in September in the German journal Naturwissenschaften, Stephanie Drumheller of the University of Tennessee and Michelle Stocker and Sterling Nesbitt, vertebrate paleontologists with the Virginia Tech’s Department of Geosciences, present evidence the two creatures not only interacted, but did so on purpose.

“Phytosaurs were thought to be dominant aquatic predators because of their large size and similarity to modern crocodylians,” said Stocker, “but we were able to provide the first direct evidence they targeted both aquatic and large terrestrial prey.”

The evidence? A tooth. Not just any tooth, but the tooth of a phytosaur lodged in the thigh bone of a rauisuchid, a creature about 25 feet long and 4 feet high at the hip. The tooth lay broken off and buried about two inches deep in bone, and then healed over, indicating the rauisuchid survived the attack.

“Finding teeth embedded directly in fossil bone is very, very rare,” Drumheller said. “This is the first time it’s been identified among phytosaurs, and it gives us a smoking gun for interpreting this set of bite marks.”

The researchers came across the bone by chance at the University of California Museum of Paleontology in Berkeley.

“It was remarkable we were able to reconstruct a part of an ancient food web from over 210 million years ago from a few shallow marks and a tooth in a bone,” said Nesbitt. “It goes to show how careful observation can lead to important discoveries even when you’re not seeking those answers.

“We came across this bone and realized pretty quickly we had something special,” Nesbitt said. “There are many bones that get dug up, not all are immediately processed, prepared, and studied. No one had recognized the importance of this specimen before but we were able to borrow it and make our study.”

The large rauisuchid thigh bone at the center of the research has the tooth of the attacker, which the researchers recreated using CT scans and a 3-D printer. Multiple bite marks indicate the creature was preyed upon at least twice over the course of its life, by phytosaurs.

“This research will call for us to go back and look at some of the assumptions we’ve had in regard to the Late Triassic ecosystems,” Stocker said. “The distinctions between aquatic and terrestrial distinctions were over-simplified and I think we’ve made a case that the two spheres were intimately connected.”

Note : The above story is based on materials provided by Virginia Tech.

2013 Colorado front range flood: Debris-flow a major hazard

House damaged by a September 2013 debris flow in Big Thompson Canyon in the Colorado Front Range; deposit (foreground) covers US Highway 34. Credit: Jonathan Godt / GSA Today

Massive flooding in Colorado in September 2013, and the concomitant landslides and debris flows, caused widespread damage across the Front Range. In the October issue of GSA Today, Jeffrey Coe, Jason Kean, Jonathan Godt, Rex Baum, and Eric Jones at the U.S. Geological Survey; David Gochis at the National Center for Atmospheric Research; and Gregory Anderson of the Boulder Mountain Fire Protection District present insights on hazard assessment gained from this extraordinary debris-flow event.

Between 9 and 13 September 2013, more than 1,100 debris flows occurred in an area of about 3,400 square kilometers, most of which were triggered by two periods of intense rainfall: one lasting 12.5 hours on 11–12 September, with a maximum 10-minute intensity of 67 mm/hour, the other lasting 8 hours on 12 September, with a maximum intensity of 39 mm/hour.

Almost all of the flows were initiated on steep (greater than 25 degrees), south- and east-facing canyon and hogback slopes with upslope contributing areas of more than 3,300 square meters, the largest at elevations above 2600 m. Areal concentrations of the flows show that colluvial soils on sedimentary rocks were more susceptible than soils on crystalline rocks.

This major flooding event serves as an alert to authorities and residents in the Front Range and other interior continental areas with steep slopes. In these locations, widespread debris flows are unusual—yet their threat may be all the greater because of their infrequency.

More information:
New insights into debris-flow hazards from an extraordinary event in the Colorado Front Range , Jeffrey A. Coe et al., U.S. Geological Survey, Denver Federal Center, MS 966, Denver, Colorado 80215, USA. Pages 4-10 DOI: 10.1130/GSATG214A.1

Note : The above story is based on materials provided by Geological Society of America

New tremors raise concern at Japan’s Mount Ontake

An aerial view shows volcanic smoke and fume raising from craters of Mount Ontake, central Japan, Tuesday, Sept. 30, 2014. Toxic gases and ash from still-erupting Mount Ontake forced Japanese rescue workers to call off the search for more victims Monday as dozens of relatives awaited news of their family members. (AP Photo/Kyodo News)

Increased seismic activity raised concern Tuesday about the possibility of another eruption at a Japanese volcano where 36 people were killed, forcing rescuers to suspend plans to try to recover at least two dozen bodies still near the summit.

Volcanic tremors rose to a level not seen since Saturday evening, hours after Mount Ontake’s initial large eruption, said Shoji Saito of the Japan Meteorological Agency. The tremor levels were oscillating up and down.

“At this point, anything can happen,” Saito said, though he stopped short of predicting another large eruption.

About 80 to 100 relatives and friends of those who never returned from the summit were waiting for news in a municipal hall in the nearby central Japanese town of Kiso.

Rescuers found five more bodies on Monday, bringing the death toll to 36. They have managed to airlift only 12 bodies off the mountain since the start of the eruption on Saturday because of dangerous conditions.

There were believed to be at least 250 people on the mountain, a popular hiking destination, when it erupted.

How the victims died remains unclear, though experts say it was probably from suffocating ash, falling rocks, toxic gases or some combination of them. Some of the bodies had severe contusions.

Survivors told Japanese media that they were pelted by rocks from the eruption.

Yuji Tsuno, a veteran mountain photographer, was near the summit. After taking pictures of the initial explosion as ash and debris rained down, he quickly took refuge in a nearby hut, he told the TBS TV network.

About 20 minutes later, when the smoke partially subsided, Tsuno rushed out and began his descent. It was a gamble, but he believed it was his only chance, he said.

“I almost thought it was the end of my life,” he said in the interview.

On his way down, he spotted a man heading up. “I told him to go down with me, but he said he had to check on his child up there. I couldn’t stop him,” Tsuno said.

The eruption caught seismologists by surprise. Although somewhat increased seismic activity had been recorded for about two weeks, there were no indications of a major eruption, said Satoshi Deguchi, a Japan Meteorological Agency official in Nagano prefecture. Typical signs, such as increased seismic rattling or underground structural movement, were not detected.

The eruption was the first fatal one in modern times at the 3,067-meter (10,062-foot) mountain, located about 210 kilometers (130 miles) west of Tokyo. An eruption occurred in 1979, but no one died.

Note : The above story is based on materials provided by © 2014 The Associated Press. All rights reserved.

Sand dunes reveal biodiversity secrets in Australia

Erg Chebbi, Morocco, Africa © Rosino

Ancient, acidic and nutrient-depleted dunes in Western Australia are not an obvious place to answer a question that has vexed tropical biologists for decades. But the Jurien Bay dunes proved to be the perfect site to unravel why plant diversity varies from place to place.

Smithsonian Tropical Research Institute scientist Benjamin Turner and colleagues from the University of Western Australia published findings in the Sept. 26 edition of Science showing that environmental filtering — but not a host of other theories — determines local plant diversity in one of Earth’s biodiversity hotspots.

Turner and colleagues examined plant communities and soil development across a sequence of dunes ranging in age from a few decades to more than 2 million years. The dunes form as sand piles up along the coastline of Western Australia during periods of high sea level. The youngest dunes contain abundant soil nutrients but are home to relatively few plant species, whereas the oldest dunes have some of the most infertile soils in the world yet support many species of plants.

The differences in diversity of plants on the dunes are much better explained by environmental filtering — the exclusion of species from the regional flora that are poorly adapted to local conditions — than by alternative ideas related to competition for resources.

“Ecologists have long sought to understand what explains variation in species diversity among sites,” said Helene Muller-Landau, STRI staff scientist. “This elegant study shows that variation in plant species diversity among dunes of different ages, and thus different soils, is explained mainly by variation in the size of the pool of species adapted to these differing conditions.” Biogeographical and historical factors, like the total area in the region with similar conditions today and in the past, are primary, while factors such as competition for soil resources are much less important in explaining variation in species diversity.

“A number of mechanisms have been proposed to explain plant diversity along resource gradients, but they have not previously been tested simultaneously,” Turner said. “The Jurien Bay chronosequence allowed us to do this, and gave a clear result — that local plant diversity is explained primarily by environmental filtering from the regional flora.”

Jurien Bay is a rare example of a long-term chronosequence of soils in a species-rich ecosystem, making it an ideal location to test biodiversity theory.

“A challenge now is to examine this process along chronosequences in other species-rich ecosystems,” Turner said. “Unfortunately, there are as yet no long-term soil chronosequences with intact vegetation known under diverse lowland tropical forest.”

Turner expects the findings to spark a flurry of debate, but emphasizes that the research does not seek to explain the maintenance of biodiversity within individual communities, only how it varies among communities. Theories such as negative density dependence — that natural enemies maintain diversity in species-rich plant communities — are not challenged by this work, he said.

“It’s important to recognize that resource competition or other mechanisms can still maintain diversity,” Turner said. “But in terms of explaining why plant diversity varies from place to place, our results indicate that environmental filtering is the overriding explanation. ”

“I suspect that the answers will be different for different ecosystems in different places,” Muller-Landau said. “Here in Panama, and throughout the tropics, wet forests tend to have much higher species diversity than dry forests. This pattern is generally explained in terms of differences in ecological conditions, especially wet forests being more conducive to pathogen attack. But we’re not sure if this is the correct explanation. A study like this would help us to sort that out.”

Note : The above story is based on materials provided by Smithsonian Tropical Research Institute.

Glaciers in the grand canyon of Mars?

Valles Marineris, Mars. Credit: NASA

For decades, planetary geologists have speculated that glaciers might once have crept through Valles Marineris, the 2000-mile-long chasm that constitutes the Grand Canyon of Mars. Using satellite images, researchers have identified features that might have been carved by past glaciers as they flowed through the canyons; however, these observations have remained highly controversial and contested.

Now, a joint team from Bryn Mawr College and the Freie Universitaet Berlin has identified what could be the first mineralogical evidence of past glaciers within the Valles Marineris: a layer of mixed sulfate minerals halfway up the three-mile-high cliffs of Ius Chasma at the western end of the canyon system.

The team—including Selby Cull (Bryn Mawr College), Patrick McGuire and Christoph Gross (Freie Universitaet Berlin), and Bryn Mawr undergraduate student researchers Jenna Myers and Nina Shmorhun—mapped the acid-sulfate mineral jarosite along the canyon wall. They speculate that it may have formed via a mechanism similar to one observed at glaciers in the Svalbard on Earth: Atmospheric sulfur becomes trapped in the ice, is warmed by the sun, and reacts with the water to produce highly acidic sulfate minerals like jarosite along the margins of the glacier.

More information:
“A new type of jarosite deposit on Mars: Evidence for past glaciation in Valles Marineris?” Selby Cull et al. Geology dx.doi.org/10.1130/G36152.1.

Note : The above story is based on materials provided by Geological Society of America

Prehistoric volcanic eruption leaves intercontinental footprint

Microscopic image of a sample of White River Ash from the Yukon. The picture is of a polished surface of the pumice grains mounted in epoxy, which is how the samples are prepared for analysis.

A new study led by University of Alberta researchers has shown that a volcanic eruption 1,200 years ago scattered ash from Alaska to Europe—a discovery that will help researchers understand how future eruptions could affect the world.
Britta Jensen and Duane Froese in the U of A’s Faculty of Science led the research, which showed that a distinct deposit of white, sand-sized grains of volcanic ash visible just below the modern forest floor over much of the Yukon and southern Alaska is present not only near the originating Mount Bona-Churchill in Alaska, but also in the Greenland Ice Sheet and across northwestern Europe.

The deposit, commonly known as the White River Ash, is so prominent that locals sometimes refer to it as “Sam McGee’s Ashes” in reference to the Robert Service poem.

As part of the study, samples of the White River Ash, along with ash previously assumed to be from Iceland, were gathered from northern Canada, eastern North America, Greenland, Northern Ireland and Germany. By comparing characteristic features of these samples, the researchers showed that all of the ash originated from the same large prehistoric volcanic eruption in Alaska about 1,200 years ago.

Ash beds, known as tephra, are important to researchers because they take just days to weeks to deposit—which creates precise links between geologic records. As a result, each ash bed represents a specific moment in time, and provides important insights into the frequency and effects of moderate to large volcanic eruptions.

Although it was generally thought that only rare “super eruptions” were capable of spreading volcanic ash across more than one continent—only the exceptional eruption of Toba (Indonesia), which occurred 75,000 years ago, has a proven ash distribution equal to the White River Ash—Jensen says this research illustrates that more frequent and moderate-sized eruptions can also lead to intercontinental distribution.

“It’s possible that the perceived lack of other similar intercontinental correlations is not because they are rarer, but because scientists simply have not expected relatively smaller eruptions to be capable of distributing ash on this scale,” she says. “This has direct implications for volcanic dispersal studies with the correlation of widely distributed geologic records and volcanic hazard assessment.

“Given the social and economic impact of the 2010 eruption of Eyjafjallajökull, it is critical to more effectively integrate geologic records of past eruptions in volcanic hazard assessments to understand the potential for impact.”

More information:
Britta J.L. Jensen, Sean Pyne-O’Donnell, Gill Plunkett, Duane G. Froese, Paul D.M. Hughes, Michael Sigl, Joseph R. McConnell, Matthew J. Amesbury, Paul G. Blackwell, Christel van den Bogaard, Caitlin E. Buck, Dan J. Charman, John J. Clague, Valerie A. Hall, Johannes Koch, Helen Mackay, Gunnar Mallon, Lynsey McColl, and Jonathan R. Pilcher “Transatlantic distribution of the Alaskan White River Ash,” Geology, October 2014, v. 42, p. 875-878, DOI: 10.1130/G35945.1

Note : The above story is based on materials provided by University of Alberta

Related Articles