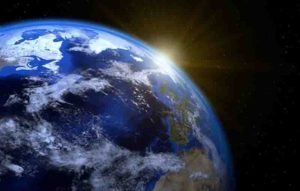
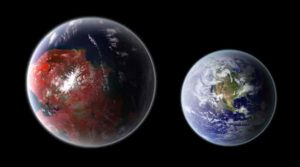
back to top
27.8 C
New York
Tuesday, October 8, 2024
Home Blog Page 26

Scientists identify flank instability at a volcano with history of collapse

Scientists identified flank instability at Pacaya, an active volcano in Guatemala. Credit: Kirsten Stephens/Penn State

Landslides caused by the collapse of unstable volcanoes are one of the major dangers of volcanic eruptions. A method to detect long-term movements of these mountains using satellite images could help identify previously overlooked instability at some volcanoes, according to Penn State scientists.

“Whenever there is a large volcanic eruption, there is a chance that if a flank of the volcano is unstable there could be a collapse,” said Judit Gonzalez-Santana, a doctoral student in the Department of Geosciences. “To better explore this hazard, we applied an increasingly popular and more sensitive time-series method to look at these movements, or surface deformation, over longer time periods.”

Using the time-series technique, the scientists found surface deformation related to flank motion had occurred at Pacaya, an active volcano in Guatemala, from 2011 to 2013 when the volcano was largely quiet, and increased leading up to an eruption in 2014. Previous work had not identified flank motion during this time, the scientists said.

“People have looked at that volcano with satellite remote sensing but did not detect this long-term flank motion or creep,” said Christelle Wauthier, associate professor of geosciences. “Because the surface deformation changes are pretty small per year, it can easily be below the detection limits of conventional methods, but still within the limits of Judit’s work using a time-series approach.”

Scientists track surface deformation using radar satellites sensitive enough to spot changes of just a few inches on the ground. Comparing two of these images using the conventional Interferometric Synthetic Aperture Radar (InSAR) technique creates an interferogram, essentially a map of surface movement. But the quality of the InSAR results decreases with the time separating two images and can be affected by even small changes, like from vegetation growth or a buildup of ash spewed from a volcano, the scientists said.

The team instead conducted an InSAR time-series analysis using hundreds of satellite images taken over years and identifying surface deformation between each.

“You can use many of these short-term surface movement maps to give you information of surface displacement over a long time period,” Gonzalez-Santana said. “Then you can look at the surface deformation maps and see how much each pixel has been moving since the date the first image was acquired, for example.”

The results, published in the Journal of Volcanology and Geothermal Research, provide finer detail of volcanic flank motion, and can reveal upticks in the rate that creep is occurring, like at Pacaya before the eruption in 2014, the scientists said. The team has shared the results with officials in Guatemala who monitor the volcano.

“This kind of creep is not uncommon and not particularly dangerous on its own, but if you have extra forcings like from magma being pressurized and pushing against the wall of the chamber or intrusion, it can trigger a catastrophic collapse,” Wauthier said. “To be able to understand the behavior of the instability and potentially detect changes in rates of motion is very critical for monitoring that potential collapse.”

The method shows promise for identifying deformation particularly at volcanoes that lack expensive real-time monitoring networks and those located in tropical areas with thick vegetation that create problems for traditional InSAR, the scientists said.

Flank instability is often studied at oceanic volcanoes, where a collapse could trigger a deadly tsunami, according to the scientists. But collapses also happen inland, including prominently at Mount St. Helens in 1980.

Pacaya itself experienced a collapse sometime around 1,000 years ago, creating a debris avalanche that traveled more than 15 miles, and leaving a prominent scar on the volcano. Subsequent eruptions have built the volcano back up and it could someday again collapse, the scientists said.

“More than 10,000 people live within about three miles of the volcano,” Gonzalez-Santana said. “If you take into consideration the last avalanche traveled 15 miles away, anyone living in the valleys around the volcano could be at risk.”

A NASA Earth Surface and Interior grant, a Future Investigators in NASA Earth and Space Science and Technology grant, and an Institute for Computational and Data Sciences seed grant funded this research.

Reference:
Judit Gonzalez-Santana, Christelle Wauthier. Unraveling long-term volcano flank instability at Pacaya Volcano, Guatemala, using satellite geodesy. Journal of Volcanology and Geothermal Research, 2020; 107147 DOI: 10.1016/j.jvolgeores.2020.107147

Note: The above post is reprinted from materials provided by Penn State. Original written by Matthew Carroll.

New light shed on behavior of giant carnivorous dinosaur Spinosaurus

Life reconstruction of a Spinosaurus wading in the water and fishing. Credit: Robert Nicholls ©Nicholls2020

New research from Queen Mary University of London and the University of Maryland, has reignited the debate around the behaviour of the giant dinosaur Spinosaurus.

Since its discovery in 1915, the biology and behaviour of the enormous Spinosaurus has puzzled palaeontologists worldwide. It was recently argued that the dinosaur was largely an aquatic predator, using its large tail to swim and actively pursue fish in the water.

The new study, published today in Palaeontologia Electronica, challenges this recent view of Spinosaurus suggesting that whilst it likely fed from the water, and may have swum, it wasn’t well adapted to the life of an aquatic pursuit predator. Instead it was like a giant (if flightless) heron or stork — snatching at fish from the shoreline while also taking any other small available prey on land or in water.

Reviewing the evidence

The researchers compared the features of Spinosaurus with the skulls and skeletons of other dinosaurs and various living and extinct reptiles that lived on land, in the water or did both. They found that whilst there were several pieces of evidence that contradicted the aquatic pursuit predator concept, none contradicted the wading heron-like model, and various lines of evidence actively supported it.

Dr David Hone, Senior Lecturer at Queen Mary and lead author on the project said: “The biology and ecology of Spinosaurus has been troubling palaeontologists for decades. Some recent studies have suggested that it was actively chasing fish in water but while they could swim, they would not have been fast or efficient enough to do this effectively. Our findings suggest that the wading idea is much better supported, even if it is slightly less exciting.”

Co-author Tom Holtz, Principal Lecturer in Vertebrae Paleontology, University of Maryland, said: “Spinosaurus was a bizarre animal even by dinosaur standards, and unlike anything alive today, so trying to understand its ecology will always be difficult. We sought to use what evidence we have to best approximate its way of life. And what we found did not match the attributes one would expect in an aquatic pursuit predator in the manner of an otter, sea lion, or short-necked plesiosaur.”

One of the key pieces of evidence unearthed by the researchers related to the dinosaur’s ability to swim. Spinosaurus was already shown to be a less efficient swimmer than a crocodile, but also has fewer tail muscles than a crocodile, and due to its size would have a lot more drag in the water.

Dr Hone said: “Crocodiles are excellent in water compared to land animals, but are not that specialised for aquatic life and are not able to actively chase after fish. If Spinosaurus had fewer muscles on the tail, less efficiency and more drag then it’s hard to see how these dinosaurs could be chasing fish in a way that crocodiles cannot.”

Dr Holtz added: “We certainly add that the evidence points to Spinosaurus feeding partly, even mostly, in the water, probably more so than any other large dinosaur. But that is a different claim than it being a rapid swimmer chasing after aquatic prey.” Though as Dr Hone concludes: “Whilst our study provides us with a clearer picture of the ecology and behaviour of Spinosaurus, there are still many outstanding questions and details to examine for future study and we must continue to review our ideas as we accumulate further evidence and data on these unique dinosaurs. This won’t be the last word on the biology of these amazing animals.”

Life in water

Originally found in Egypt, Spinosaurus is thought to be one of the largest carnivorous dinosaurs to exist probably reaching over 15 m in length. The first known Spinosaurus fossils were destroyed by Allied bombing during World War II, which has hampered palaeontologist’s attempts to understand these unusual creatures. More recently the dinosaur found fame in the 2001 film Jurassic Park III, where it battles and defeats a Tyrannosaurus rex.

Reference:
David Hone, Thomas Holtz. Evaluating the ecology of Spinosaurus: shoreline generalist or aquatic pursuit specialist? Palaeontologia Electronica, 2021; DOI: 10.26879/1110

Note: The above post is reprinted from materials provided by Queen Mary University of London.

Geological phenomenon widening the Atlantic Ocean

39 Ocean Bottom Seismometers where deployed on the ocean floor across the Mid-Atlantic Ridge as part of the PI-LAB experiment. Credit: University of Southampton

An upsurge of matter from deep beneath the Earth’s crust could be pushing the continents of North and South America further apart from Europe and Africa, new research has found.

The plates attached to the Americas are moving apart from those attached to Europe and Africa by four centimetres per year. In between these continents lies the Mid-Atlantic Ridge, a site where new plates are formed and a dividing line between plates moving to the west and those moving to the east; beneath this ridge, material rises to replace the space left by the plates as they move apart.

Conventional wisdom is that this process is normally driven by distant gravity forces as denser parts of the plates sink back into the Earth. However, the driving force behind the separation of the Atlantic plates has remained a mystery because the Atlantic ocean is not surrounded by dense, sinking plates.

Now a team of seismologists, led by the University of Southampton, have found evidence of an upwelling in the mantle—the material between the Earth’s crust and its core—from depths of more than 600 kilometres beneath the Mid Atlantic ridge, which could be pushing the plates from below, causing the continents to move further apart.

Upwellings beneath ridges are typically thought to originate from much shallower depths of around 60 km.

The findings, published in the journal Nature provide a greater understanding of plate tectonics which causes many natural disasters around the world, including earthquakes, tsunamis and volcanic eruptions.

Over two research cruises on the RV Langseth and RRV Discovery, the team deployed 39 seismometers at the bottom of the Atlantic as part of the PI-LAB (Passive Imaging of the Lithosphere-Asthenosphere Boundary) experiment and EURO-LAB (Experiment to Unearth the Rheological Oceanic Lithosphere-Asthenosphere Boundary). The data provides the first large scale and high-resolution imaging of the mantle beneath the Mid-Atlantic Ridge.

This is one of only a few experiments of this scale ever conducted in the oceans and allowed the team to image variations in the structure of the Earth’s mantle near depths of 410 km and 660 km—depths that are associated with abrupt changes in mineral phases. The observed signal was indicative of a deep, sluggish and unexpected upwelling from the deeper mantle.

Lead author, Matthew Agius, a former post-doctoral fellow at the University of Southampton and currently at Università degli studi Roma Tre said: “This was a memorable mission that took us a total of 10 weeks at sea in the middle of the Atlantic Ocean. The incredible results shed new light in our understanding of how the Earth interior is connected with plate tectonics, with observations not seen before.”

Dr. Kate Rychert and Dr. Nick Harmon from the University of Southampton and Professor Mike Kendall from the University of Oxford led the experiment and were the chief scientists on the cruises. The experiment was funded by NERC (Natural Environment Research Council, UK) and the ERC (European Research Council).

Dr. Harmon said: “There is a growing distance between North America and Europe, and it is not driven by political or philosophical differences—it is caused by mantle convection!”

As well as helping scientists to develop better models and warning systems for natural disasters, plate tectonics also has an impact on sea levels, and therefore affects climate change estimates over geologic times scales.

Dr. Rychert said: “This was completely unexpected. It has broad implications for our understanding of Earth’s evolution and habitability. It also demonstrates how crucial it is to gather new data from the oceans. There is so much more to explore!”

Professor Mike Kendall added: “This work is exciting and that it refutes long held assumptions that mid-ocean ridges might play a passive role in plate tectonics. It suggests that in places such as the Mid-Atlantic, forces at the ridge play an important role in driving newly-formed plates apart.”

Reference:
A thin mantle transition zone beneath the equatorial Mid-Atlantic Ridge, Nature (2021). DOI: 10.1038/s41586-020-03139-x

Note: The above post is reprinted from materials provided by University of Southampton.

Unravelling the when, where and how of volcanic eruptions

Better predictions of volcanic eruptions would help protect the lives of those living close to them. Credit: Jorge Nava - Navart/Wikimedia, licensed under CC BY-SA 2.0
Better predictions of volcanic eruptions would help protect the lives of those living close to them. Credit: Jorge Nava – Navart/Wikimedia, licensed under CC BY-SA 2.0

There are about 1,500 potentially active volcanoes worldwide and about 50 eruptions occur each year. But it’s still difficult to predict when and how these eruptions will happen or how they’ll unfold. Now, new insight into the physical processes inside volcanoes are giving scientists a better understanding of their behaviour, which could help protect the 1 billion people who live close to volcanoes.

Dome-building volcanoes, which are frequently active, are among the most dangerous types of volcanoes since they are known for their explosive activity. This type of volcano often erupts by first quietly producing a dome-shaped extrusion of thick lava at its summit which is too viscous to flow. When it eventually becomes destabilised, it breaks off and produces fast-moving currents of hot gas, solidified lava pieces and volcanic ash, called pyroclastic clouds, that flow down the sides of the volcano at the speed of a fast train.

“The hazards associated with them can be very spontaneous and hard to predict,” said Professor Thomas Walter, a professor of volcanology and geohazards at the University of Potsdam in Germany. “That’s why it’s so important to understand this phenomenon of lava domes.”

Little is known about the behaviour of lava domes, partly because there isn’t much data available. Prof. Walter and his colleagues want to better understand how they form, whether they can vary significantly in shape and what their internal structure is like. Over the last five years, through a project called VOLCAPSE, they have been using innovative techniques to monitor lava domes by using high resolution radar data captured by satellites as well as close-up views from cameras set up near volcanoes.

“Pixel by pixel, we could determine how the shape, morphology and structure of these lava domes changed,” said Prof. Walter. “We compared (the webcam images) to satellite radar observations.”

Time-lapse

The project focussed on a few dome-building volcanoes such as Colima in Mexico, Mount Merapi in Indonesia, Bezymianny in Russia, and Mount Lascar and Lastarria in Chile. It partly involved visiting them and installing instruments such as time-lapse cameras powered by solar panels that could be controlled remotely. If a lava dome started to f

Due to high altitudes and harsh weather conditions, setting up the cameras was more challenging than expected. “It was a sharp learning curve, but also trial and error, because nobody could tell us what to expect at these volcanoes since it was never done before,” said Prof. Walter.

During their visits, the team also used drones. These would fly over a lava dome and capture high resolution images from different perspectives, which could be used to create detailed 3-D models. Temperature and gas sensors on the drones provided additional information.

Prof. Walter and his colleagues used the data to create computer simulations, such as how the growth of lava domes changes from eruption to eruption. They found that new lava domes don’t always form in the same location: a lava dome may form at the summit of a volcano during one eruption while the next time it builds up on one of its flanks. The team was puzzled, since a conduit inside a volcano brings magma to the surface during an eruption, which would mean that it changes its orientation between one eruption and the next. “That was very surprising for us,” said Prof. Walter.

Stress field

They were able to explain how this happens by examining the distribution of internal forces—or stress field—in a volcano. When magma is expelled during an eruption, it changes how the forces are distributed inside and causes a reorientation of the conduit.

The team also found that there was a systematic pattern to how the stress field changed, meaning that by studying the position of lava domes they could estimate where they had formed in the past and where they would appear in the future. This could help determine which areas near a volcano are likely to be most affected by eruptions yet to come.

“This is a very cool result for predictive research if you want to understand where the lava dome is going to extrude (or collapse) from in the future,” he said.

Knowing where a volcano will erupt from is one thing, but knowing when it will do so is a different matter and the physical factors that govern this are also not well understood. Although there is a relationship between how often eruptions occur and their size, with big eruptions occurring very rarely compared to smaller ones, a lack of reliable data makes it hard to examine the processes that control eruption frequency and magnitude.

“When you go back in the geological record, (the traces of) many eruptions disappear because of erosion,” said Professor Luca Caricchi, a professor of petrology and volcanology at the University of Geneva in Switzerland.

Furthermore, it’s not possible to access these processes directly since they occur deep down beneath a volcano, at depths of 5 to 60 kilometres. Measuring the chemistry and textures of magma expelled during an eruption can provide some clues about the internal processes that led to the event. And magma chambers can sometimes be investigated when they pop up at the surface of the Earth due to tectonic processes. Extracting information from specific time periods is still difficult though since the ‘picture’ you get is like a movie where all the frames are collapsed into a single shot. “It’s complicated to retrieve the evolution in time—what really happened during the movie,” said Prof. Caricchi.

Prof. Caricchi and his colleagues are using a novel approach to forecast the recurrence rate of eruptions. Previous predictions were typically based on statistical analyses of the geological records of a volcano. But through a project called FEVER the team is aiming to combine this method with physical modelling of the processes responsible for the frequency and size of eruptions. A similar approach has been used to estimate when earthquakes and floods will occur again.

Using physical models should especially be useful to make predictions for volcanoes where there is little data available. “To extrapolate our findings from a place where we know a lot, like in Japan, you need a physical model that tells you why the frequency-magnitude relationship changes,” said Prof. Caricchi.

To create their model, the team have incorporated variables that affect pressure in the magma reservoir or the rate of accumulation of magma at depth below the volcano. The viscosity of the crust under the volcano and the size of the magma reservoir, for example, play a role. They have performed over a million simulations using all the possible combinations of values that can occur. The relationship between frequency and magnitude they obtained from their model was similar to what was estimated by using volcanic records so they think they were able to capture the fundamental processes involved.

“It’s sort of a fight between the amount of magma and the properties of the crust,” said Prof. Caricchi. “They are the two big players that fight each other to finally lead to this relationship.”

Tectonic plates

However, the team also found that the relationship between the size and frequency of changes across volcanoes in different regions. Prof. Caricchi thinks this is due to differences in the geometry of tectonic plates in each area. “We can see that the rate at which a plate subducts below another, and also the angle of subduction, seem to play an important role in defining the frequency and magnitude of a resulting eruption,” he said. The team is now starting to incorporate this new information into their model.

Being able to predict the frequency and magnitude of future eruptions using a model could help better assess hazards. In Japan, for example, one of the countries with the most active volcanoes, knowing the probability of future eruptions of various sizes is important when deciding where to build infrastructure such as nuclear power plants.

It’s also invaluable in densely populated areas, such as in Mexico City, which is surrounded by active volcanoes, including Nevado de Toluca. Prof. Caricchi and his colleagues studied this volcano, which hasn’t erupted for about 3,000 years. They found that once magmatic activity restarts, it would take about 10 years before a large eruption could potentially occur. This knowledge would prevent Mexico City from being evacuated if initial signs of activity are spotted.

“Once the activity restarts, you know you have ten years to follow the evolution of the situation,” said Prof. Caricchi. ‘(People) will now know a little bit more about what to expect.”

Note: The above post is reprinted from materials provided by Sandrine Ceurstemont, Horizon Magazine, Horizon: The EU Research & Innovation Magazine.

Using 100-million-year-old fossils and gravitational-wave science to predict Earth’s future climate

Image of archaea. Credit: Steve Gschmeissner/Science Photo Library

A group of international scientists, including an Australian astrophysicist, has used findings from gravitational wave astronomy (used to find black holes in space) to study ancient marine fossils as a predictor of climate change.

The research, published in the journal Climate of the Past, is a unique collaboration between palaeontologists, astrophysicists and mathematicians seeking to improve the accuracy of a palaeo-thermometer, which can use fossil evidence of climate change to predict what is likely to happen to the Earth in coming decades.

Professor Ilya Mandel, from the ARC Centre of Excellence in Gravitational Wave Discovery (OzGrav), and colleagues, studied biomarkers left behind by tiny single-cell organisms called archaea in the distant past, including the Cretaceous period and the Eocene.

Marine archaea in our modern oceans produce compounds called Glycerol Dialkyl Glycerol Tetraethers (GDGTs). The ratios of different types of GDGTs they produce depend on the local sea temperature at the site of formation.

When preserved in ancient marine sediments, the measured abundances of GDGTs have the potential to provide a geological record of long-term planetary surface temperatures.

To date, scientists have combined GDGT concentrations into a single parameter called TEX86, which can be used to make rough estimates of the surface temperature. However, this estimate is not very accurate when the values of TEX86 from recent sediments are compared to modern sea surface temperatures.

“After several decades of study, the best available models are only able to measure temperature from GDGT concentrations with an accuracy of around 6 degrees Celsius,” Professor Mandel said. Therefore, this approach cannot be relied on for high-precision measurements of ancient climates.

Professor Mandel and his colleagues at the University of Birmingham in the UK have applied modern machine-learning tools—originally used in the context of gravitational-wave astrophysics to create predictive models of merging black holes and neutron stars—to improve temperature estimation based on GDGT measurements. This enabled them to take all observations into account for the first time rather than relying on one particular combination, TEX86. This produced a far more accurate palaeo-thermometer. Using these tools, the team extracted temperature from GDGT concentrations with an accuracy of just 3.6 degrees—a significant improvement, nearly twice the accuracy of previous models.

According to Professor Mandel, determining how much the Earth will warm in coming decades relies on modelling, “so it is critically important to calibrate those models by utilizing literally hundreds of millions of years of climate history to predict what might happen to the Earth in the future,” he said.

Reference:
Tom Dunkley Jones et al. OPTiMAL: a new machine learning approach for GDGT-based palaeothermometry, Climate of the Past (2020). DOI: 10.5194/cp-16-2599-2020

Note: The above post is reprinted from materials provided by ARC Centre of Excellence for Gravitational Wave Discovery.

Scientists and philosopher team up, propose a new way to categorize minerals

Representative Image

A diamond lasts forever, but that doesn’t mean all diamonds have a common history.

Some diamonds were formed billions of years ago in space as the carbon-rich atmospheres of dying stars expanded and cooled. In our own planet’s lifetime, high-temperatures and pressures in the mantle produced the diamonds that are familiar to us as gems. 5,000 years ago, a large meteorite that struck a carbon-rich sediment on Earth produced an impact diamond.

Each of these diamonds differs from the others in both composition and genesis, but all are categorized as “diamond” by the authoritative guide to minerals—the International Mineralogical Association’s Commission on New Minerals, Nomenclature and Classification.

For many physical scientists, this inconsistency poses no problem. But the IMA system leaves unanswered questions for planetary scientists, geobiologists, paleontologists and others who strive to understand minerals’ historical context.

So, Carnegie’s Robert Hazen and Shaunna Morrison teamed up with CU Boulder philosophy of science professor Carol Cleland to propose that scientists address this shortcoming with a new “evolutionary system” of mineral classification—one that includes historical data and reflects changes in the diversity and distribution of minerals through more than 4 billion years of Earth’s history.

Their work is published by the Proceedings of the National Academy of Sciences.

“We came together from the very different fields of philosophy and planetary science to see if there was a rigorous way to bring the dimension of time into discussions about the solid materials that compose Earth,” Hazen said.

The IMA classification system for minerals dates to the 19th century when geologist James Dwight Dana outlined a way to categorize minerals on the basis of unique combinations of idealized compositions of major elements and geometrically idealized crystal structure.

“For example, the IMA defines quartz as pure silicon dioxide, but the existence of this idealized version is completely fictional,” said Morrison. “Every specimen of quartz contains imperfections—traces of its formation process that makes it unique.”

This approach to the categorization system means minerals with distinctly different historical origins are lumped together—as with the example of diamonds—while other minerals that share a common causal history are split apart.

“The IMA system is typical,” said lead author Cleland, explaining that most classification systems in the natural sciences, such as the periodic table of the elements, are time independent, categorizing material things “solely on the basis of manifest similarities and differences, regardless of how they were produced or what modifications they have undergone.”

For many researchers, a time-independent system is completely appropriate. But this approach doesn’t work well for planetary and other historically oriented geosciences, where the emphasis is on understanding the formation and development of planetary bodies.

Differences in a diamond or quartz crystal’s formative history are critical, Cleland said, because the conditions under which a sample was formed and the modifications it has undergone “are far more informative than the mere fact that a crystal qualifies as diamond or quartz.”

She, Hazen, and Morrison argue that what planetary scientists need is a new system of categorizing minerals that includes historical “natural kinds.”

Biology faced an analogous issue before Darwin put forward his theory of evolution. For example, lacking an understanding of how organisms are historically related through evolutionary processes, 17th century scholars debated whether bats are birds. With the advent of Darwin’s work in the 19th century, however, biologists classified them separately on evolutionary grounds, because they lack a common ancestor with wings.

Because a universal theory of “mineral evolution” does not exist, creating such a classification system for the geosciences is challenging. Hazen, Morrison, and Cleland’s proposed solution is what they call a “bootstrap” approach based on historically revelatory, information-rich chemical, physical, and biological attributes of solid materials. This strategy allows scientists to build a historical system of mineral kinds while remaining agnostic about its underlying theoretical principles.

“Minerals are the most durable, information-rich objects we can study to understand our planet’s origin and evolution,” Hazen said. “Our new evolutionary approach to classifying minerals complements the existing protocols and offers the opportunity to rigorously document Earth’s history.”

Morrison concurred, adding: “Rethinking the way we classify minerals offers the opportunity to address big, outstanding scientific mysteries about our planet and our Solar System, through a mineralogical lens. In their imperfections and deviations from the ideal, minerals capture the story of what has happened to them through deep time—they provide a time machine to go back and understand what was happening on our planet and other planets in our solar system millions or billions of years ago.”

Reference:
Carol E. Cleland el al., “Historical natural kinds and mineralogy: Systematizing contingency in the context of necessity,” PNAS (2020). www.pnas.org/cgi/doi/10.1073/pnas.2015370118

Note: The above post is reprinted from materials provided by Carnegie Institution for Science.

Deep, slow-slip action may direct largest earthquakes and their tsunamis

Map of the Cascadia subduction zone. Credit: Public Domain

Megathrust earthquakes and subsequent tsunamis that originate in subduction zones like Cascadia — Vancouver Island, Canada, to northern California — are some of the most severe natural disasters in the world. Now a team of geoscientists thinks the key to understanding some of these destructive events may lie in the deep, gradual slow-slip behaviors beneath the subduction zones. This information might help in planning for future earthquakes in the area.

“What we found was pretty unexpected,” said Kirsty A. McKenzie, doctoral candidate in geoscience, Penn State.

Unlike the bigger, shallower megathrust earthquakes that move and put out energy in the same direction as the plates move, the slow-slip earthquakes’ energy may move in other directions, primarily down.

Subduction zones occur when two of the Earth’s plates meet and one moves beneath the other. This typically creates a fault line and some distance away, a line of volcanoes. Cascadia is typical in that the tectonic plates meet near the Pacific coast and the Cascade Mountains, a volcanic range containing Mount St. Helens, Mount Hood and Mount Rainier, forms to the east.

According to the researchers, a megathrust earthquake of magnitude 9 occurred in Cascadia in 1700 and there has not been a large earthquake there since then. Rather, slow-slip earthquakes, events that happen deeper and move very short distances at a very slow rate, happen continuously.

“Usually, when an earthquake occurs we find that the motion is in the direction opposite to how the plates have moved, accumulating that slip deficit,” said Kevin P. Furlong, professor of geosciences, Penn State. “For these slow-slip earthquakes, the direction of movement is directly downward in the direction of gravity instead of in the plate motion directions.”

The researchers have found that areas in New Zealand, identified by other geologists, slow slip the same way Cascadia does.

“But there are subduction zones that don’t have these slow-slip events, so we don’t have direct measurements of how the deeper part of the subducting plate is moving,” said Furlong. “In Sumatra, the shallower seismic zone, as expected, moves in the plate-motion direction, but even though there are no slow-slip events, the deeper plate movement still appears to be primarily controlled by gravity.”

Slow-slip earthquakes occur at a deeper depth than the earthquakes that cause major damage and earth-shaking events, and the researchers have analyzed how this deep slip may affect the timing and behavior of the larger, damaging megathrust earthquakes.

“Slow-slip earthquakes rupture over several weeks, so they are not just one event,” said McKenzie. “It’s like a swarm of events.”

According to the researchers, in southern Cascadia, the overall plate motion is about an inch of movement per year and in the north by Vancouver Island, it is about 1.5 inches.

“We don’t know how much of that 30 millimeters (1 inch) per year is accumulating to be released in the next big earthquake or if some movement is taken up by some non-observable process,” said McKenzie. “These slow-slip events put out signals we can see. We can observe the slow-slip events going east to west and not in the plate motion direction.”

Slow-slip events in Cascadia occur every one to two years, but geologists wonder if one of them will be the one that will trigger the next megathrust earthquake.

The researchers measure surface movement using permanent, high-resolution GPS stations on the surface. The result is a stair step pattern of loading and slipping during slow-slip events. The events are visible on the surface even though geologists know they are about 22 miles beneath the surface. They report their results in Geochemistry, Geophysics, Geosystems.

“The reason we don’t know all that much about slow-slip earthquakes is they were only discovered about 20 years ago,” said Furlong. “It took five years to figure out what they were and then we needed precise enough GPS to actually measure the motion on the Earth’s surface. Then we had to use modeling to convert the slip on the surface to the slip beneath the surface on the plate boundary itself, which is bigger.”

The researchers believe that understanding the effects of slow-slip earthquakes in the region at these deeper depths will allow them to understand what might trigger the next megathrust earthquake in the area. Engineers want to know how strong shaking in an earthquake will be, but they also want to know the direction the forces will be in. If the difference in direction of slow-slip events indicates a potential change in behavior in a large event, that information would be helpful in planning.

“More fundamentally, we don’t know what triggers the big earthquake in this situation,” said McKenzie. “Every time we add new data about the physics of the problem, it becomes an important component. In the past, everyone thought that the events were unidirectional, but they can be different by 40 or 50 degrees.”

While the slow-events in Cascadia are shedding light on potential megathrust earthquakes in the area and the tsunamis they can trigger, Furlong thinks that other subduction zones may also have similar patterns.

“I would argue that it (differences in direction of motion) is happening in Alaska, Chile, Sumatra,” said Furlong. “It is only in a few that we see the evidence of it, but it may be a universal process that has been missed. Cascadia exhibits it because of the slow-slip events, but it may be fundamental to subduction zones.”

Also working on this project was Matthew W. Herman, assistant professor of geology, California State University, Bakersfield.

The National Science Foundation supported this work.

Reference:
K. A. McKenzie, K. P. Furlong, M. W. Herman. Bidirectional Loading of the Subduction Interface: Evidence From the Kinematics of Slow Slip Events. Geochemistry, Geophysics, Geosystems, 2020; 21 (9) DOI: 10.1029/2020GC008918

Note: The above post is reprinted from materials provided by Penn State. Original written by A’ndrea Elyse Messer.

Lava lake forms as Hawaii volcano erupts after 2-year break

A plume rises near active fissures in the crater of Hawaii's Kilauea volcano on Monday, Dec. 21, 2020. People are lining up to try to get a look at the volcano on the Big Island, which erupted last night and spewed ash and steam into the atmosphere. A spokeswoman for Hawaii Volcanoes National Park says the volcanic activity is a risk to people in the park Monday and that caution is needed. (M. Patrick/U.S. Geological Survey via AP)
A plume rises near active fissures in the crater of Hawaii’s Kilauea volcano on Monday, Dec. 21, 2020. People are lining up to try to get a look at the volcano on the Big Island, which erupted last night and spewed ash and steam into the atmosphere. A spokeswoman for Hawaii Volcanoes National Park says the volcanic activity is a risk to people in the park Monday and that caution is needed. (M. Patrick/U.S. Geological Survey via AP)

Lava was rising more than 3 feet (1 meter) per hour in the deep crater of a Hawaii volcano that began erupting over the weekend after a two-year break, scientists said Tuesday.

Kilauea volcano within Hawaii Volcanoes National Park on the Big Island was gushing molten rock from at least two vents inside its summit crater, the U.S. Geological Survey said. A lava lake has formed, rising about 440 feet (134 meters) from the bottom of the crater.

Since the eruption began Sunday night, Kilauea has spewed some 2 billion gallons of lava (10 million cubic meters), enough to cover 33 acres (13 hectares). The lava has been contained inside the deep crater.

It isn’t threatening to get close to people or cover property, like when Kilauea erupted from vents in the middle of a residential neighborhood in 2018 and destroyed more than 700 homes.

Still, the Hawaiian Volcano Observatory has warned residents to beware of potentially high levels of volcanic gas, rockfalls and explosions.

When erupting, Kilauea tends to spew large volumes of sulfur dioxide, which forms volcanic smog, or vog, when it mixes with oxygen, sunlight and other gases in the air. The state Department of Health warned residents to reduce their outdoor activities if they encounter volcanic smog conditions.

Kilauea is one of the world’s most active volcanoes, having erupted some 50 times in the last century. Between 1983 and 2018, it erupted almost continuously. It had a lava lake in its crater for the last decade of that eruption.

Note: The above post is reprinted from materials provided by The Associated Press. All rights reserved.

New model reveals previously unrecognized complexity of oceanic earthquake zones

Overview of the study area and the schematic illustration of interaction of fault motion and the seafloor subsidence. Credit: University of Tsukuba

Researchers from the University of Tsukuba applied seismic data from around the world to build a model of the 2020 Caribbean earthquake. Oceanic transform faults are generally considered to be linear and simple and have been widely used in studies of earthquake dynamics. However, the research team found that high complexity in rupture speed and direction can occur even in a supposedly simple linear fault system.

On 28 January 2020, a large oceanic earthquake with magnitude 7.7 occurred at the Oriente transform fault in the Caribbean Sea, between Jamaica and Cuba. It caused a minor tsunami of 0.11 m height and was felt as far afield as Florida.

A research team at the University of Tsukuba have developed a new finite-fault inversion method for building models based on teleseismic waveform data from earthquake monitoring stations. This new approach to using the data takes a more flexible approach to resolving the fault geometry. Rather than relying on prior assumptions, the faulting components are separately evaluated in a wider model in both time and space, allowing all possible rupture evolutions to be considered. The team were keen to use the Caribbean earthquake to help to understand the faulting processes that occur during these shallow oceanic quakes.

“Some cases of complex rupture dynamics have recently been reported in previous earthquake studies, raising the question of whether or not we are correctly modeling these even in supposedly simple fault systems,” says study author Professor Yuji Yagi. “The initial monitoring of this January 2020 event suggested variations in the waveform shape between two stations at similar distances from the epicenter, suggesting that there remains complexity to be explored at this fault.”

This was an excellent opportunity to test the new method developed by the team, which used data from 52 seismic stations to construct a detailed model of the geophysical processes within the fault that gave rise to the earthquake.

“The results revealed complex rupture during the earthquake, caused by a bend in the fault that led to the changes in rupture speed and direction detected in the monitoring data,” explains author Professor Ryo Okuwaki. “These variations triggered several successive rupture episodes that occurred along the 300-km-long fault.” The modeling approach also allows some suggestions to be made about the possible occurrence of subsidence and the shape of the surrounding seabed following the earthquake event.

These findings reveal that oceanic transform faults, considered to be simple and linear, may be much more complicated than previously accepted, and therefore require a more comprehensive approach to earthquake modeling. This work will shed light on a possible interaction between the earthquake-fault motion and the evolution of the ocean floor around the transform boundary.

Reference:
Tira Tadapansawut, Ryo Okuwaki, Yuji Yagi, Shinji Yamashita. Rupture Process of the 2020 Caribbean Earthquake along the Oriente Transform Fault, Involving Supershear Rupture and Geometric Complexity of Fault. Geophysical Research Letters, 2020; DOI: 10.1029/2020GL090899

Note: The above post is reprinted from materials provided by University of Tsukuba.

Volcanic eruptions directly triggered ocean acidification during Early Cretaceous

Calcium carbonate samples from a sediment core drilled from the mid-Pacific Mountains. Credit: Northwestern University

Around 120 million years ago, the earth experienced an extreme environmental disruption that choked oxygen from its oceans.

Known as oceanic anoxic event (OAE) 1a, the oxygen-deprived water led to a minor — but significant — mass extinction that affected the entire globe. During this age in the Early Cretaceous Period, an entire family of sea-dwelling nannoplankton virtually disappeared.

By measuring calcium and strontium isotope abundances in nannoplankton fossils, Northwestern earth scientists have concluded the eruption of the Ontong Java Plateau large igneous province (LIP) directly triggered OAE1a. Roughly the size of Alaska, the Ontong Java LIP erupted for seven million years, making it one of the largest known LIP events ever. During this time, it spewed tons of carbon dioxide (CO2) into the atmosphere, pushing Earth into a greenhouse period that acidified seawater and suffocated the oceans.

“We go back in time to study greenhouse periods because Earth is headed toward another greenhouse period now,” said Jiuyuan Wang, a Northwestern Ph.D. student and first author of the study. “The only way to look into the future is to understand the past.”

The study was published online last week (Dec. 16) in the journal Geology. It is the first study to apply stable strontium isotope measurements to the study of ancient ocean anoxic events.

Andrew Jacobson, Bradley Sageman and Matthew Hurtgen — all professors of earth and planetary sciences at Northwestern’s Weinberg College of Arts and Sciences — coauthored the paper. Wang is co-advised by all three professors.

Clues inside cores

Nannoplankton shells and many other marine organisms build their shells out of calcium carbonate, which is the same mineral found in chalk, limestone and some antacid tablets. When atmospheric CO2 dissolves in seawater, it forms a weak acid that can inhibit calcium carbonate formation and may even dissolve preexisting carbonate.

To study the earth’s climate during the Early Cretaceous, the Northwestern researchers examined a 1,600-meter-long sediment core taken from the mid-Pacific Mountains. The carbonates in the core formed in a shallow-water, tropical environment approximately 127 to 100 million years ago and are presently found in the deep ocean.

“When you consider the Earth’s carbon cycle, carbonate is one of the biggest reservoirs for carbon,” Sageman said. “When the ocean acidifies, it basically melts the carbonate. We can see this process impacting the biomineralization process of organisms that use carbonate to build their shells and skeletons right now, and it is a consequence of the observed increase in atmospheric CO2 due to human activities.”

Strontium as corroborating evidence

Several previous studies have analyzed the calcium isotope composition of marine carbonate from the geologic past. The data can be interpreted in a variety of ways, however, and calcium carbonate can change throughout time, obscuring signals acquired during its formation. In this study, the Northwestern researchers also analyzed stable isotopes of strontium — a trace element found in carbonate fossils — to gain a fuller picture.

“Calcium isotope data can be interpreted in a variety of ways,” Jacobson said. “Our study exploits observations that calcium and strontium isotopes behave similarly during calcium carbonate formation, but not during alteration that occurs upon burial. In this study, the calcium-strontium isotope ‘multi-proxy’ provides strong evidence that the signals are ‘primary’ and relate to the chemistry of seawater during OAE1a.”

“Stable strontium isotopes are less likely to undergo physical or chemical alteration over time,” Wang added. “Calcium isotopes, on the other hand, can be easily altered under certain conditions.”

The team analyzed calcium and strontium isotopes using high-precision techniques in Jacobson’s clean laboratory at Northwestern. The methods involve dissolving carbonate samples and separating the elements, followed by analysis with a thermal ionization mass spectrometer. Researchers have long suspected that LIP eruptions cause ocean acidification. “There is a direct link between ocean acidification and atmospheric CO2 levels,” Jacobson said. “Our study provides key evidence linking eruption of the Ontong Java Plateau LIP to ocean acidification. This is something people expected should be the case based on clues from the fossil record, but geochemical data were lacking.”

Modeling future warming

By understanding how oceans responded to extreme warming and increased atmospheric CO2, researchers can better understand how earth is responding to current, human-caused climate change. Humans are currently pushing the earth into a new climate, which is acidifying the oceans and likely causing another mass extinction.

“The difference between past greenhouse periods and current human-caused warming is in the timescale,” Sageman said. “Past events have unfolded over tens of thousands to millions of years. We’re making the same level of warming (or more) happen in less than 200 years.”

“The best way we can understand the future is through computer modeling,” Jacobson added. “We need climate data from the past to help shape more accurate models of the future.”

Reference:
Jiuyuan Wang, Andrew D. Jacobson, Bradley B. Sageman, Matthew T. Hurtgen. Stable Ca and Sr isotopes support volcanically triggeredbiocalcification crisis during Oceanic Anoxic Event 1a. Geology, 2020; DOI: 10.1130/G47945.1

Note: The above post is reprinted from materials provided by Northwestern University. Original written by Amanda Morris.

Scientists develop new approach to understanding massive volcanic eruptions

Pululagua in Ecuador

A geosciences team led by the University of South Florida (USF) has developed a new way to reconstruct the sizes of volcanic eruptions that occurred thousands of years ago, creating a first-of-its kind tool that can aid scientists in understanding past explosive eruptions that shaped the earth and improve the way of estimating hazards of future eruptions.

The advanced numerical model the USF team developed allows scientists to reconstruct eruption rates through time by estimating the dimensions of the umbrella clouds that contribute to the accumulation of vast deposits of volcanic ash. The research is published in the new edition of the Nature Journal, Communications, Earth and Environment.

The research, which was used to decipher the 2,500-year-old eruption of a volcano in Ecuador, was led by USF doctoral candidate Robert Constantinescu in collaboration with USF colleagues Research Associate Laura Connor, Professor Chuck Connor, Associate Professor Sylvain Charbonnier, doctoral alum Alain Volentik and other members of an international team. USF’s Volcanology Group is one of the world’s leading centers of volcano science and hazard assessment.

When large explosive eruptions occur, they form laterally spreading umbrella clouds into the stratosphere, facilitating the transport of fine-grained ash over hundreds of miles that settles and covers large swaths of land.

Current technology allows scientists to observe ash clouds. However, past eruptions are characterized based on the geological interpretation of their tephra deposits — the pieces and fragments of rock ejected into the air by an erupting volcano. By estimating the erupted volume and mass, plume height, umbrella cloud dimensions and other characteristics, the scientists are able to understand and characterize the volcanic eruptions, therefore improving the forecast of future events.

Using a series of field techniques combined with statistical and numerical modeling, volcanologists extract information from the deposits in order to characterize and classify an eruption on one of the most commonly used scales, the Volcanic Explosivity Index (VEI). Until now, the most sought-after information is the eruption column height and the total erupted mass or volume, Constantinescu said.

But over time, deposits erode and can provide an uncertain picture of older eruptions. Also, current models have been limited in that they assume all volcanic eruptions created mostly vertical plumes, Constantinescu said, and don’t account for large explosive eruptions that form laterally spreading umbrella ash clouds.

The USF team’s work shows that it is the dimensions of the umbrella clouds that is the telling factor in reconstructing past large explosive eruptions.

“The better we can reconstruct the nature of past eruptions from deposit data, the better we can anticipate potential hazards associated with future explosive eruptions,” the team wrote in the new journal article.

The researchers propose updating the VEI scale with the umbrella cloud dimensions, which can now be easily estimated using the mathematical models they’ve developed.

The researchers applied their model to the tephra deposit of the eruption of Pululagua, a now dormant volcano about 50 miles north of the capital city of Quito. Ecuador is considered one of the world’s most hazardous countries for volcanoes. The volcano last erupted an estimated 2,500 years ago and the area is now a geobotanical reserve renowned for its biodiversity and lush green landscape.

There are about 1,500 potentially active volcanoes worldwide, in addition to those that lurk beneath the world’s oceans. In 2020, there were at least 67 confirmed eruptions from 63 different volcanoes, according to the Smithsonian Institution Global Volcanism Program. “If in modern times the umbrella clouds of large eruptions are easily observed, we now have the ability to estimate the umbrella clouds of past eruptions,” Constantinescu said. “Our numerical model enables us to better characterize past volcanic eruptions and inform models for future hazard assessment.”

The USF team was joined in the research by Aurelian Hopulele-Gligor of Cluj-Napoca, Romania; Costanza Bonadonna of the University of Geneva; and Jan M. Lindsay of the University of Auckland. The research was funded in part by the National Science Foundation.

Reference:
Robert Constantinescu, Aurelian Hopulele-Gligor, Charles B. Connor, Costanza Bonadonna, Laura J. Connor, Jan M. Lindsay, Sylvain Charbonnier, Alain C. M. Volentik. The radius of the umbrella cloud helps characterize large explosive volcanic eruptions. Communications Earth & Environment, 2021; 2 (1) DOI: 10.1038/s43247-020-00078-3

Note: The above post is reprinted from materials provided by University of South Florida (USF Innovation).

Slow start of plate tectonics despite a hot early Earth

Photo: © Christian S. Marien

Writing in PNAS, scientists from Cologne university present important new constraints showing that plate tectonics started relatively slow, although the early Earth’s interior was much hotter than today.

In an international collaboration earth scientists at the University of Cologne discovered that during Earth’s early history mantle convection on, i.e. the internal mixing of our planet, was surprisingly slow and spatially restricted. This finding is unexpected because our planet was much hotter during the first hundreds of million years after its formation. Therefore, it has been assumed that mantle convection on Earth was much faster in its infancy. According to their study “Convective isolation of Hadean mantle reservoirs through Archean time,” however, the earth did not experience full speed mantle convection until 3 billion years ago, when modern plate tectonics is believed to have fully operated.

For their study, the geologists investigated up to 3.5 billion years old igneous rocks from NW Australia that cover 800 million years of Earths early history. The analysis of these rock successions revealed that the oldest samples exhibit small anomalies in the isotope abundances of the element tungsten (W) that progressively diminish with time. The origin of these anomalies, namely the relative abundance of 182W, relates to ancient heterogeneities in the terrestrial mantle that must have formed immediately after formation of the Earth more than 4.5 billion years ago. The preservation of these 182W anomalies in the igneous rocks from NW Australia demonstrate that pristine mantle reservoirs from the beginning of our planet were conserved over timescales exceeding more than one billion years.

This finding is very surprising, because higher mantle temperatures in the early Earth suggest that mantle convection was more extensive and much faster than today. Interestingly, the observed 182W anomalies start to diminish at around 3 billion years ago, within a geological era that is assumed to mark the beginning of modern plate tectonics. The onset of modern plate tectonics, involving subduction processes and mountain uplift, has been shown to be a key event triggering the emergence of large continental masses and an oxygen-rich atmosphere, all of which set the stage for the origin of more complex life.

Reference:
Jonas Tusch, Carsten Münker, Eric Hasenstab, Mike Jansen, Chris S. Marien, Florian Kurzweil, Martin J. Van Kranendonk, Hugh Smithies, Wolfgang Maier, and Dieter Garbe-Schönberg. Convective isolation of Hadean mantle reservoirs through Archean time. PNAS, 2020 DOI: 10.1073/pnas.2012626118

Note: The above post is reprinted from materials provided by University of Cologne.

Leaf fossils show severe end-Cretaceous plant extinction in southern Argentina

The scientists examined more than 3,500 fossils to identify survivor pairs - plants that grew in both the Cretaceous and Paleogene periods. The two fossils on the left are from the Cretaceous, and the two on the right are from the Paleogene. Credit: Elena Stiles
The scientists examined more than 3,500 fossils to identify survivor pairs – plants that grew in both the Cretaceous and Paleogene periods. The two fossils on the left are from the Cretaceous, and the two on the right are from the Paleogene. Credit: Elena Stiles

The asteroid impact 66 million years ago that ushered in a mass extinction and ended the dinosaurs also killed off many of the plants that they relied on for food. Fossil leaf assemblages from Patagonia, Argentina, suggest that vegetation in South America suffered great losses but rebounded quickly, according to an international team of researchers.

“Every mass extinction event is like a reset button, and what happens after that reset depends on which organisms survive and how they shape the biosphere,” said Elena Stiles, a doctoral student at the University of Washington who completed the research as part of her master’s thesis at Penn State. “All the biodiversity that we observe today is related to the organisms that made it past the last big reset 66 million years ago.”

Stiles and her colleagues examined more than 3,500 leaf fossils collected at two sites in Patagonia to identify how many species from the geologic period known as the Cretaceous survived the mass extinction event into the Paleogene period. Although plant families in the region fared well, the scientists found a surprising species-level extinction rate that may have reached as high as 92% in Patagonia, higher than previous studies have estimated for the region.

“There’s this idea that the Southern Hemisphere got off easier from the Cretaceous-Paleogene extinction than the Northern Hemisphere because we keep finding plant and animal groups that no one thought survived,” said Peter Wilf, professor of geosciences at Penn State and associate in the Earth and Environmental Systems Institute. “We went into this study expecting that Patagonia was a refuge, and instead we found a complex story of extinction and rebound.”

Researchers from Penn State; the Museo Paleontologico Egidio Feruglio (MEF), Chubut, Argentina; Universidad Nacional del Comahue INIBIOMA, Rio Negro, Argentina; and Cornell University had been collecting the fossils for years from the two sites, in what is now Chubut province. Unlike North America, where the Cretaceous-Paleogene (K-Pg) boundary is well known from many sites in the western United States, the fossil record from this period is fragmented across the Southern Hemisphere, a result of rapidly changing ancient environments.

“Most of the Cretaceous-Paleogene boundary interval known from the Southern Hemisphere is marine,” said Ari Iglesias, a researcher at Universidad Nacional del Comahue INIBIOMA. “We were interested in obtaining the continental record, what happened on land. So, in this study we tried to get as close to the K-Pg boundary as possible, and we reached it in a small area in Chubut province. There we found floras right before the K-Pg boundary, or Maastrichtian floras, and right after the K-Pg boundary, so Danian age floras.”

The assemblages that the team obtained constitute the most complete collection of late Cretaceous and early Paleogene fossil floras in the Southern Hemisphere, added Iglesias.

The researchers studied the assemblages for survivor pairs — plants that grew in both the Cretaceous and Paleogene periods — and found few species-level matches. They then compared their findings to previous pollen and insect herbivory studies from the same area and to North American fossil records. Their study, which is the first of its kind in the Southern Hemisphere, appears in the journal Paleobiology.

“The 92% extinction estimate we get when we consider fossil leaf species across the K-Pg boundary should be taken as a maximum” Stiles said. “We were surprised to find such high extinction levels compared with the 60% extinction rate seen in North America. Nonetheless, we observed a sharp drop in plant species diversity and a high species-level extinction.”

Ecosystem recovery likely took millions of years, added Stiles, which is a small fraction of Earth’s nearly 4.5-billion-year history.

Stiles also led a novel morphospace analysis to identify changes in leaf shape from the Cretaceous to the Paleogene, as such changes could provide clues to the kinds of environmental and climatic occurrences that took place across the boundary interval. She studied each leaf fossil for nearly 50 features, including shape, size and venation patterns.

The analysis showed a higher diversity of leaf forms in the Paleogene, which surprised the researchers given the high species-level extinction and drop in number of species at the end of the Cretaceous. They also found an increase in the proportion of leaf shapes typically found in cooler environments, which suggests that climatic cooling occurred after the end-Cretaceous extinction event.

The researchers’ findings, combined with those of previous studies, suggest that despite the high species-level extinction at the end of the Cretaceous, South American plant families largely survived and grew more diverse during the Paleogene. Among the survivors were the laurel family, which today includes plants such as bay leaves and avocados, and the rose family, which includes fruit like raspberries and strawberries.

“Plants are often overlooked in these big events in geologic history,” Stiles said. “But really, because plants are the primary producers on terrestrial landscapes and sustain all other life forms on Earth, we should be paying closer attention to the plant fossil record. It can tell us how the landscape changed and how those changes affected different groups of organisms.”

The Geological Society of America, Mid-American Paleontological Society, National Science Foundation and Penn State, through a Charles E. Knopf, Sr. Memorial Scholarship and the Paul D. Krynine Memorial Fund, supported this research.

Reference:
Elena Stiles, Peter Wilf, Ari Iglesias, María A. Gandolfo, N. Rubén Cúneo. Cretaceous–Paleogene plant extinction and recovery in Patagonia. Paleobiology, 2020; 46 (4): 445 DOI: 10.1017/pab.2020.45

Note: The above post is reprinted from materials provided by Penn State. Original written by Francisco Tutella.

When dinosaurs disappeared, forests thrived

Researcher overlooking one of the two field sites for the study, the Frenchman Valley in Chambery Coulee Saskatchewan in July 2017. Credit: McGill University

It’s known that the primary cause of the mass extinction of dinosaurs, about 66 million years ago, was a large asteroid impact. But the exact mechanisms that linked the impact to mass extinction remain unclear, though climactic changes are thought to have played a part.

To understand how the mass extinction and associated climate changes affected specific ecosystems, a team of McGill scientists has analyzed the microscopic remains of plants from this period, found in the sediment of rivers in southern Saskatchewan. In a recent article in Palaeogeography, Palaeoclimatology, Palaeoecology they show that in this area, local plant communities and ecosystems experienced a long-term shift towards fewer aquatic plants and an increase in terrestrial plants, including trees such as birches and elms. The researchers speculate that this increase was due to the extinction of large plant-eating dinosaurs. They also found, unexpectedly, that changes in rainfall patterns during the extinction event were relatively minor and short-lived.

“This could be important as we look to the future of global warming, where many scientists have predicted that changes in precipitation could have big impacts on humans and ecosystems,” says Peter Douglas from McGill’s Department of Earth and Planetary Scientists and senior author on the paper. “At other times of major climate change in Earth’s history we typically do see evidence for such changes. The absence of such a signal during the most recent mass extinction event is intriguing.”

Douglas adds, “Surprisingly, scientists know more about what happened in the oceans at the end-Cretaceous extinction than on land. By clarifying the environmental changes occurring during this period, we narrowed down the factors that are likely to have caused the disappearance of dinosaurs. The research also provides an important analogue for environmental changes humans are causing to the planet, and the potential for future mass extinction.”

Reference:
Robert D. Bourque, Peter M.J. Douglas, Hans C.E. Larsson. Changes in terrestrial ecosystems across the Cretaceous-Paleogene boundary in western Canada inferred from plant wax lipid distributions and isotopic measurements. Palaeogeography, Palaeoclimatology, Palaeoecology, 2020; 110081 DOI: 10.1016/j.palaeo.2020.110081

Note: The above post is reprinted from materials provided by McGill University.

The ‘crazy beast’ that lived among the dinosaurs

2D Life reconstruction Atuchin. Credit: © Andrey Atuchin

New research published today in the Journal of Vertebrate Paleontology describes a bizarre 66 million-year-old mammal that provides profound new insights into the evolutionary history of mammals from the southern supercontinent Gondwana — recognized today as Africa, South America, Australia, Antarctica, the Indian subcontinent, and the Arabian Peninsula.

Named Adalatherium, which, translated from the Malagasy and Greek languages means “crazy beast,” it is described based on a nearly complete, exquisitely preserved skeleton, the most complete for any mammal yet discovered in the southern hemisphere prior to the extinction of the dinosaurs.

The research, carried out over 20 years, demonstrates that Adalatherium was a “giant” relative to the mostly shrew- or mouse-sized mammals that lived during the Cretaceous period.

Its “bizarre” features include more trunk vertebrae than most other mammals, muscular hind limbs that were placed in a more sprawling position (similar to modern crocodiles) coupled with brawny sprinting front legs that were tucked underneath the body (as seen in most mammals today), front teeth like a rabbit and back teeth completely unlike those of any other known mammal, living or extinct, and a strange gap in the bones at the top of the snout.

A team of 14 international researchers led by Dr David Krause (Denver Museum of Nature & Science) and Dr Simone Hoffmann (New York Institute of Technology) published the comprehensive description and analysis of this opossum-sized mammal that lived among dinosaurs and massive crocodiles near the end of the Cretaceous period (145¬-66 million years ago) on Madagascar.

The 234-page monographic treatment, consisting of seven separate chapters, is part of the Society of Vertebrate Paleontology (SVP) Memoir Series, a special yearly publication that provides a more in-depth treatment of the most significant vertebrate fossils. Initial announcement of the discovery was made in the journal Nature earlier this year.

Adalatherium, from Madagascar, belongs to an extinct group of mammals known as gondwanatherians, which were first discovered in the 1980s and, until recently, were only represented by a few isolated teeth and jaw fragments. But even those meager remains already indicated that gondwanatherians were very different from other contemporaneous mammals. So many mysteries had surrounded gondwanatherians that it was unclear how they fit into the mammalian family tree.

Now the research team presents the first skeleton for this mysterious group that once roamed much of South America, Africa, Madagascar, the Indian subcontinent, and even Antarctica.

The completeness and excellent preservation of the skeleton of Adalatherium opens new windows into what gondwanatherians looked like and how they lived, but the bizarre features still have the team perplexed.

“Knowing what we know about the skeletal anatomy of all living and extinct mammals, it is difficult to imagine that a mammal like Adalatherium could have evolved; it bends and even breaks a lot of rules,” Krause explains.

Although the life-like reconstruction of Adalatherium is superficially similar to a run-of-the-mill badger, its “normality” is only skin deep. Below the surface, its skeleton is nothing short of outlandish.

As Hoffmann puts it, “Adalatherium is simply odd. Trying to figure out how it moved, for instance, was challenging because its front end is telling us a completely different story than its back end.”

While its muscular hind legs and big claws on the back feet may indicate that Adalatherium was a powerful digger (like badgers), its front legs were less brawny and are more similar to those of living mammals that can run fast.

The limbs of Adalatherium also indicate that its posture was a hybrid between those of living mammals and more ancient relatives. Its forelimbs were tucked underneath the body (as seen in most mammals today) but its hind limbs were more sprawling (as in crocodiles and lizards).

This is not were the strangeness stops.

The teeth of Adalatherium, reconstructed by employing high-resolution micro-computed tomography and extensive digital modeling, are indicative of herbivory but are otherwise beyond bizarre.

Not only did Adalatherium have rabbit- or rodent-like ever-growing front teeth, but the back teeth are completely unlike those of any other known mammal, living or extinct. If just these teeth had been found, the mystery of what this animal was would likely not have been solved! Added to the seeming chaos is a hole in the top of the snout for which there is simply no parallel.

About the size of a Virginia opossum, the 3.1 kg Adalatherium was very large for its day. While not particularly large by today’s standards, it was a giant compared to the mostly shrew- and mouse-sized mammals living in the Cretaceous.

The geological history of Gondwana provides clues as to why Adalatherium is so bizarre.

Adalatherium was found in rocks dated to near the end of the Cretaceous, at roughly 66 million years ago. At this time Madagascar had already been an island separated from Africa for over 150 million years and from the Indian subcontinent for over 20 million years. “Islands are the stuff of weirdness,” says Krause, “and there was therefore ample time for Adalatherium to develop its many extraordinarily peculiar features in isolation.”

“Adalatherium is an important piece in a very large puzzle on early mammalian evolution in the southern hemisphere, one in which most of the other pieces are still missing,” adds Hoffmann.

More than anything, the discovery of Adalatherium underscores how much more remains to be learned from new finds of early mammals in Madagascar and other parts of the southern hemisphere.

Reference:
David W. Krause, Joseph R. Groenke, Simone Hoffmann, Raymond R. Rogers, Lydia J. Rahantarisoa. Introduction to Adalatherium hui (Gondwanatheria, Mammalia) from the Late Cretaceous of Madagascar. Journal of Vertebrate Paleontology, 2020; 40 (sup1): 4 DOI: 10.1080/02724634.2020.1805455

Note: The above post is reprinted from materials provided by Taylor & Francis Group.

New dinosaur showed descendants how to dress to impress

Ubirajara jubatus is named after a Tupi Indian name for 'lord of the spear', in reference to the creature's stiffened, elongate integumentary structures, and jubatus from the Latin meaning 'maned' or 'crested'. Image must be credited Credit: Artwork © Bob Nicholls / Paleocreations.com 2020
Ubirajara jubatus is named after a Tupi Indian name for ‘lord of the spear’, in reference to the creature’s stiffened, elongate integumentary structures, and jubatus from the Latin meaning ‘maned’ or ‘crested’. Image must be credited Credit: Artwork © Bob Nicholls / Paleocreations.com 2020

Scientists have found the most elaborately dressed-to-impress dinosaur ever described and say it sheds new light on how birds such as peacocks inherited their ability to show off.

The new species, Ubirajara jubatus, was chicken-sized with a mane of long fur down its back and stiff ribbons projecting out and back from its shoulders, features never before seen in the fossil record.

It is thought its flamboyant features were used to dazzle mates or intimidate foe.

An international team of scientists co-led by Professor David Martill and researcher Robert Smyth, both at the University of Portsmouth, and Professor Dino Frey at the State Museum of Natural History, Karlsruhe, Germany discovered the new species while examining fossils in Karlsruhe´s collection.

The study is published in the scientific journal Cretaceous Research.

Professor Martill said: “What is especially unusual about the beast is the presence of two very long, probably stiff ribbons on either side of its shoulders that were probably used for display, for mate attraction, inter-male rivalry or to frighten off foe.

“We cannot prove that the specimen is a male, but given the disparity between male and female birds, it appears likely the specimen was a male, and young, too, which is surprising given most complex display abilities are reserved for mature adult males.

“Given its flamboyance, we can imagine that the dinosaur may have indulged in elaborate dancing to show off its display structures.”

The ribbons are not scales or fur, nor are they feathers in the modern sense. They appear to be structures unique to this animal.

Mr Smyth said: “These are such extravagant features for such a small animal and not at all what we would predict if we only had the skeleton preserved. Why adorn yourself in a way that makes you more obvious to both your prey and to potential predators?

“The truth is that for many animals, evolutionary success is about more than just surviving, you also have to look good if you want to pass your genes on to the next generation.

“Modern birds are famed for their elaborate plumage and displays that are used to attract mates — the peacock’s tail and male birds-of-paradise are textbook examples of this. Ubirajara shows us that this tendency to show off is not a uniquely avian characteristic, but something that birds inherited from their dinosaur ancestors.”

Ubirajara jubatus lived about 110 million years ago, during the Aptian stage of the Cretaceous period, and is closely related to the European Jurassic dinosaur Compsognathus.

A section of the long, thick mane running down the animal´s back is preserved nearly intact. The arms were also covered in fur-like filaments down to the hands.

The mane is thought to have been controlled by muscles allowing it to be raised, in a similar way a dog raises its hackles or a porcupine raises its spines when threatened.

Ubirajara could lower its mane close to the skin when not in a display mode allowing the creature to move fast without getting tangled in vegetation.

Professor Martill said: “Any creature with movable hair or feathers as a body coverage has a great advantage in streamlining the body contour for faster hunts or escapes but also to capture or release heat.”

The mane isn’t the only extraordinary feature.

The researchers describe as ‘enigmatic’ the creature’s long, flat, stiff shoulder ribbons of keratin, each with a small sharp ridge running along the middle. These ribbons were positioned to not impede freedom of movement in its arms and legs, so wouldn’t have limited the animal’s ability to hunt, preen and send signals.

Mr Smyth argues the elaborate plumage of Ubirajara might have improved its chances of survival.

He said: “We know lots of dinosaurs had bony crests, spines and frills that were probably used for display but we don’t see these very often in living birds. In birds, crests are made of feathers.

“This little dinosaur provides some insight into why this might be the case.

“Bone requires a lot of energy for a body to grow and maintain, it’s also heavy and can cause serious injury if broken.

“Keratin — the material that makes up hair, feathers and scales — is a much better display alternative for a small animal like this one. Keratin is less costly for a body to produce, it’s also lightweight, flexible and can be regularly replaced if damaged.

“Ubirajara is the most primitive known dinosaur to possess integumentary display structures. It represents a revolution in dinosaur communication, the effects of which we can still see today in living birds.”

Professor Frey excavated the specimen from the two slabs of stone in which it lay and, using x-ray, found previously hidden skeletal elements and soft tissue, allowing the researchers to build a clear picture of its features.

Ubirajara jubatus is the first non-avian dinosaur to be described from Brazil’s Crato Formation, a shallow inland sea laid down about 110 million years ago. It is also the first non-avian dinosaur found on the ancient supercontinent of Gondwana with preserved skin.

Another of the researchers on the team, Hector Rivera Sylva, from Museo del Desierto, Mexico, said as well as the discovery being a watershed in this field, it was also important for the Americas.

He said: “The Ubirajara jubatus is not only important because of the integumentary structures present for the first time in a non-avian dinosaur, completely changing the way of seeing the behaviour of certain dinosaurs. Rather, the scientific value transcends, forming a watershed, since it is the first evidence for this group in Latin America, as well as one of the few reported for the subcontinent of Gondwana, expanding the knowledge about non-avian feathered dinosaurs for America, whose evidence is very scarce.”

Reference:
Robert S.H. Smyth, David M. Martill, Eberhard Frey, Héctor E. Rivera-Sylva, Norbert Lenz. A maned theropod dinosaur from Gondwana with elaborate integumentary structures. Cretaceous Research, 2020; 104686 DOI: 10.1016/j.cretres.2020.104686

Note: The above post is reprinted from materials provided by University of Portsmouth.

World’s earliest python identified from 47 million-year-old fossil remains

The head and body of the Messel python are almost completely preserved. Credit: Hessian State Museum Darmstadt

Together with his colleague Hussam Zaher of the University in São Paulo, Senckenberg scientist Krister Smith described the world’s oldest known fossils of a python. The almost completely preserved snakes with a length around one meter were discovered in the UNESCO World Heritage Site “Messel Pit” and are about 47 million years old. The new python species, Messelopython freyi, was named in honor of paleontologist Eberhard “Dino” Frey of the State Museum of Natural History in Karlsruhe. The study was published today in the scientific journal Biology Letters.

Reaching a length of more than six meters, pythons are among the world’s largest snakes. Today, various species of these constrictors are found primarily in Africa, Southern and Southeast Asia, and Australia. “The geographic origin of pythons is still not clear. The discovery of a new python species in the Messel Pit is therefore a major leap forward in understanding these snakes’ evolutionary history,” explains Dr. Krister Smith of the Senckenberg Research Institute and Natural History Museum in Frankfurt.

The new python species Messelopython freyi described by Smith and his Brazilian colleague, Dr. Hussam Zaher, is the oldest known fossil record of a python anywhere in the world. “According to our findings, these snakes already occurred in Europe at the time of the Eocene, over 47 million years ago. Our analyses trace their evolutionary history to Europe!” adds Zaher.

However, the large constrictor snakes subsequently disappeared from the European continent for quite some time. Fossils of this snake family did not appear again until the Miocene—between 23 and 5 million years ago. “As the global climate began to cool again after the Miocene, the pythons once again disappeared from Europe,” says Smith.

Contrary to the primeval python from Messel, modern pythons live in complete spatial separation from their anatomically very similar relatives, the boas. “However, in Messel, both Messelopython freyi as well as primitive boas such as Eoconstrictor fischeri lived together in the same ecosystem—we therefore have to revisit the thesis that these two groups of snakes competed with each other, making them unable to share the same habitats,” explains Smith.

The snake’s scientific name is a combination of the locality where it was found and the snake’s family. The specific epithet of the newly discovered fossil is owed to Prof. Dr. Eberhard Frey of the State Museum of Natural History Karlsruhe. “Eberhard Frey bears the nickname “Dino’ for a good reason—he is world-renowned for his exacting studies of fossil reptiles. By naming a new species after him, we wanted to honor his accomplishments in the field of paleontology,” adds Smith to explain the fossil’s naming.

Reference:
Hussam Zaher et al. Pythons in the Eocene of Europe reveal a much older divergence of the group in sympatry with boas, Biology Letters (2020). DOI: 10.1098/rsbl.2020.0735

Note: The above post is reprinted from materials provided by Senckenberg Research Institute and Natural History Museum.

Primitive fish fossils reveal developmental origins of teeth

Part of a jawbone of the 422-million-year-old fossil bony fish Lophosteus, visualized with a high-resolution X-ray technique. On the right, the surface of the jawbone is shown in gray. In the middle, exposed teeth are highlighted in gold and dermal odontodes in shades of purple, pink and red. On the left, the bone itself is made transparent, revealing internal blood vessels and pulp cavities, shown in blue and green, as well as the embedded teeth and dermal odontodes. Credit: Chen et al. (CC BY 4.0)

Teeth and hard structures called dermal odontodes are evolutionarily related, arising from the same developmental system, a new study published today in eLife shows.

These findings in ancient fish fossils contradict established claims about the difference between the two structures based on modern sharks, and provide potential new insights into the origins and development of teeth.

Odontodes are hard structures made of dentine, the main substance in ivory, and are found on the outside surfaces of animals with backbones (vertebrates). Teeth are an example of odontodes but some animals also have them on their skin, such as the tooth-like ‘scales’ of sharks. These are known as dermal odontodes.

“Teeth and dermal odontodes are thought to have evolved separately because they seem to develop in different ways,” says lead author Donglei Chen, a researcher at the Department of Organismal Biology, Uppsala University, Sweden. “However, most of what we know is limited to modern sharks in which the difference between these structures has become very distinct. To understand the relationship between the two more clearly, we needed to turn to the fossil record.”

The team looked at fossils of one of the earliest bony fishes called Lophosteus which lived more than 400 million years ago. They chose this fish because it represents an early stage of tooth evolution, bringing them closer to the time when teeth and dermal odontodes could have separated in the hopes that any developmental similarities between the two would be more obvious.

The researchers used high-resolution X-ray imaging to look at the three-dimensional structure of odontodes in Lophosteus at different stages of development. They found that the appearance of odontodes were similar at the early stages of development but would change depending on whether they grew into the mouth or the face. This suggests there were different chemical signals in each area directing their development. At the later stages, some dermal odontodes would move from the face to the mouth and begin to look like teeth.

These findings suggest that both types of odontodes are able to respond to the same signals controlling each other’s development and are made by the same developmental system — not separate systems as previously thought.

“In addition to casting light on the early evolution of our own teeth, our results point to a previously unrecognised evolutionary-developmental relationship between teeth and dermal odontodes,” says senior author Per Ahlberg, PhD, Professor at the Department of Organismal Biology, Uppsala University. “This has potential implications for understanding the signalling that occurs during development and could inspire new lines of developmental research in other organisms.”

Reference:
Donglei Chen, Henning Blom, Sophie Sanchez, Paul Tafforeau, Tiiu Märss, Per E Ahlberg. The developmental relationship between teeth and dermal odontodes in the most primitive bony fish Lophosteus. eLife, 2020; 9 DOI: 10.7554/eLife.60985

Note: The above post is reprinted from materials provided by eLife.

Research reveals unexpected insights into early dinosaur’s brain, eating habits and agility

Braincase and endocast of Thecodontosaurus antiquus. From CT scans of the braincase fossil, 3-D models of the braincase and the endocast were generated and studied. Credit: Created by Antonio Ballell with BioRender, Thecodontosaurus silhouette from PhyloPic.org.

A pioneering reconstruction of the brain belonging to one of the earliest dinosaurs to roam the Earth has shed new light on its possible diet and ability to move fast.

Research, led by the University of Bristol, used advanced imaging and 3-D modelling techniques to digitally rebuild the brain of Thecodontosaurus, better known as the Bristol dinosaur due to its origins in the UK city. The palaeontologists found Thecodontosaurus may have eaten meat, unlike its giant long-necked later relatives including Diplodocus and Brontosaurus, which only fed on plants.

Antonio Ballell, lead author of the study published today in Zoological Journal of the Linnean Society, said: “Our analysis of Thecodontosaurus’ brain uncovered many fascinating features, some of which were quite surprising. Whereas its later relatives moved around ponderously on all fours, our findings suggest this species may have walked on two legs and been occasionally carnivorous.”

Thecodontosaurus lived in the late Triassic age some 205 million years ago and was the size of a large dog. Although its fossils were discovered in the 1800s, many of which are carefully preserved at the University of Bristol, scientists have only very recently been able to deploy imaging software to extract new information without destroying them. 3-D models were generated from CT scans by digitally extracting the bone from the rock, identifying anatomical details about its brain and inner ear previously unseen in the fossil.

“Even though the actual brain is long gone, the software allows us to recreate brain and inner ear shape via the dimensions of the cavities left behind. The braincase of Thecodontosaurus is beautifully preserved so we compared it to other dinosaurs, identifying common features and some that are specific to Thecodontosaurus,” Antonio said. “Its brain cast even showed the detail of the floccular lobes, located at the back of the brain, which are important for balance. Their large size indicate it was bipedal. This structure is also associated with the control of balance and eye and neck movements, suggesting Thecodontosaurus was relatively agile and could keep a stable gaze while moving fast.”

Although Thecodontosaurus is known for being relatively small and agile, its diet has been debated.

Antonio, a Ph.D. student at the University of Bristol’s School of Earth Sciences, said: “Our analysis showed parts of the brain associated with keeping the head stable and eyes and gaze steady during movement were well-developed. This could also mean Thecodontosaurus could occasionally catch prey, although its tooth morphology suggests plants were the main component of its diet. It’s possible it adopted omnivorous habits.”

The researchers were also able to reconstruct the inner ears, allowing them estimate how well it could hear compared to other dinosaurs. Its hearing frequency was relatively high, pointing towards some sort of social complexity—an ability to recognize varied squeaks and honks from different animals.

Professor Mike Benton, study co-author, said: “It’s great to see how new technologies are allowing us to find out even more about how this little dinosaur lived more than 200 million years ago.

“We began working on Thecodontosaurus in 1990, and it is the emblem of the Bristol Dinosaur Project, an educational outreach scheme where students go to speak about science in local schools. We’re very fortunate to have so many well-preserved fossils of such an important dinosaur here in Bristol. This has helped us understand many aspects of the biology of Thecodontosaurus, but there are still many questions about this species yet to be explored.”

Reference:
Antonio Ballell et al, The braincase, brain and palaeobiology of the basal sauropodomorph dinosaur Thecodontosaurus antiquus, Zoological Journal of the Linnean Society (2020). DOI: 10.1093/zoolinnean/zlaa157

Note: The above post is reprinted from materials provided by University of Bristol.

First-known fossil iguana burrow found in the Bahamas

Illustration shows a cross section of the prehistoric iguana burrow, and how the surrounding landscape may have looked during the Late Pleistocene Epoch. Credit: Anthony Martin.

The discovery of the first known fossil iguana nesting burrow, on an outer island of the Bahamas, fills in a gap of scientific knowledge for a prehistoric behavior of an iconic lizard. PLOS ONE published the finding by scientists from Emory University, which also uncovers new clues to the geologic and natural history of the Bahamas.

The fossilized burrow dates back to the Late Pleistocene Epoch, about 115,000 years ago, and is located on the island of San Salvador — best known as the likely spot where Christopher Columbus made his first landfall in his 1492 voyage.

“San Salvador is one of the outer-most islands in the Bahamas chain and really isolated,” says Anthony Martin, a professor in Emory’s Department of Environmental Sciences and senior author of the PLOS ONE paper. “It’s a mystery how and when the modern-day San Salvadoran rock iguanas arrived there. Today, they are among the rarest lizards in the world, with only a few hundred of them left.”

Martin’s specialty is ichnology — the study of traces of life, such as tracks, nests and burrows. He documents modern-day traces to help him identify trace fossils from the deep past to learn about prehistoric animal behaviors.

The current discovery was made during a class field trip to San Salvador as part of the course “Modern and Ancient Tropical Environments,” co-taught by Martin and Melissa Hage, an assistant professor of environmental science at Emory’s Oxford College and a co-author of the paper. Co-authors also include two former undergraduates from the class: Dottie Stearns (now in medical school at the University of Colorado) and Meredith Whitten (who now works in fisheries management for the state of North Carolina).

“No matter how much you read about things in a textbook, a lot of concepts in geology just don’t click until you see them in real life,” Hage says. “It sparks a lot of excitement in students when they experience the process of scientific discovery in the field.”

“Students get to actually see the connections of the past and the present,” Martin adds. “On the north point of San Salvador, for instance, the undulating landscape consists of ancient sand dunes that turned into rock. We can walk across these ancient dunes to look at the rock record and get an idea of how the island changed over time.”

During a stop on the shoreline road on the south end of the island, Martin happened to notice what looked like the trace of a fossil iguana burrow on a limestone outcrop exposed by a roadcut.

The fossil record for iguanas goes back to the Late Cretaceous in South America. Today iguanas are found in tropical areas of Mexico, Central America, South America, the Caribbean and the Bahamas.

Iguanas can grow up to six feet in length, including their tails. Despite their large size, formidable claws and fierce-looking spikes arrayed on their backs, iguanas are mostly herbivores.

The now endangered San Salvador rock iguana, Cyclura riyeli riyeli, and other Cyclura species were plentiful throughout the Bahamas before 1492, when European ships began introducing rats, pigs and other invasive species that feed on the lizards’ eggs.

“One of the cool things about iguanas is that they are survivors,” Martin says. “And one of the main ways that they survive is through burrowing. Digging burrows has helped them survive hurricanes, droughts and other bad things that might be in their environment, like most predators. But burrows are not as helpful when it comes to rats and pigs.”

After further investigation, Martin and his co-authors determined that the trace fossil he noticed on the limestone outcrop was that of a nesting iguana burrow. Ample evidence, including a nearby fossil land-crab burrow discovered by Hage, showed that the outcrop was a former inland sand dune, where iguanas prefer to lay their eggs.

The iguana trace revealed the distinctive pattern of a female creating a nest. “Iguanas have evolved a behavior where a female actually buries herself alive in sand, lays her eggs, and then ‘swims’ out, packing the loose sand behind her as she leaves the burrow to hide the eggs from predators,” Martin says.

This backfilling technique created compaction zones that weathered out over time from the surrounding limestone because they were more durable. “It’s like when you pack sand to build a sandcastle at the beach,” Martin explains. “It’s a similar principle but, in the case of the iguana burrow, it happens underground.”

The lack of burrows from hatchlings digging their way to the surface, however, suggests that the nest failed and that the eggs never produced young.

The researchers were able to date the iguana trace to about 115,000 years ago due to tell-tale red paleosols, or fossilized soils. “The red indicates oxidized iron minerals and there are no native iron minerals in that area,” Martin explains. “But whenever there is a drop in sea level, the Sahara expands in size creating big dust storms. The trade winds take this red dust across the Atlantic and deposit it in the Caribbean.”

The oldest iguana skeletons found on San Salvador only date back less than 12,000 years, in the Holocene Epoch, so the discovery of the iguana trace pushes their presence on the islands back significantly.

Most of the Bahamian islands sit on a relatively shallow platform, making it easy to imagine how iguanas might have migrated there during sea-level lows. San Salvador, however, is a small, isolated island surrounded by deep ocean, setting up the mystery for how the first iguanas arrived there at least 115,000 years ago.

“We’re hoping researchers who study iguana evolution will be inspired by our paper to dig deeper into this question,” Martin says.

The researchers also hope that the paper draws attention to the plight of modern-day San Salvador rock iguanas. “When it comes to species preservation, many people think of panda bears and other cuddly mammals,” Hage says. “Making the connection between how long iguanas have been on the island and how the modern-day San Salvador rock iguanas are endangered may help more people understand why they are worth preserving.”

Additional authors on the paper include Michael Page, a geographer in the Emory Department of Environmental Sciences and the Emory Center for Digital Scholarship; and Arya Basu; a visual information specialist and research scientist in the Emory Center for Digital Scholarship.

Reference:
Anthony J. Martin, Dorothy Stearns, Meredith J. Whitten, Melissa M. Hage, Michael Page, Arya Basu. First known trace fossil of a nesting iguana (Pleistocene), The Bahamas. PLOS ONE, 2020; 15 (12): e0242935 DOI: 10.1371/journal.pone.0242935

Note: The above post is reprinted from materials provided by Emory Health Sciences. Original written by Carol Clark.

Related Articles