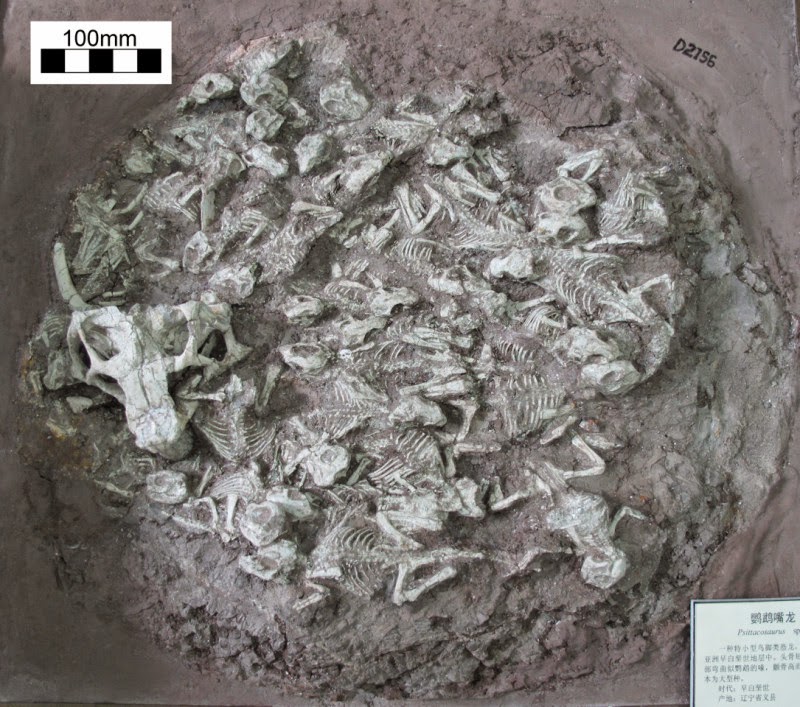
The remains of 25 dinosaurs were found in a single rock slab from northeastern China. Credit: Image courtesy of University of Pennsylvania
Dinosaurs are often depicted as giant, frightening beasts. But every creature is a baby once. A new examination of a rock slab containing fossils of 24 very young dinosaurs and one older individual is suggestive of a group of hatchlings overseen by a caretaker, according to a new study by University of Pennsylvania researchers.
Penn’s Brandon P. Hedrick and Peter Dodson led the work, collaborating with researchers from China’s Dalian Museum of Natural History, where the specimen is held. Hedrick is a doctoral student in the School of Arts & Sciences’ Department of Earth and Environmental Science, where Dodson is a professor of paleontology. Dodson is also professor of anatomy in the School of Veterinary Medicine’s Department of Animal Biology. Gomaa I. Omar of Penn’s Earth and Environnmental Science was a coauthor of the paper, which appears in the journal Cretaceous Research.
Amateur paleontologists came upon the fossils, which are about 120 million years old, in the Lujiatun beds of the Yixian Formation in northeastern China’s Liaoning Province. Though the entire specimen is only about two feet across, it contains fossils from 25 creatures, all of the species Psittacosaurus lujiatunensis. Psittacosaurs were plant eaters and are among the most abundant dinosaurs yet discovered.
The specimen had previously been described only briefly, in a one-page paper in 2004. The people who found and extracted the fossils did not record their exact original location, which hampers the investigation to some degree. But Dodson and Hedrick felt there was much more to say about the specimen.
“I saw a photo of it and instantly knew I wanted to explore it in more depth,” Hedrick said.
To analyze the material in which the animals were preserved, the researchers examined thin slivers of rock under the microscope and samples of ground-up rock using a technique called X-ray diffraction, which relies on the fact that different kinds of minerals bend light in unique ways. Both analyses suggested the rock was composed of volcanic material, an indication that the animals were caught in flowing material from an eruption.
The fossils’ orientation supported this idea.
“If they were captured in a flow, the long axis — their spines — would be oriented in the same direction,” Hedrick said. “That was what we found. They were likely trapped by a flow, though we can’t say exactly what kind of flow.”
Because there was no evidence of heat damage to the bones, the researchers believe the flow was likely a lahar, a slurry of water, mud, rock and other debris associated with volcanic eruptions.
The 24 younger animals appeared to be quite similar in size. Though the team considered whether they might have been embryos, still in their eggs, various observations suggest they had already hatched. First, there was no evidence of eggshell material. Also, other paleontologists have identified even smaller individual psittacosaurs. And finally, Hedrick said, “the ends of their bones were well developed, which indicates they were capable of moving around.”
The larger skull was firmly embedded in the same layer of rock as the 24 smaller animals. Two of the younger animals were in fact intertwined with the skull, signs that the animals were closely associated at the time of their death.
The skull’s size, about 4.5 inches long, indicated that the animal was estimated to be between 4 and 5 years old. Earlier findings suggested that P. lujiatunensis did not reproduce until 8 or 9 years old, so this creature was probably not the parent of the younger dinosaurs.
Given the close association of the young P. lujiatunensis with the older individual, however, Dodson, Hedrick and colleagues believe this specimen may offer evidence of post-hatchling cooperation, a behavior exhibited by some species of modern-day birds. The older juvenile may well have been a big brother or sister helping care for its younger siblings.
The researchers emphasize that they can’t definitively call this assemblage of fossils a nest, as some earlier analyses have.
“It certainly seems like it might be a nest, but we weren’t able to satisfy the intense criteria to say definitively that it is,” Hedrick said. “It’s just as important to point out what we don’t know for sure as it is to say what we’re certain of.”
As a next step, Dodson and Hedrick are examining the microstructure of the bones of the smaller animals to establish whether they were all at the same stage of development, which would lend support to the idea of this being one clutch of animals.
Additional coauthors on the paper included Gao Chunling, Zhang Fengjiao and Shen Caizhi of the Dalian Museum. The study was supported by the University of Pennsylvania Paleobiology Stipend and the National Science Foundation.
Note : The above story is based on materials provided by University of Pennsylvania.
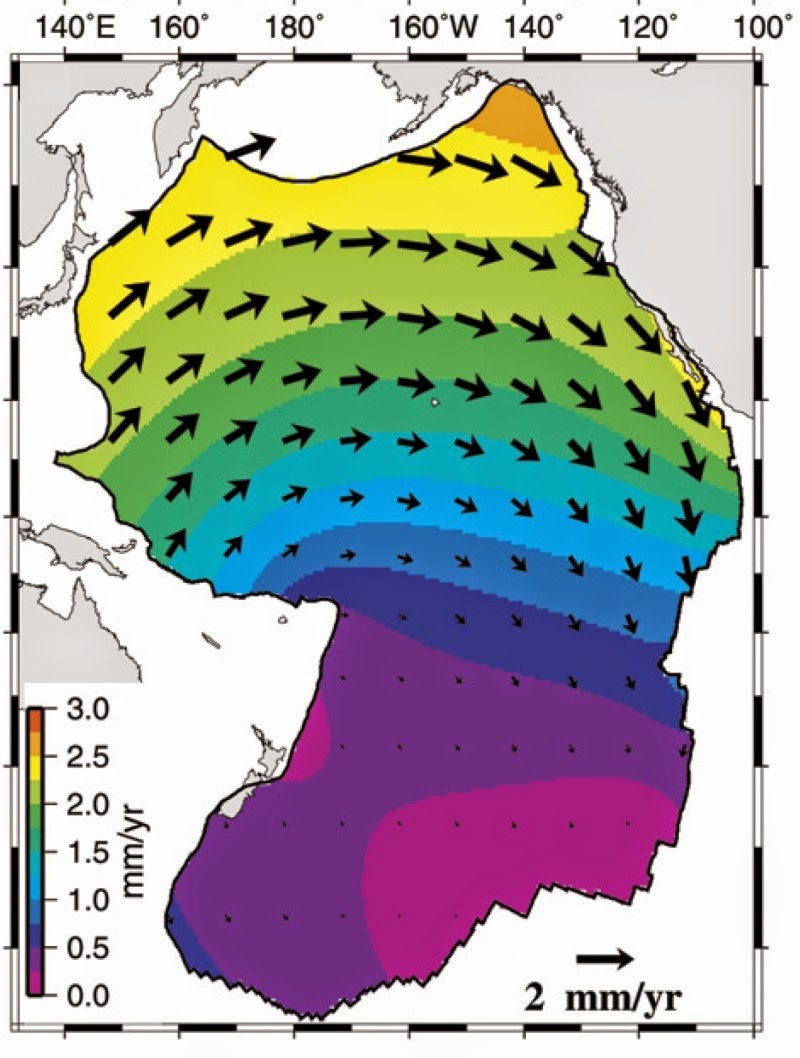
A map produced by scientists at the University of Nevada, Reno, and Rice University shows predicted velocities for sectors of the Pacific tectonic plate relative to points near the Pacific-Antarctic ridge, which lies in the South Pacific ocean. The researchers show the Pacific plate is contracting as younger sections of the lithosphere cool. Credit: Corné Kreemer and Richard Gordon
The tectonic plate that dominates the Pacific “Ring of Fire” is not as rigid as many scientists assume, according to researchers at Rice University and the University of Nevada.
Rice geophysicist Richard Gordon and his colleague, Corné Kreemer, an associate professor at the University of Nevada, Reno, have determined that cooling of the lithosphere — the outermost layer of Earth — makes some sections of the Pacific plate contract horizontally at faster rates than others and cause the plate to deform.
Gordon said the effect detailed this month in Geology is most pronounced in the youngest parts of the lithosphere — about 2 million years old or less — that make up some the Pacific Ocean’s floor. They predict the rate of contraction to be 10 times faster than older parts of the plate that were created about 20 million years ago and 80 times faster than very old parts of the plate that were created about 160 million years ago.
The tectonic plates that cover Earth’s surface, including both land and seafloor, are in constant motion; they imperceptibly surf the viscous mantle below. Over time, the plates scrape against and collide into each other, forming mountains, trenches and other geological features.
On the local scale, these movements cover only inches per year and are hard to see. The same goes for deformations of the type described in the new paper, but when summed over an area the size of the Pacific plate, they become statistically significant, Gordon said.
The new calculations showed the Pacific plate is pulling away from the North American plate a little more — approximately 2 millimeters a year — than the rigid-plate theory would account for, he said. Overall, the plate is moving northwest about 50 millimeters a year.
“The central assumption in plate tectonics is that the plates are rigid, but the studies that my colleagues and I have been doing for the past few decades show that this central assumption is merely an approximation — that is, the plates are not rigid,” Gordon said. “Our latest contribution is to specify or predict the nature and rate of deformation over the entire Pacific plate.”
The researchers already suspected cooling had a role from their observation that the 25 large and small plates that make up Earth’s shell do not fit together as well as the “rigid model” assumption would have it. They also knew that lithosphere as young as 2 million years was more malleable than hardened lithosphere as old as 170 million years.
“We first showed five years ago that the rate of horizontal contraction is inversely proportional to the age of the seafloor,” he said. “So it’s in the youngest lithosphere (toward the east side of the Pacific plate) where you get the biggest effects.”
The researchers saw hints of deformation in a metric called plate circuit closure, which describes the relative motions where at least three plates meet. If the plates were rigid, their angular velocities at the triple junction would have a sum of zero. But where the Pacific, Nazca and Cocos plates meet west of the Galápagos Islands, the nonclosure velocity is 14 millimeters a year, enough to suggest that all three plates are deforming.
“When we did our first global model in 1990, we said to ourselves that maybe when we get new data, this issue will go away,” Gordon said. “But when we updated our model a few years ago, all the places that didn’t have plate circuit closure 20 years ago still didn’t have it.”
There had to be a reason, and it began to become clear when Gordon and his colleagues looked beneath the seafloor. “It’s long been understood that the ocean floor increases in depth with age due to cooling and thermal contraction. But if something cools, it doesn’t just cool in one direction. It’s going to be at least approximately isotropic. It should shrink the same in all directions, not just vertically,” he said.
A previous study by Gordon and former Rice graduate student Ravi Kumar calculated the effect of thermal contraction on vertical columns of oceanic lithosphere and determined its impact on the horizontal plane, but viewing the plate as a whole demanded a different approach. “We thought about the vertically integrated properties of the lithosphere, but once we did that, we realized Earth’s surface is still a two-dimensional problem,” he said.
For the new study, Gordon and Kreemer started by determining how much the contractions would, on average, strain the horizontal surface. They divided the Pacific plate into a grid and calculated the strain on each of the nearly 198,000 squares based on their age, as determined by the seafloor age model published by the National Geophysical Data Center.
“That we could calculate on a laptop,” Gordon said. “If we tried to do it in three dimensions, it would take a high-powered computer cluster.”
The surface calculations were enough to show likely strain fields across the Pacific plate that, when summed, accounted for the deformation. As further proof, the distribution of recent earthquakes in the Pacific plate, which also relieve the strain, showed a greater number occurring in the plate’s younger lithosphere. “In the Earth, those strains are either accommodated by elastic deformation or by little earthquakes that adjust it,” he said.
“The central assumption of plate tectonics assumes the plates are rigid, and this is what we make predictions from,” said Gordon, who was recently honored by the American Geophysical Union for writing two papers about plate movements that are among the top 40 papers ever to appear in one of the organization’s top journals. “Up until now, it’s worked really well.”
“The big picture is that we now have, subject to experimental and observational tests, the first realistic, quantitative estimate of how the biggest oceanic plate departs from that rigid-plate assumption.”
The National Science Foundation supported the research. Gordon is the Keck Professor of Geophysics and chairman of the Earth Science Department at Rice.
Note : The above story is based on materials provided by Rice University.
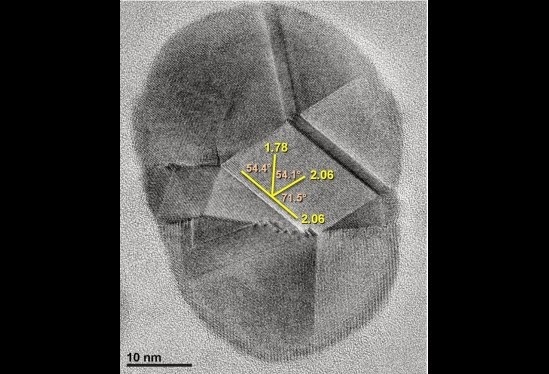
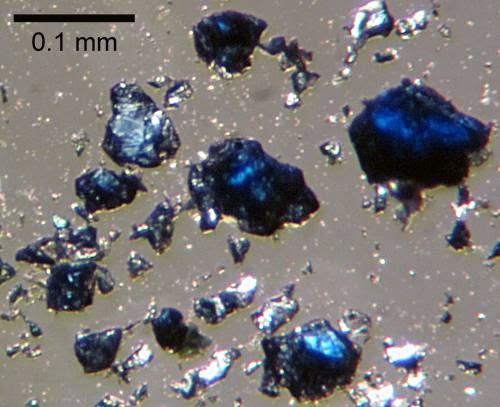
A transmission electron microscopy image of an unusually large, multiply twinned n-diamond or flawed cubic nanodiamond with 20 conjoined crystals from Kangerlussuaq, Greenland. Credit: Image courtesy of University of California – Santa Barbara
Most of North America’s megafauna — mastodons, short-faced bears, giant ground sloths, saber-toothed cats and American camels and horses — disappeared close to 13,000 years ago at the end of the Pleistocene period. The cause of this massive extinction has long been debated by scientists who, until recently, could only speculate as to why.
A group of scientists, including UC Santa Barbara’s James Kennett, professor emeritus in the Department of Earth Science, posited that a comet collision with Earth played a major role in the extinction. Their hypothesis suggests that a cosmic-impact event precipitated the Younger Dryas period of global cooling close to 12,800 years ago. This cosmic impact caused abrupt environmental stress and degradation that contributed to the extinction of most large animal species then inhabiting the Americas. According to Kennett, the catastrophic impact and the subsequent climate change also led to the disappearance of the prehistoric Clovis culture, known for its big game hunting, and to human population decline.
In a new study published this week in the Journal of Geology, Kennett and an international group of scientists have focused on the character and distribution of nanodiamonds, one type of material produced during such an extraterrestrial collision. The researchers found an abundance of these tiny diamonds distributed over 50 million square kilometers across the Northern Hemisphere at the Younger Dryas boundary (YDB). This thin, carbon-rich layer is often visible as a thin black line a few meters below the surface.
Kennett and investigators from 21 universities in six countries investigated nanodiamonds at 32 sites in 11 countries across North America, Europe and the Middle East. Two of the sites are just across the Santa Barbara Channel from UCSB: one at Arlington Canyon on Santa Rosa Island, the other at Daisy Cave on San Miguel Island.
“We conclusively have identified a thin layer over three continents, particularly in North America and Western Europe, that contain a rich assemblage of nanodiamonds, the production of which can be explained only by cosmic impact,” Kennett said. “We have also found YDB glassy and metallic materials formed at temperatures in excess of 2200 degrees Celsius, which could not have resulted from wildfires, volcanism or meteoritic flux, but only from cosmic impact.”
The team found that the YDB layer also contained larger than normal amounts of cosmic impact spherules, high-temperature melt-glass, grapelike soot clusters, charcoal, carbon spherules, osmium, platinum and other materials. But in this paper the researchers focused their multi-analytical approach exclusively on nanodiamonds, which were found in several forms, including cubic (the form of diamonds used in jewelry) and hexagonal crystals.
“Different types of diamonds are found in the YDB assemblages because they are produced as a result of large variations in temperature, pressure and oxygen levels associated with the chaos of an impact,” Kennett explained. “These are exotic conditions that came together to produce the diamonds from terrestrial carbon; the diamonds did not arrive with the incoming meteorite or comet.”
Based on multiple analytical procedures, the researchers determined that the majority of the materials in the YDB samples are nanodiamonds and not some other kinds of minerals. The analysis showed that the nanodiamonds consistently occur in the YDB layer over broad areas.
“There is no known limit to the YDB strewnfield which currently covers more than 10 percent of the planet, indicating that the YDB event was a major cosmic impact,” Kennett said. “The nanodiamond datum recognized in this study gives scientists a snapshot of a moment in time called an isochron.”
To date, scientists know of only two layers in which more than one identification of nanodiamonds has been found: the YDB 12,800 years ago and the well-known Cretaceous-Tertiary boundary 65 million years ago, which is marked by the mass extinction of the dinosaurs, ammonites and many other groups.
“The evidence we present settles the debate about the existence of abundant YDB nanodiamonds,” Kennett said. “Our hypothesis challenges some existing paradigms within several disciplines, including impact dynamics, archaeology, paleontology and paleoceanography/paleoclimatology, all affected by this relatively recent cosmic impact.”
Note : The above story is based on materials provided by University of California – Santa Barbara. The original article was written by Julie Cohen.
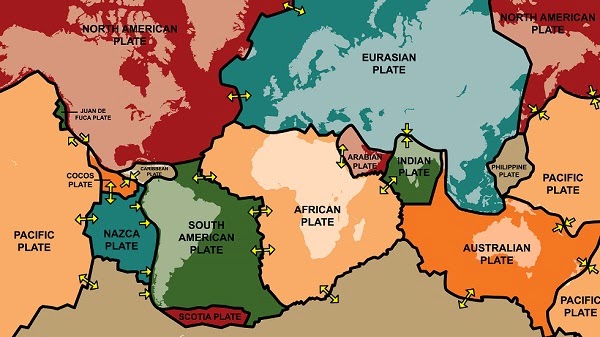
The boundaries of the tectonic plates in the Earths crust, responsible for earthquakes and volcanoes. Credit: iStock
A group of geophysicists is testing the hypothesis that the rate of “supercontinent assembly”—or tectonic plate movement—changes over time.
Study co-author Professor Sergei Pisarevskiy says plate tectonics is the study of the horizontal movement of tectonic plates over the Earth’s surface.
“This is not uniform movement,” he says.
“Sometimes there are periods where there was very quick movement all together globally, and sometimes very slow movements.
“We try to analyse that and to populate the mean angular velocity of the average plate movements on the surface of the earth.”
He has come to the tentative conclusion that the average rate of tectonic plate movement does change.
“Right now for example it’s slower than it was half a billion years ago—but approximately the same as it was one and a half billion years ago,” he says.
“But there are many problems to be resolved before the final answer.
“It’s sort of half guessing I would say at this stage.”
He says beside the uneven level of the same analysis in different countries, he and lead author Kent Condie are addressing various other problems.
One is the inconsistent rate at which plates appear to move, both individually and relative to each other.
“For example Africa moved very slowly for the last few hundred million years, on the other hand India as you probably know moved very fast,” he says.
“When you calculate the average movement … of the continents of the earth you cannot just average the movement, the speed of a continent like Africa and some very small block like Madagascar for example.
“They must be weighted, so we normalise the speeds by the area of that particular continental block.”
“When talking about the average speed, we also found some quieter periods, not exactly the periodicity but some maximums and minimums.”
Another problem is the way in which evidence tends to deteriorate over time with more recent “overprints” creating statistical “noise”.
“The older the rocks, the less information you will have,” he says.
“This noise increases—going back in time it’s more difficult to extract this information.”
They are also contending with the phenomena of “passive margins” between plates.
One of these is thought to exist beneath the ocean south of Australia—it shows little or no movement for at least a billion years.
“There are no major tectonisms here or seismicity, it’s just accumulations of sediments mostly,” he says.
More information:
Kent Condie, Sergei A. Pisarevsky, Jun Korenaga, Steve Gardoll, “Is the rate of supercontinent assembly changing with time?”, Precambrian Research, Available online 4 August 2014, ISSN 0301-9268, dx.doi.org/10.1016/j.precamres.2014.07.015
Note : The above story is based on materials provided by Science Network WA
Research published last week in Science suggested that the makeup of Earth’s lower mantle, which makes up the largest part of Earth by volume, is significantly different than previously thought.
The work, performed at the Advanced Photon Source at the U.S. Department of Energy’s Argonne National Laboratory, will have a significant impact on our understanding of the lower mantle, scientists said. Understanding the composition of the mantle is essential to seismology, the study of earthquakes and movement below Earth’s surface, and should shed light on unexplained seismic phenomena observed there.
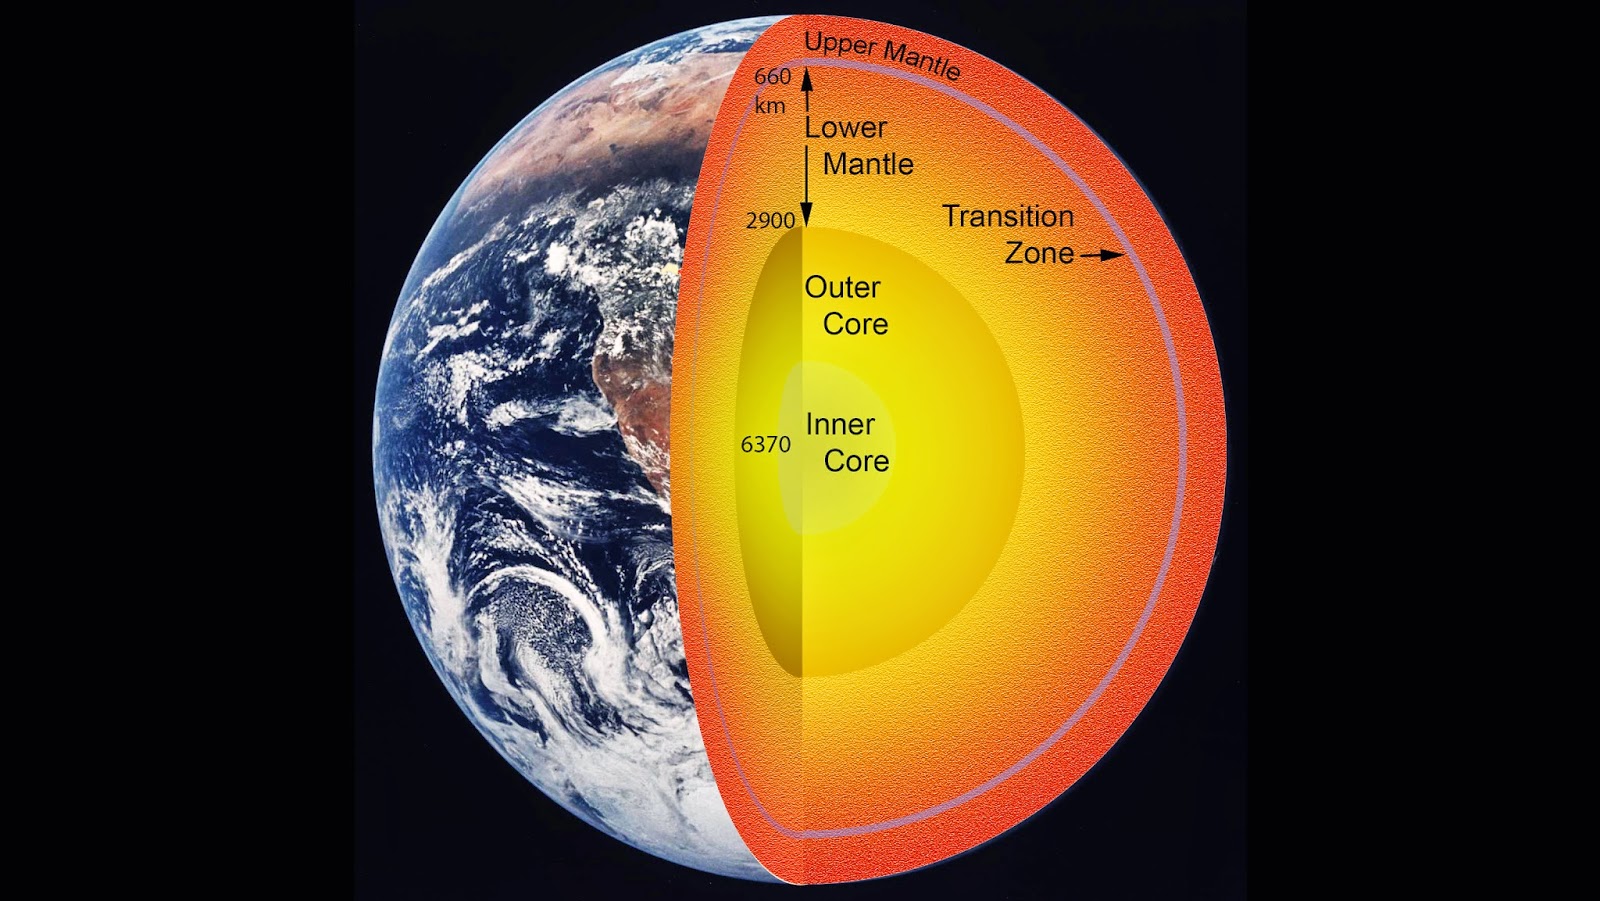
Though humans haven’t yet managed to drill further than seven and a half miles into Earth, we’ve built a comprehensive picture of what’s beneath our feet through calculations and limited observation. We all live atop the crust, the thin outer layer; just beneath is the mantle, outer core and finally inner core. The lower portion of the mantle is the largest layer — stretching from 400 to 1,800 miles below the surface — and gives off the most heat. Until now, the entire lower mantle was thought to be composed of the same mineral throughout: ferromagnesian silicate, arranged in a type of structure called perovskite.
The pressure and heat of the lower mantle is intense — more than 3,500° Fahrenheit. Materials may have very different properties at these conditions; structures may exist there that would collapse at the surface.
To simulate these conditions, researchers use special facilities at the Advanced Photon Source, where they shine high-powered lasers to heat up the sample inside a pressure cell made of a pair of diamonds. Then they aim powerful beams of X-rays at the sample, which hit and scatter in all directions. By gathering the scatter data, scientists can reconstruct how the atoms in the sample were arranged.
The team found that at conditions that exist below about 1,200 miles underground, the ferromagnesian silicate perovskite actually breaks into two separate phases. One contains nearly no iron, while the other is full of iron. The iron-rich phase, called the H-phase, is much more stable under these conditions.
“We still don’t fully understand the chemistry of the H-phase,” said lead author and Carnegie Institution of Washington scientist Li Zhang. “But this finding indicates that all geodynamic models need to be reconsidered to take the H-phase into account. And there could be even more unidentified phases down there in the lower mantle as well, waiting to be identified.”
The facilities at Argonne’s Advanced Photon Source were key to the findings, said Carnegie scientist Yue Meng, also an author on the paper. “Recent technological advances at our beamline allowed us to create the conditions to simulate these intense temperatures and pressures and probe the changes in chemistry and structure of the sample in situ,” she said.
“What distinguished this work was the exceptional attention to detail in every aspect of the research — it demonstrates a new level for high-pressure research,” Meng added.
Note : The above story is based on materials provided by DOE/Argonne National Laboratory. The original article was written by Louise Lerner.
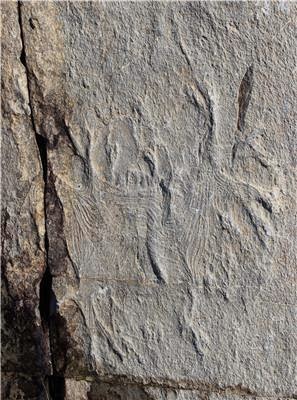
A new fossil discovery identifies the earliest evidence for animals with muscles. An unusual new fossil discovery of one of the earliest animals on earth may also provide the oldest evidence of muscle tissue — the bundles of cells that make movement in animals possible.
The fossil, dating from 560 million years ago, was discovered in Newfoundland, Canada.
On the basis of its four-fold symmetry, morphological characteristics, and what appear to be some of the earliest impressions of muscular tissue, researchers from the University of Cambridge, in collaboration with the University of Oxford and the Memorial University of Newfoundland, have interpreted it as a cnidarian: the group which contains modern animals such as corals, sea anemones and jellyfish. The results are published today (27 August) in the journal Proceedings of the Royal Society B.
Historically, the origin, evolution and spread of animals has been viewed as having begun during the Cambrian Explosion, a period of rapid evolutionary development starting 541 million years ago when most major animal groups first appear in the fossil record.
“However, in recent decades, discoveries of preserved trackways and chemical evidence in older rocks, as well as molecular comparisons, have indirectly suggested that animals may have a much earlier origin than previously thought,” said Dr Alex Liu of Cambridge’s Department of Earth Sciences, lead author of the paper.
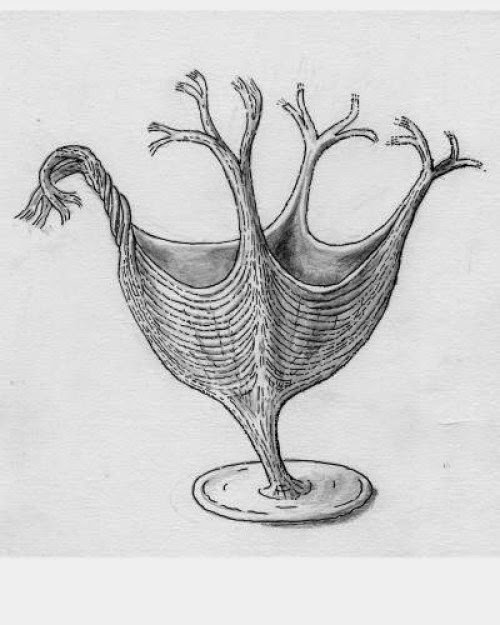
This is an artist’s reconstruction of H. quadriformis. Credit: Martin Brasier
“The problem is that although animals are now widely expected to have been present before the Cambrian Explosion, very few of the fossils found in older rocks possess features that can be used to convincingly identify them as animals,” said Liu. “Instead, we study aspects of their ecology, feeding or reproduction, in order to understand what they might have been.”
The new fossil, named Haootia quadriformis, dates from the Ediacaran Period, an interval spanning 635 to 541 million years ago. It differs from any previously described Ediacaran fossil, as it comprisesof bundles of fibres in a broadly four-fold symmetrical arrangement: a body plan that is similar to that seen in modern cnidarians.
The researchers determined that the similarities between Haootia quadriformis and both living and fossil cnidarians suggest that the organism was probably a cnidarian, and that the bundles represent muscular tissue. This would make it not only a rare example of an Ediacaran animal, but also one of the oldest fossils to show evidence of muscle anywhere in the world.
“The evolution of muscular animals, in possession of muscle tissues that enabled them to precisely control their movements, paved the way for the exploration of a vast range of feeding strategies, environments, and ecological niches, allowing animals to become the dominant force in global ecosystems,” said Liu.
The research was funded by the Natural Environment Research Council, the Natural Sciences and Engineering Research Council of Canada, the Burdett Coutts Fund of the University of Oxford, and the National Geographic Global Exploration Fund Northern Europe.
Note : The above story is based on materials provided by University of Cambridge. The original story is licensed under a Creative Commons Licence.
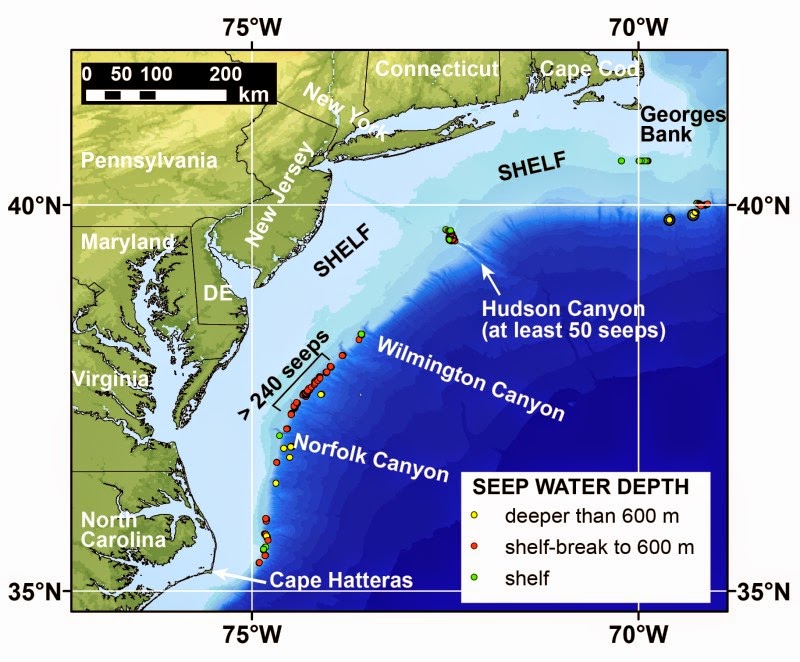
Map of the northern U.S. Atlantic margin showing the locations of newly-discovered methane seeps mapped by researchers from Mississippi State University, the U.S. Geological Survey, and other partners. None of the seeps shown here was known to researchers before 2012. Credit: Image courtesy of U.S. Geological Survey
Natural methane leakage from the seafloor is far more widespread on the U.S. Atlantic margin than previously thought, according to a study by researchers from Mississippi State University, the U.S. Geological Survey, and other institutions.
Methane plumes identified in the water column between Cape Hatteras, North Carolina and Georges Bank, Massachusetts, are emanating from at least 570 seafloor cold seeps on the outer continental shelf and the continental slope. Taken together, these areas, which lie between the coastline and the deep ocean, constitute the continental margin. Prior to this study, only three seep areas had been identified beyond the edge of the continental shelf, which occurs at approximately 180 meters (590 feet) water depth between Florida and Maine on the U.S. Atlantic seafloor.
Cold seeps are areas where gases and fluids leak into the overlying water from the sediments. They are designated as cold to distinguish them from hydrothermal vents, which are sites where new oceanic crust is being formed and hot fluids are being emitted at the seafloor. Cold seeps can occur in a much broader range of environments than hydrothermal vents.
“Widespread seepage had not been expected on the Atlantic margin. It is not near a plate tectonic boundary like the U.S. Pacific coast, nor associated with a petroleum basin like the northern Gulf of Mexico,” said Adam Skarke, the study’s lead author and a professor at Mississippi State University.
The gas being emitted by the seeps has not yet been sampled, but researchers believe that most of the leaking methane is produced by microbial processes in shallow sediments. This interpretation is based primarily on the locations of the seeps and knowledge of the underlying geology. Microbial methane is not the type found in deep-seated reservoirs and often tapped as a natural gas resource.
Most of the newly discovered methane seeps lie at depths close to the shallowest conditions at which deepwater marine gas hydrate can exist on the continental slope. Gas hydrate is a naturally occurring, ice-like combination of methane and water, and forms at temperature and pressure conditions commonly found in waters deeper than approximately 500 meters (1640 feet).
“Warming of ocean temperatures on seasonal, decadal or much longer time scales can cause gas hydrate to release its methane, which may then be emitted at seep sites,” said Carolyn Ruppel, study co-author and chief of the USGS Gas Hydrates Project. “Such continental slope seeps have previously been recognized in the Arctic, but not at mid-latitudes. So this is a first.”
Most seeps described in the new study are too deep for the methane to directly reach the atmosphere, but the methane that remains in the water column can be oxidized to carbon dioxide. This in turn increases the acidity of ocean waters and reduces oxygen levels.
Shallow-water seeps that may be related to offshore groundwater discharge were detected at the edge of the shelf and in the upper part of Hudson Canyon, an undersea gorge that represents the offshore extension of the Hudson River. Methane from these seeps could directly reach the atmosphere, contributing to increased concentrations of this potent greenhouse gas. More extensive shallow-water surveys than described in this study will be required to document the extent of such seeps.
Some of the new methane seeps were discovered in 2012. In summer 2013 a Brown University undergraduate and National Oceanic and Atmospheric Administration Hollings Scholar Mali’o Kodis worked with Skarke to analyze about 94,000 square kilometers (about 36,000 square miles) of water column imaging data to map the methane plumes. The data had been collected by the vessel Okeanos Explorer between 2011 and 2013. The Okeanos Explorer and the Deep Discoverer remotely operated vehicle, which has photographed the seafloor at some of the methane seeps, are managed by NOAA’s Office of Ocean Exploration and Research.
“This study continues the tradition of advancing U.S. marine science research through partnerships between federal agencies and the involvement of academic researchers,” said John Haines, coordinator of the USGS Coastal and Marine Geology Program “NOAA’s Ocean Exploration program acquired state-of-the-art data at the scale of the entire margin, while academic and USGS scientists teamed to interpret these data in the context of a research problem of global significance.”
The study, “Widespread methane leakage from the sea floor on the northern US Atlantic Margin,” by A, Skarke, C. Ruppel, M, Kodis, D. Brothers and E. Lobecker in Nature Geoscience is available on line.
USGS Gas Hydrates Project
The USGS has a globally recognized research effort studying natural gas hydrates in deepwater and permafrost settings worldwide. USGS researchers focus on the potential of gas hydrates as an energy resource, the impact of climate change on gas hydrates, and seafloor stability issues.
For more information about the U.S. Geological Survey’s Gas Hydrates Project, visit the Woods Hole Coastal and Marine Science Center, U.S. Geological Survey Gas Hydrates Project website (http://woodshole.er.usgs.gov/).
For more information, visit the Mississippi State University website (http://www.msstate.edu/).
Note : The above story is based on materials provided by U.S. Geological Survey.
This image shows freshwater marsh vegetation in Wax Lake Delta, La. Aquatic vegetation on low-elevation marshes is pictured in the foreground, while woody vegetation occupies a levee on the left. The open water in the distance is a deltaic distributary channel. Credit: Elizabeth Olliver, Indiana University
Research by Indiana University geologists suggests that an intermediate amount of vegetation — not too little and not too much — is most effective at stabilizing freshwater river deltas.
The study, “Optimum vegetation height and density for inorganic sedimentation in deltaic marshes,” was published online Aug. 24 by Nature Geoscience. The findings may help guide restoration of river deltas, such as those near the mouth of the Mississippi River, which are under threat as sea levels rise.
Authors are William Nardin, a postdoctoral fellow in the Department of Geological Sciences in the IU Bloomington College of Arts and Sciences; and Douglas A. Edmonds, who holds the Robert R. Shrock Professorship in Sedimentary Geology and is an assistant professor of geological sciences.
Vegetation on marsh surfaces in river deltas can slow the flow of water and cause more sediment to be deposited, helping prevent sea-level rise from drowning sensitive marshlands. But the study finds that, if the vegetation is too tall or dense, it diverts water into the river channel, resulting in less sediment being deposited on the marsh.
“In river deltas the effect of vegetation on sedimentation seems to follow the Goldilocks principle,” Edmonds said. “You want the amount of vegetation that is just right — not too much, but also not too little.”
The world’s river deltas are rich and productive and are home to about 10 percent of the world’s population. But they are threatened by an array of forces, including population growth, pollution, development and erosion, as well as sea-level rise associated with climate change.
Edmonds wrote in a 2012 Nature Geoscience article that river deltas can be restored, but it will take a better understanding of the processes involved in their formation and destruction. The current study suggests vegetation could play a role in designing effective river delta restoration.
In tidal saltwater marshes, research has shown that vegetation enhances sedimentation. But scientists know less about how vegetation affects sedimentation in freshwater marshes that are common in river deltas. Nardin and Edmonds used sophisticated computer modeling to study how marsh vegetation influences the transport and deposition of sediment in river deltas. They conducted 75 simulations involving varying scenarios of vegetation height and density and rates of water flow.
They found that vegetation of intermediate height and density results in the greatest deposition of sand and mud. However, if the plants are too tall or densely packed, sediment tends to remain in the river channel, bypassing marshes and being carried directly to the sea.
The researchers also analyzed remote-sensing data collected from Wax Lake Delta in Louisiana. The analysis showed the delta exhibits a hydrodynamic response to the presence of vegetation that corresponds with what the researchers found with their model.
The rate at which sediment is delivered to marshes in river deltas is strongly influenced by storms and flooding, as well as the construction of engineered diversions. The research suggests the resilience of river deltas will depend on the timing of floods and storms relative to the seasonal growth of vegetation. And of course, scientists can’t control or even predict when floods will occur.
“That unpredictability adds an interesting twist to the problem,” Edmonds said. “The time that the flood wave arrives does not always coincide with the timing of vegetation growth and decay. Those two have to line up just right for vegetation to really enhance deposition of sand and mud.”
Note: The above story is based on materials provided by Indiana University.
Pieces of a chimney that toppled and went through the roof after an earthquake in Sparks, Oklahoma, in 2011. Photograph: Sue Ogrocki/AP
Man-made earthquakes, a side effect of some high-tech energy drilling, cause less shaking and in general are about 16 times weaker than natural earthquakes with the same magnitude, a study found.
People feeling the ground move from induced quakes those that are not natural, but triggered by injections of wastewater deep underground report significantly less shaking than those who experience more normal earthquakes of the same magnitude, according to a study by US Geological Survey geophysicist Susan Hough.
Distance matters in this shaking gap, however. For people within six miles of the fault, artificial and natural quakes feel pretty much the same, she said.
Hough studied similar-sized man-made and natural quakes in the central and eastern United States from 2011 to 2013, comparing the reported magnitude to what people said they felt in the USGS electronic “Did You Feel It” survey. She found that while two different types of temblors may have had the same magnitude as measured by seismographs, they had distinct differences in what people said they felt.
The way artificial quakes felt was equivalent on average to a natural quake that had a magnitude 0.8 smaller. So a 4.8 induced quake felt like a 4.0 quake, Hough said. The magnitude scale used by USGS and others is mathematically complex, but a drop in 0.8 magnitude translates to about 16 times less strength or energy released.
Sometimes the difference is even bigger. Hough said a 5.3 August 2011 man-made quake in Trinidad, Colorado, actually felt like a 4.0 quake, which is about 90 times weaker, based on the thousands of responses in the “Did You Feel It” survey system. The study, published Monday in the Bulletin of the Seismological Society of America, looked at quakes in Oklahoma, Colorado, Arkansas, Texas and Ohio. It included a 5.7 quake in Prague, Oklahoma, in November 2011 that injured two people and damaged 14 houses, which Hough said felt like 5.1 magnitude natural quake.
“The hazard of these earthquakes is lower than what you’d expect,” Hough said. “It’s not that there’s no hazard, it’s just that it’s a little better than you might think.”
Man-made earthquakes have become a big concern recently as hydraulic fracturing and other drilling injects wastewater deep underground. Scientists say that sometimes triggers shifts along existing and previously unknown faults. Oklahoma has had more than 300 earthquakes of magnitude 3 or more strong enough to feel locally but too weak to cause damage since January 1. Before 2007, Oklahoma averaged only one quake a year of that size.
The artificial quakes may have less energy only after 6 miles (10 kilometers) away because the fault is lubricated by the injected wastewater, making it easier to slip and do so more smoothly in less of a herky-jerky motion, Hough theorized. Also these faults can be slipping with less pent-up energy than they would have if they slipped naturally years later.
But induced quakes are shallow, which means the shaking has to travel less distance to buildings nearby, said seismologist Steve Horton of the University of Memphis, who wasn’t part of the study. He and others said Hough’s study made sense and could change how researchers look at quake intensity.
Note : The above story is based on materials provided by Associated Press in Washington
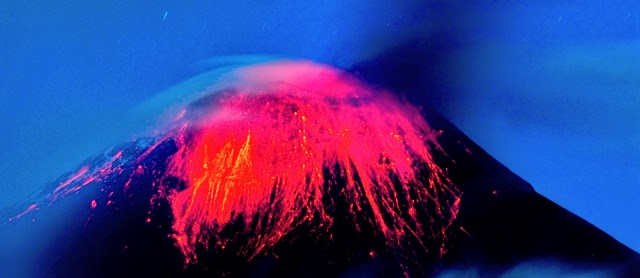
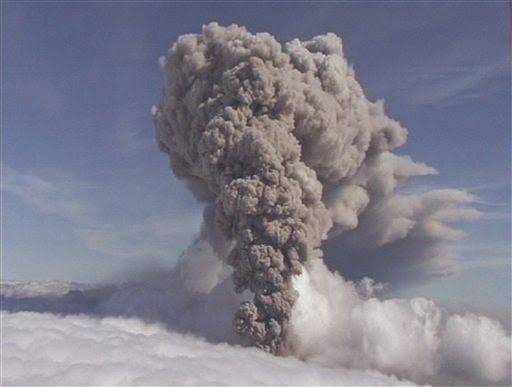
Computer screens show seismic activity from the Bardarbunga volcanic eruption at the Icelandic met office in Reykjavik on August 23, 2014
Iceland lowered its alert over the nation’s largest volcanic system to orange on Sunday after keeping it for one day at the maximum level amid fears of an imminent eruption.
A major explosion at the Bardarbunga volcano, located under a glacier, could signal a replay of the global travel chaos triggered when another Icelandic peak blew four years ago, creating a massive ash cloud across Europe.
The Icelandic Met Office said that there had not been a small sub-glacial eruption on Saturday, as previously announced.
“Presently there are no signs of ongoing volcanic activity,” IMO said on its website on Saturday night.
The red alert level on Saturday led to the closure of airspace in the affected area, although all airports in the country remained opened.
Seismic activity remains high in the area, with more than 700 tremors recorded during the night.
Early on Sunday, the strongest earthquakes of the current seismic cycle shook Bardarbunga.
They were listed on the Met Office’s website with intensities of 5.3 and 5.1 on the Richter scale, the highest registered in the area since 1996.
The eruption of Eyjafjoell, a smaller volcano, in April 2010 caused travel mayhem, stranding more than eight million people in the widest airspace shutdown since World War II.
Iceland’s most active sub-glacial volcano Grimsvotn erupted in 2011, forcing the country to temporarily shut its airspace and sparking fears of a repeat of the Eyjafjoell flight chaos.
Iceland is home to more than 100 volcanic mountains, some of which are among the most active in the world.
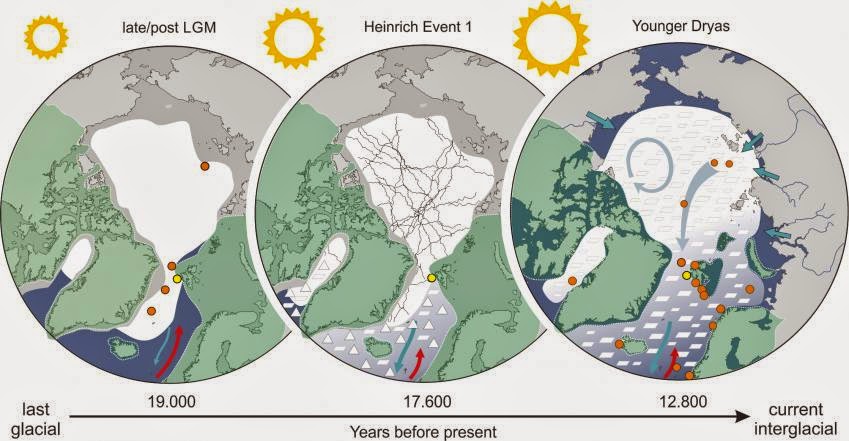
The force of the Gulf Stream was significantly influenced by the sea ice situation in the Fram Strait in the past 30,000 years. Scientists at the Alfred Wegener Institute, Helmholtz Centre for Polar and Marine Research (AWI) come to this conclusion in a new study that appears today in the journal Earth and Planetary Science Letters.
On the basis of biomarkers in deposits on the seafloor, the geologists involved managed for the first time to reconstruct when and how the marine region between Greenland and Svalbard was covered with ice in the past and in what way the Gulf Stream reacted when the sea ice cover suddenly broke up. They concluded that when large amounts of Arctic ice drifted through the Fram Strait to the North Atlantic, the heat transport of the Gulf Stream declined noticeably.
For AWI geologist Juliane Müller the Fram Strait is a key region in the global oceanic circulation. “On the east side of this passage between Greenland and Svalbard warm Atlantic water flows to the north into the Arctic Ocean while on the west side cold Arctic water masses and sea ice push their way out of the Arctic into the North Atlantic. A considerable portion of the Atlantic water cools here on its way to the north and sinks to deeper layers. The circulation of the water caused in this manner drives the global band of oceanic currents like a giant pump and influences, among other things, how much heat the Gulf Stream transports towards Europe,” says the scientist.
If the pulse frequency of this circulation pump changes, this gives rise to direct changes in the climate – for instance, at the end of the past glacial period and during the transition to our present-day interglacial. “In the past 30,000 years the Gulf Stream has lost an extraordinary amount of force at least twice – once 17,600 years ago and about 12,800 years ago. Both times the climate in Europe consequently cooled down significantly – and now we also know why,” says Juliane Müller.
She and her AWI colleague Ruediger Stein were the first scientists to succeed in reconstructing the sea ice conditions in the Fram Strait for this critical period at the end of the last glacial and thus in finding a direct connection between changes in sea ice cover and fluctuations in the Gulf Stream.
A nine metre long sediment core served as a window into the past for the geologists. It was drilled on a Fram Strait expedition conducted on the research vessel Maria. S. Merian and has such clearly defined layers that the scientists can read it like a book. “This core stems from the western continental slope of Svalbard, a region with an unusually high sedimentation rate. That means a very large number of sediment particles – the stores of climate information – trickle to the seafloor. This is the only explanation for the fact that we find the climate data from five to ten years over a length of one centimetre in this core while it could easily be as many as 1,000 years per centimetre of sediment sample in cores from low-particle regions. And, of course, 1,000 years are much too long a period to be able to clearly identify short-term climate fluctuations at all,” explains Juliane Müller.
Two kinds of fossil molecules, also designated as biomarkers, served as indications of the existence and the duration of an ice cover for Juliane Müller. One kind is produced by diatoms living in the sea ice, the other by algae that prefer the open water. “The markers provide us with astonishing insights into the climate history of the Fram Strait. For instance, we now know that a thick ice cover did not form until after the actual high point of the last glacial period. However, it held for around 1,000 years and influenced the oceanic currents in the North Atlantic on a long-term basis,” says Juliane Müller.
The reason for this is that the ice cover delayed the breakup of the large ice sheets that covered large sections of Europe and North America at that time. “The sea ice stabilised the glacier fronts of these ice sheets like a dam wall and prevented icebergs from calving. Export of freshwater from the Arctic to the North Atlantic, which otherwise would have been enormous, was thus checked for a certain time,” explains the geologist.
When the ice cover then broke up within an extremely short time 17,600 years ago, tremendous ice masses poured into the North Atlantic. There they melted and released large volumes of freshwater. “This sudden freshening of the North Atlantic altered the density structure of the water and led to significant weakening of the Atlantic overturning circulation, or to put it more simply, to weakening of the Gulf Stream,” says Juliane Müller.
According to the study, a similar chain reaction occurred yet another time during the Younger Dryas around 12,800 years ago when enormous amounts of sea ice again left the Arctic moving towards the North Atlantic and heat transport via the Gulf Stream declined. “The results of our study show how important Arctic sea ice is for the global oceanic circulation and that sudden changes in the sea ice cover of the Arctic Ocean is directly connected with abrupt climate fluctuations,” says the AWI scientist.
She will now provide the newly obtained data to AWI’s climate modellers. “With the help of these specific data we can check how reliably our models depict the sea ice situation of the past 30,000 years. In this way the data from the past help us to improve our models and consequently enable us to make more precise statements on the future of the Gulf Stream,” states Juliane Müller.
More information:
Juliane Müller / Ruediger Stein: High-resolution record of late glacial and deglacial sea ice changes in Fram Strait corroborates ice-ocean interaction during abrupt climate shifts, Earth and Planetary Science Letters, DOI:10.1016/j.epsl.2014.07.016
Note : The above story is based on materials provided by Helmholtz Association of German Research Centres
Citizen scientists are saving the lives of people living in the shadow of deadly volcanoes according to new research from the University of East Anglia.
A new report published today reveals the success of a volunteer group set up to safeguard communities around the ‘Throat of Fire’ Tungurahua volcano in the Ecuadorian Andes.
More than 600 million people live close to active volcanoes worldwide. The research shows that living safely in these dangerous areas can depend on effective communication and collaboration between volcanologists, risk managers and vulnerable communities.
It is hoped that the research will help inform similar community engagement in volcanic and other disaster risk reduction projects around the world.
The report looks at a 35-strong network of volunteers called ‘vigías’, which was set up 14 years ago in the wake of renewed activity at a historically deadly volcano. The eruptions led to a military evacuation of around 25,000 people from Baños and the surrounding area. But leaving homes, land and livelihoods was hard, and the community rallied together to over-run checkpoints and re-occupy the town.
Lead researcher Jonathan Stone from UEA’s school of Environmental Sciences said: “This pattern of re-occupation is common in volcanic areas and after other natural disasters. The people of Baños wanted to go home even though it wasn’t safe.
“The volcano’s activity has varied from small explosions with ash emissions to violent eruptions with fast-moving pyroclastic flows. Living close by is a real risk, and so the vigía network was set up to help monitor the volcano and protect the community.
“It was initially a compromise between the community and civil protection agencies who were attempting to ensure their safety.”
The Spanish word ‘vigía’ means watchman, guard, sentinel or lookout – but the research shows that the role extends beyond that which the name suggests and that of the normal citizen scientist.
“The vigías are members of the community who help scientists collect data about volcanic activity, are part of a vital early warning system for eruptions, and facilitate evacuations of the community during a crisis.
“The network enables citizens to continue to live and work in a hazardous area by enhancing their capacity to respond quickly to escalating threats. The ideal risk reduction scenario would be to move people out of the way of the volcano permanently, but clearly this is not always practical – people often want to live and work in particular locations for a number of reasons, and anyway – there are few places that you can move in the Ecuadorian Andes that aren’t threatened by one or several volcanoes!
“Community based monitoring has the potential to reduce risk by providing useful data, fostering collaboration between scientists and communities, and providing a way in which citizens are empowered to take actions to preserve lives and livelihoods.”
The report reveals how one particular eruption in August 2006 was pivotal, with many lives saved in the Juive Grande area thanks to the vigía network. And when further eruptions took place in 2013 and as recently as February and April this year, scientists and responding agencies attributed in part the zero loss of life and injury to the quick actions of the volunteers.
The research team interviewed vigías, other people in the community and scientists to discover why the network was such a success.
Jonathan Stone said: “The area is potentially becoming more dangerous with villages and grazing lands around the volcano’s base particularly at risk. One of the reasons why the vigías network really works is because they have a vested interest to be ready for the next eruptive event. They want to work with the authorities to help their communities.
“Scientists are considered friends and colleagues, which also has a big impact on the success of the network. The vigías act as a bridge between the community and the scientists. The communities are able to more rapidly trust and act upon advice from the scientists and authorities, because of the vigías.
Prof Jenni Barclay from UEA’s school of Environmental Sciences leads the Strengthening Resilience in Volcanic Areas (STREVA) project and contributed to the research. She said: “This kind of research is very important because by examining cases like this, we can learn lessons about the potential of community-based disaster risk reduction in other contexts. It provides valuable evidence for how to reduce volcanic risk in practice, which is a critical step in finding ways of increasing society’s resilience to events of this nature.”
More information:
“Risk reduction through community-based monitoring: the vigías of Tungurahua, Ecuador.” Jonathan Stone, et al. Journal of Applied Volcanology 2014, 3:11 DOI: 10.1186/s13617-014-0011-9
Note : The above story is based on materials provided by University of East Anglia
Schematic cross section of the Earth’s interior highlighting the transition zone layer (light blue, 410-660 km depth), which has an anomalously high water storage capacity. The study by Schmandt and Jacobsen used seismic waves to detect magma generated near the top of the lower mantle at about 700 km depth. Dehydration melting at those conditions, also observed in the study’s high-pressure experiments, suggests the transition zone may be nearly saturated with H2O dissolved in high-pressure rock. Credit: Steve Jacobsen/Northwestern University
Researchers have found evidence of a potential “ocean’s worth” of water deep beneath the United States.
Although not present in a familiar form, the building blocks of water are bound up in rock located deep in the Earth’s mantle, and in quantities large enough to represent the largest water reservoir on the planet, according to the research.
For many years, scientists have attempted to establish exactly how much water may be cycling between the Earth’s surface and interior reservoirs through the action of plate tectonics. Northwestern University geophysicist Steve Jacobsen and University of New Mexico seismologist Brandon Schmandt have found deep pockets of magma around 400 miles beneath North America—a strong indicator of the presence of H₂O stored in the crystal structure of high-pressure minerals at these depths.
“The total H₂O content of the planet has long been among the most poorly constrained ‘geochemical parameters’ in Earth science. Our study has found evidence for widespread hydration of the mantle transition zone,” says Jacobsen.
For at least 20 years geologists have known from laboratory experiments that the Earth’s transition zone—a rocky layer of the Earth’s mantle located between the lower mantle and upper mantle, at depths between 250 and 410 miles—can, in theory, hold about 1 percent of its total weight as H₂O, bound up in minerals called wadsleyite and ringwoodite. However, as Schmandt explains, up until now it has been difficult to figure out whether that potential water reservoir is empty, as many have suggested, or not.
If there does turn out to be a substantial amount of H₂O in the transition zone, then recent laboratory experiments conducted by Jacobsen indicate there should be large quantities of what he calls “partial melt” in areas where mantle flows downward out of the zone. This water-rich silicate melt is molten rock that occurs at grain boundaries between solid mineral crystals and may account for about 1 percent of the volume of rocks.
“Melting occurs because hydrated rocks are carried from the transition zone, where the rocks can hold lots of H₂O, downward into the lower mantle, where the rocks cannot hold as much H₂O. Melting is the way to get rid of the H₂O that won’t fit in the crystal structure present in the lower mantle,” says Jacobsen.
He adds:
“When a rock starts to melt, whatever H₂O is bound in the rock will go into the melt right away. So the melt would have much higher H₂O concentration than the remaining solid. We’re not sure how it got there. Maybe it’s been stuck there since early in Earth’s history or maybe it’s constantly being recycled by plate tectonics.”
Seismic Waves
Melt strongly affects the speed of seismic waves—the acoustic-like waves of energy that travel through the Earth’s layers as a result of an earthquake or explosion. This is because stiff rocks, like the silicate-rich ones present in the mantle, propagate seismic waves very quickly. According to Schmandt, if just a little melt—even 1 percent or less—is added between the crystal grains of such a rock it causes it to become less stiff, meaning that elastic waves propagate more slowly.
“We were able to analyse seismic waves from earthquakes to look for melt in the mantle just beneath the transition zone,” says Schmandt.
“What we found beneath the U.S. is consistent with partial melt being present in areas of downward flow out of the transition zone. Without the presence of H₂O, it is very difficult to explain melting at these depths. This is a good hint that the transition zone H₂O reservoir is not empty, and even if it’s only partially filled that could correspond to about the same mass of H₂O as in Earth’s oceans,” he adds.
Jacobsen and Schmandt hope that their findings, published in the June issue of the journal Science, will help other scientists to understand how the Earth formed and what its current composition and inner workings are, as well as establish how much water is trapped in mantle rock.
“I think we are finally seeing evidence for a whole-Earth water cycle, which may help explain the vast amount of liquid water on the surface of our habitable planet. Scientists have been looking for this missing deep water for decades,” says Jacobsen
Mantle Rock Studies
The study combined Schmandt’s analysis of seismic data from the USArray, a network of over 2,000 seismometers across the U.S., with Jacobsen’s laboratory experiments, in which he examined the behaviour of mantle rock under conditions designed to simulate the high pressures and temperatures present at 400 miles below the Earth’s surface.
The USArray is part of Earthscope, a program sponsored by National Science Foundation. Jacobsen’s experiments were conducted at two Department of Energy user facilities, the Advanced Photon Source of Argonne National Laboratory and the National Synchrotron Light Source at Brookhaven National Laboratory.
Taken as a whole, their findings produced strong evidence that melting may occur about 400 miles deep in the Earth, with H₂O stored in mantle rocks, such as those containing the mineral ringwoodite, which is likely to be a dominant mineral at those depths.
Schmandt explains that he made this discovery after carrying out seismic imaging of the boundary between the transition zone and lower mantle. He found evidence that, in areas where “sharp transitions” like melt are present, some earthquake energy had converted from a compressional, or longitudinal wave, to a shear or S-wave. The phase of the converted S-waves in areas where the mantle is flowing down and out of the transition zone indicated a significantly lower velocity than surrounding mantle. The discovery suggests that water from the Earth’s surface can be driven to such great depths by plate tectonics, eventually resulting in the partial melting of the rocks found deep in the mantle.
“We used many seismic wave conversions to see that many areas beneath the U.S. may have some melt just beneath the transition zone. The next step was comparing these areas to the areas where mantle flow models predict downward flow out of the transition zone,” says Schmandt.
Ringwoodite
Schematic representation of seismometers placed in the US-Array between 2004 and 2014 and used in the study by Schmandt and Jacobsen to detect dehydration melting at the top of the lower mantle beneath North America. Credit: NSF-Earthscope
Schmandt and Jacobsen’s findings build on a discovery reported in March in the journal Nature in which scientists discovered a piece of the blue mineral ringwoodite inside a diamond brought up from a depth of 400 miles by a volcano in Brazil. That tiny piece of ringwoodite—the only sample we have from within the Earth—contained a surprising amount of water bound in solid form in the mineral.
“Not only was this the first terrestrial ringwoodite ever seen—all other natural ringwoodite examples came from shocked meteorites—but the tiny inclusion of ringwoodite was also full of H₂O, to about 1.5 percent of total weight,” says Jacobsen. “This is about the maximum amount of water that we are able to put into ringwoodite in laboratory experiments.”
Although the discovery provided direct evidence of water in the deep mantle at about 700 kilometers (434 miles) deep, the diamond sampled only one point of the mantle. Jacobsen explains that the paper expands the search to question how widespread hydration might be throughout the entire transition zone. This is important because the presence of H₂O in the large volumes of rock found at depths of between 410 to 660 kilometers (255 to 410 miles) would “significantly alter our understanding of the composition of the Earth.”
“It would double or triple the known amount of H₂O in the bulk Earth. Just 1 to 2 percent H₂O by weight in the transition zone would be equivalent to 2 to 3 times the amount of H₂O in the oceans,” adds Jacobsen.
Big Questions
Crystals of laboratory-grown hydrous ringwoodite, a high-pressure polymorph of olivine that is stable from about 520-660 km depth in the Earth’s mantle. The ringwoodite pictured here contains around one weight percent of H2O, similar to what was inferred in the seismic observations made by Schmandt and Jacobsen. Credit: Steve Jacobsen/Northwestern University
Looking ahead, Jacobsen admits that some big questions remain. For example, if the transition zone is full of H₂O, what does this tell us about the origin of Earth’s water? And is the presence of ringwoodite in a planet’s mantle necessary for a planet to retain enough original water to form oceans? Moreover, how is the H₂O in the transition zone connected to the surface reservoirs? Is the transition zone, if it contains a geochemical reservoir of H₂O larger than the oceans, somehow buffering the amount of liquid water on the Earth’s surface?
“An analogy could be that of a sponge, which needs to be filled before liquid water can be supported on top. Was water in the transition zone added through plate tectonics early in Earth’s history, or did the oceans de-gas from the mantle until an equilibrium was reached between surface and interior reservoirs?” asks Jacobsen.
Either way, the research is likely to be of strong interest to astrobiologists largely because water is often so closely linked to the formation of biological life. Remote geochemical analysis could be one way of detecting if such processes occur elsewhere in the universe, and it is likely that such analysis would involve the use of gamma-ray, neutron, and x-ray spectrometers of the type used by the NASA MESSENGER spacecraft for the remote geochemical mapping of Mercury.
“On other hard to reach planets it’s not practical to apply the type of seismic imaging that I used. So my guess is that geochemical analysis of volcanic rocks from other planetary bodies may be our best way to test whether volatiles are stored in the planet’s interior,” says Schmandt.
Note : The above story is based on materials provided by Astrobio.net This story is republished courtesy of NASA’s Astrobiology Magazine.
This is a Saturday May 8 2010 file image taken from video of a column of ash rising from Iceland’s Eyjafjallajokul volcano. It was reported Tueday Aug. 19, 2014 that thousands of small intense earthquakes are rocking Iceland amid concerns that one of the country’s volcanoes may be close to erupting. Iceland has raised its aviation alert level for the risk of a possible volcanic eruption to orange _ the second-most severe level. The alert is worrisome because of the chaos that followed the April 2010 eruption of Eyjafjallajokul, when more than 100,000 flights were cancelled because volcanic ash floating in the atmosphere is considered an aviation safety hazard. (AP Photo/ APTN)
Iceland’s Bardarbunga volcano began erupting Saturday under the country’s largest glacier after a week of seismic activity rattled the area with thousands of earthquakes, the country’s Meteorological Office said.
The eruption prompted Iceland to raise its aviation alert level to red—the highest level on a five-point scale—indicating the threat of “significant emission of ash into the atmosphere.”
Seismic data indicates that magma from the volcano is melting ice beneath the Dyngjujokull icecap on the Vatnajokull glacier, Met Office vulcanologist Melissa Pfeffer said.
The remote area, 200 miles (320 kilometers) east of the capital of Reykjavik, is uninhabited.
She said it was not clear when, or if, the eruption would melt through the ice—which is between 100 and 400 meters (330 feet and 1,300 feet) thick—and send steam and ash into the air. She said it could take up to a day for the ice to melt—or the eruption might remain contained beneath Europe’s largest glacier.
Icelandic authorities on Saturday declared a no-fly zone of 100 nautical miles by 140 nautical miles around the eruption, but did not shut the country’s airspace.
“All airports are open and flights are on schedule,” said Olof Baldursdottir of Iceland’s Civil Protection Department.
A 2010 eruption of Iceland’s Eyjafjallajokul volcano produced an ash cloud that caused a week of international aviation chaos, with more than 100,000 flights cancelled.
Pfeffer said scientists were flying over the glacier Saturday to look for changes on its surface. Scientists were also monitoring a hydrological station downstream from the volcano for flooding—a common result of volcanic eruptions in Iceland.
She said the amount of ash produced by the new eruption would depend on the thickness of the ice.
“The thicker the ice, the more water there is, the more explosive it will be and the more ash-rich the eruption will be,” she said.
Iceland sits on a volcanic hot spot in the Atlantic’s mid-oceanic ridge and eruptions occur frequently, triggered when the Earth’s plates move and when magma from deep underground pushes its way to the surface.
Well-practiced emergency procedures mean eruptions in Iceland usually do not cause deaths. Authorities evacuated several hundred people, mostly hikers, earlier this week from the highlands north of the Vatnajokull glacier as a precaution.
But the impact of the tiny island’s volcanoes has been felt around the world.
Millions of people were stranded in April 2010, when aviation officials closed Europe’s air space for five days out of fear that ash from Eyjafjallajokul could harm jet engines.
European aviation authorities later changed their policy, giving airlines detailed information about the location and density of ash clouds but leaving decisions to airlines and national regulators.
A 2011 eruption of Iceland’s Grimsvotn volcano was far more powerful than Eyjafjallajokul but cause much less disruption.
Budget airline EasyJet, which flies between Britain and Iceland, said it was operating as usual. It said it would use ash-detection technology, satellite data and other information “to determine what, if any, changes it should make to its flying program” in the event of an ash cloud.
More information:
Icelandic Meteorological Office: en.vedur.is/
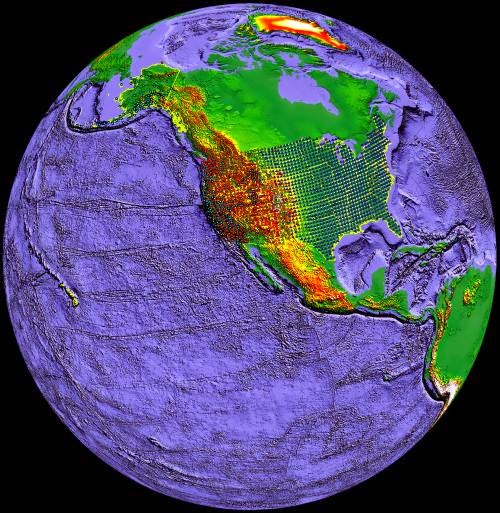
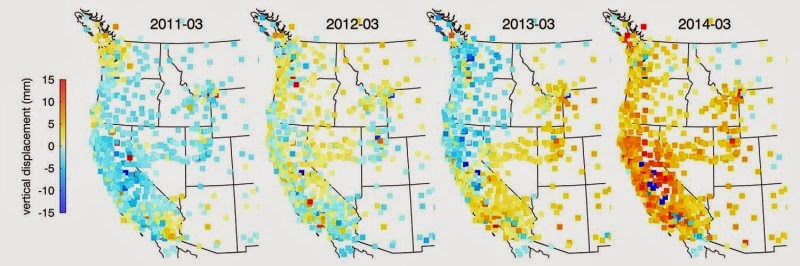
Maps of GPS points in the western United States, with blue indicating a drop and yellow-red reflecting a rise. Credit: Image courtesy of University of California – San Diego
The severe drought gripping the western United States in recent years is changing the landscape well beyond localized effects of water restrictions and browning lawns. Scientists at Scripps Institution of Oceanography at UC San Diego have now discovered that the growing, broad-scale loss of water is causing the entire western U.S. to rise up like an uncoiled spring.
Investigating ground positioning data from GPS stations throughout the west, Scripps researchers Adrian Borsa, Duncan Agnew, and Dan Cayan found that the water shortage is causing an “uplift” effect up to 15 millimeters (more than half an inch) in California’s mountains and on average four millimeters (0.15 of an inch) across the west. From the GPS data, they estimate the water deficit at nearly 240 gigatons (62 trillion gallons of water), equivalent to a six-inch layer of water spread out over the entire western U.S.
Adrian Borsa, an assistant research geophysicist at Scripps Institution of Oceanography, UC San Diego.
Results of the study, which was supported by the U.S. Geological Survey (USGS), appear in the August 21 online edition of the journal Science.
While poring through various sets of data of ground positions from highly precise GPS stations within the National Science Foundation’s Plate Boundary Observatory and other networks, Borsa, a Scripps assistant research geophysicist, kept noticing the same pattern over the 2003-2014 period: All of the stations moved upwards in the most recent years, coinciding with the timing of the current drought.
Agnew, a Scripps Oceanography geophysics professor who specializes in studying earthquakes and their impact on shaping Earth’s crust, says the GPS data can only be explained by rapid uplift of the tectonic plate upon which the western U.S. rests (Agnew cautions that the uplift has virtually no effect on the San Andreas fault and therefore does not increase the risk of earthquakes).
For Cayan, a research meteorologist with Scripps and USGS, the results paint a new picture of the dire hydrological state of the west.
“These results quantify the amount of water mass lost in the past few years,” said Cayan. “It also represents a powerful new way to track water resources over a very large landscape. We can home in on the Sierra Nevada mountains and critical California snowpack. These results demonstrate that this technique can be used to study changes in fresh water stocks in other regions around the world, if they have a network of GPS sensors.”
The study was supported by USGS National Earthquake Hazards Reduction Program.
Journal Reference:
Adrian Antal Borsa, Duncan Carr Agnew, and Daniel R. Cayan. Ongoing drought-induced uplift in the western United States. Science, 21 August 2014 DOI: 10.1126/science.1260279
Note : The above story is based on materials provided by University of California – San Diego.
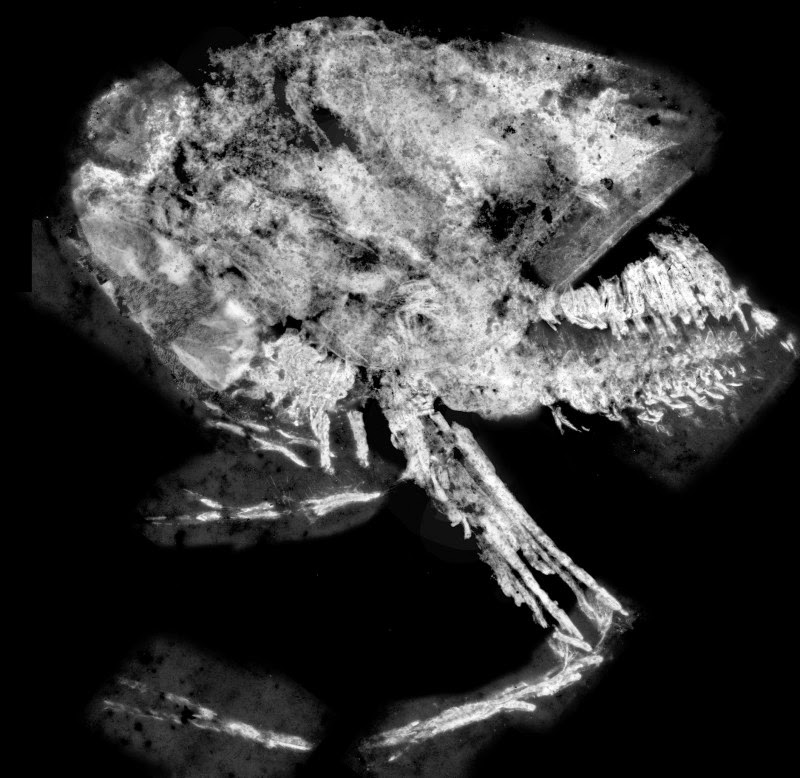
Jurassic thylacocephalan Clausocaris lithographica. Credit: Haug et al. 2014
A new species of carnivorous crustacean has been identified, which roamed the seas 435 million years ago, grasping its prey with spiny limbs before devouring it. The fossil is described and details of its lifestyle are published in the open access journal BMC Evolutionary Biology.
The fossils were discovered near Waukesha, Wisconsin, with the new species, Thylacares brandonesis, named after the Brandon Bridge Formation where it was found. It is the oldest known example of the Thylacocephala group — shrimp-like creatures, mostly from the Jurassic period, known for their bulbous eyes and multiple limbs. The muscle structure and leg morphology of the new species suggests that it used its long, claw-like appendages to catch prey in a similar way to modern remipedes, blind crustaceans still found in salt water-filled caves.
Derek Briggs, Yale University, says: “This new research extends the range of this enigmatic group of fossil arthropods back to the Silurian, some 435 million years ago, and provides evidence that they belong among the crustaceans, the modern group that includes lobsters, shrimps and crabs.”
Carolin Haug, LMU Munich, said: “T. brandonensis was probably an actively hunting predator, which caught the prey with its front claws and crushed it into smaller pieces with the protrusions nearer its mouthparts.”
“This early, Silurian, example of Thylacocephala is in many ways much less extreme than the more recent Jurassic species. It still has normal-sized eyes in contrast to the very enlarged ones that came later, and shorter front claws in T. brandonensis compared to the extremely elongated ones in more recent Jurassic representatives.”
The description of the new Silurian species was part of a wider investigation into this group of fossils, including several new Jurassic specimens. Modern imaging techniques allowed the scientists to visualise new features, such as the tiny details of the T. brandonensis muscle structure. Based on these images, they created 3D models of the new species, which help us to understand the creature’s life habits.
Journal Reference:
Carolin Haug, Derek E G Briggs, Donald G Mikulic, Joanne Kluessendorf, Joachim T Haug. The implications of a Silurian and other thylacocephalan crustaceans for the functional morphology and systematic affinities of the group. BMC Evolutionary Biology, 2014; 14 (1): 159 DOI: 10.1186/s12862-014-0159-2
Note : The above story is based on materials provided by BioMed Central.
The San Andreas Fault is a continental transform fault that runs a length of roughly 810 miles (1,300 km) through California in the United States. The fault’s motion is right-lateral strike-slip (horizontal motion). It forms the tectonic boundary between the Pacific Plate and the North American Plate
The fault was first identified in Northern California by UC Berkeley geology professor Andrew Lawson in 1895 and named by him after a small lake which lies in a linear valley formed by the fault just south of San Francisco, the Laguna de San Andreas. After the 1906 San Francisco Earthquake, Lawson also discovered that the San Andreas Fault stretched southward into southern California. Large-scale (hundreds of miles) lateral movement along the fault was first proposed in a 1953 paper by geologists Mason Hill and Thomas Dibblee
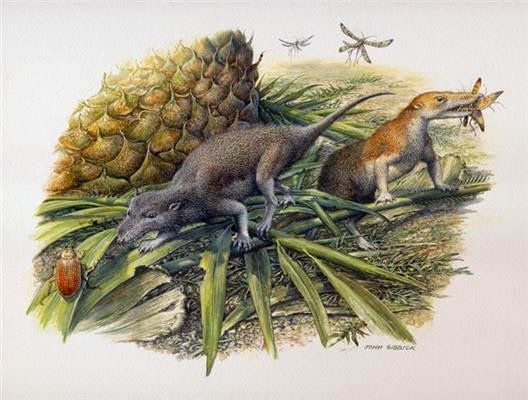
Morganucodon and Kuehneotherium. Credit: Pamela Gill
New analyses of tiny fossil mammals from Glamorgan, South Wales are shedding light on the function and diets of our earliest ancestors, a team including researchers from the University of Southampton report today in the journal Nature. Mammals and their immediate ancestors from the Jurassic period (201-145 million years ago) developed new characteristics — such as better hearing and teeth capable of precise chewing.
By analysing jaw mechanics and fossil teeth, the team were able to determine that two of the earliest shrew-sized mammals, Morganucodon and Kuehneotherium, were not generalised insectivores but had already evolved specialised diets, feeding on distinct types of insects.
Lead author, Dr Pamela Gill of the University of Bristol, said: “None of the fossils of the earliest mammals have the sort of exceptional preservation that includes stomach contents to infer diet, so instead we used a range of new techniques which we applied to our fossil finds of broken jaws and isolated teeth. Our results confirm that the diversification of mammalian species at the time was linked with differences in diet and ecology.”
The team used synchrotron X-rays and CT scanning to reveal in unprecedented detail the internal anatomy of these tiny jaws, which are only 2cm in length. As the jaws are in many pieces, the scans were ‘stitched together’ to make a complete digital reconstruction. Finite element modelling, the same technique used to design hip joints and bridges, was used to perform a computational analysis of the strength of the jaws. This showed that Kuehneotherium and Morganucodon had very different abilities for catching and chewing prey.
Study co-author, Dr Neil Gostling from the University of Southampton, said: “The improvement in CT scanning, both in the instrumentation, at Light Source at the Paul Scherrer Institute in Switzerland where we scanned or even the µ-VIS Centre at Southampton, along with access for research of this kind, allows us to make inroads into understanding the biology and the ecology of animals long dead. The questions asked of the technology do not produce ‘speculation’, rather the results show a clearly defined answer based on direct comparison to living mammals. This would not be possible without the computational techniques we have used here.”
Using an analysis previously carried out on the teeth of present-day, insect-eating bats, the researchers found that the teeth of Morganucodon and Kuehneotherium had very different patterns of microscopic pits and scratches, known as ‘microwear’. This indicated they were eating different things with Morganucodon favouring harder, crunchier food items such as beetles while Kuehneotherium selected softer foods such as scorpion flies which were common at the time.
Team leader, Professor Emily Rayfield from the University of Bristol, added: “This study is important as it shows for the first time that the features that make us unique as mammals, such as having only one set of replacement teeth and a specialised jaw joint and hearing apparatus, were associated with the very earliest mammals beginning to specialise their teeth and jaws to eat different things.”
Note : New analyses of tiny fossil mammals from Glamorgan, South Wales are shedding light on the function and diets of our earliest ancestors, a team including researchers from the University of Southampton report today in the journal Nature. Mammals and their immediate ancestors from the Jurassic period (201-145 million years ago) developed new characteristics — such as better hearing and teeth capable of precise chewing.
By analysing jaw mechanics and fossil teeth, the team were able to determine that two of the earliest shrew-sized mammals, Morganucodon and Kuehneotherium, were not generalised insectivores but had already evolved specialised diets, feeding on distinct types of insects.
Lead author, Dr Pamela Gill of the University of Bristol, said: “None of the fossils of the earliest mammals have the sort of exceptional preservation that includes stomach contents to infer diet, so instead we used a range of new techniques which we applied to our fossil finds of broken jaws and isolated teeth. Our results confirm that the diversification of mammalian species at the time was linked with differences in diet and ecology.”
The team used synchrotron X-rays and CT scanning to reveal in unprecedented detail the internal anatomy of these tiny jaws, which are only 2cm in length. As the jaws are in many pieces, the scans were ‘stitched together’ to make a complete digital reconstruction. Finite element modelling, the same technique used to design hip joints and bridges, was used to perform a computational analysis of the strength of the jaws. This showed that Kuehneotherium and Morganucodon had very different abilities for catching and chewing prey.
Study co-author, Dr Neil Gostling from the University of Southampton, said: “The improvement in CT scanning, both in the instrumentation, at Light Source at the Paul Scherrer Institute in Switzerland where we scanned or even the µ-VIS Centre at Southampton, along with access for research of this kind, allows us to make inroads into understanding the biology and the ecology of animals long dead. The questions asked of the technology do not produce ‘speculation’, rather the results show a clearly defined answer based on direct comparison to living mammals. This would not be possible without the computational techniques we have used here.”
Using an analysis previously carried out on the teeth of present-day, insect-eating bats, the researchers found that the teeth of Morganucodon and Kuehneotherium had very different patterns of microscopic pits and scratches, known as ‘microwear’. This indicated they were eating different things with Morganucodon favouring harder, crunchier food items such as beetles while Kuehneotherium selected softer foods such as scorpion flies which were common at the time.
Team leader, Professor Emily Rayfield from the University of Bristol, added: “This study is important as it shows for the first time that the features that make us unique as mammals, such as having only one set of replacement teeth and a specialised jaw joint and hearing apparatus, were associated with the very earliest mammals beginning to specialise their teeth and jaws to eat different things.”
Note : The above story is based on materials provided by University of Southampton.
A new ovoid structure discovered in the Nakhla Martian meteorite is made of nanocrystalline iron-rich clay, contains a variety of minerals, and shows evidence of undergoing a past shock event from impact, with resulting melting of the permafrost and mixing of surface and subsurface fluids.
Based on the results of a broad range of analytical studies to determine the origin of this new structure, scientists present the competing hypotheses for how this ovoid formed, point to the most likely conclusion, and discuss how these findings impact the field of astrobiology in a fascinating article published in Astrobiology, a peer-reviewed journal from Mary Ann Liebert, Inc., publishers.
In the article, “A Conspicuous Clay Ovoid in Nakhla: Evidence for Subsurface Hydrothermal Alteration on Mars with Implications for Astrobiology,” Elias Chatzitheodoridis, National Technical University of Athens, Greece, and Sarah Haigh and Ian Lyon, the University of Manchester, UK, describe the use of tools including electron microscopy, x-ray, and spectroscopy to analyze the ovoid structure. While the authors do not believe the formation of this structure involved biological materials, that is a possible hypothesis, and they note that evidence exists supporting the presence of niche environments in the Martian subsurface that could support life.
“This study illustrates the importance of correlating different types of datasets when attempting to discern whether something in rock is a biosignature indicative of life,” says Sherry L. Cady, PhD, Editor-in-Chief of Astrobiology and Chief Scientist at the Pacific Northwest National Laboratory. “Though the authors couldn’t prove definitively that the object of focus was evidence of life, their research strategy revealed a significant amount of information about the potential for life to inhabit the subsurface of Mars.”
Journal Reference:
Elias Chatzitheodoridis, Sarah Haigh, Ian Lyon. A Conspicuous Clay Ovoid in Nakhla: Evidence for Subsurface Hydrothermal Alteration on Mars with Implications for Astrobiology. Astrobiology, 2014; 14 (8): 651 DOI: 10.1089/ast.2013.1069
Note : The above story is based on materials provided by Mary Ann Liebert, Inc., Publishers.
A new study provides an exciting insight into the Late Cretaceous and the diversity and distribution of the toothless ‘dragon’ pterosaurs from the Azhdarchidae family. The research was published in the open access journal ZooKeys.
The Azhdarchidan pterosaurs derive their name from the Persian word for dragon — Aždarha. Interestingly, this derived and rather successful group of pterosaurs included some of the largest known flying animals of all times, with a wingspan reaching between 10 and 12 m.
‘Dragon’ pterosaurs had a worldwide distribution once and were the last of their kind to survive on the planet, until some 60 mya. They dominated the skies during the Late Cretaceus and unlike their predecessors, were characteristically toothless.
“This shift in dominance from toothed to toothless pterodactyloids apparently reflects some fundamental changes in Cretaceous ecosystems, which we still poorly understand,” comments the author of the study Dr Alexander Averianov, Zoological Institute of the Russian Academy of Sciences.
Generally fossil record of pterosaurs is patchy and confined mostly to sedimentary deposits known as Konservat-Lagerstätten where exceptional depositional conditions facilitated preservation of fragile pterosaur bones. Unfortunately, such Lagerstätten are very rare for the Late Cretaceous when most of the evolutionary history of Azhdarchidae took place, which makes these exciting creatures exceptionally hard to study.
“Azhdarchidae currently represent a real nightmare for paleontologists: most taxa are known from few fragmentary bones, which often do not overlap between named taxa, the few articulated skeletons are poorly preserved, and some of the best available material has remained undescribed for forty years.” explains Dr Averianov about the difficulties studying the group.
Despite these difficulties, the number of localities were azhdarchidan pterosaurs were found is impressive and undoubtedly reflect the important role they played in the Cretaceous ecosystems. These flying giants likely inhabited a large variety of environments, but seem to have been abundant near large lakes and rivers and most common in nearshore marine environments. Note : The above story is based on materials provided by Pensoft Publishers. The original story is licensed under a Creative Commons License.