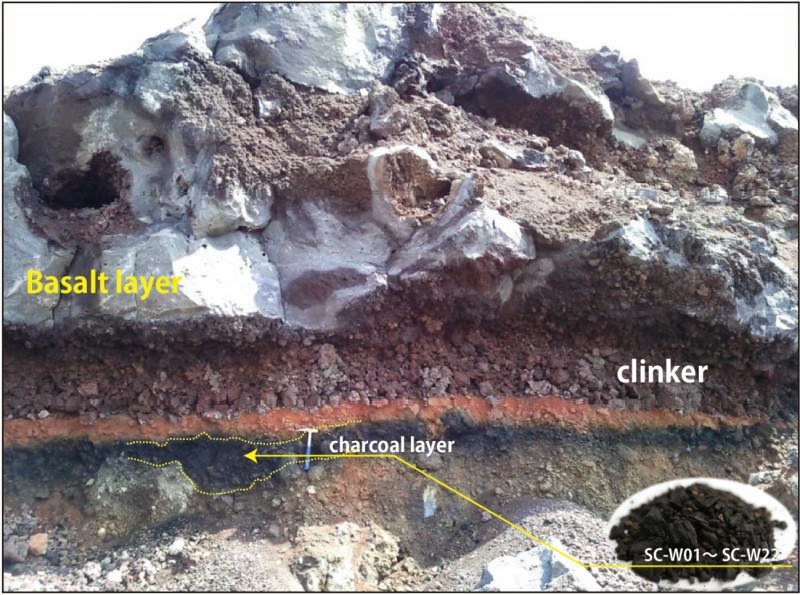
Pictures of the sedimentary layer containing charcoal found on a stony mountain developing site in Sangchang-ri, and the carbonized wood (charcoal) sample used for the radiocarbon dating. Thick lava covers the upper gravel layer. Credit: Image courtesy of Korea Institute of Geoscience and Mineral Resources (KIGAM)
In Jeju, Korea, a place emerging as a world-famous vacation spot with natural tourism resources, a recent study revealed a volcanic eruption occurred on the island. The Korea Institute of Geoscience and Mineral Resources (KIGAM) indicated that there are the traces that indicated that a recent volcanic eruption was evident 5,000 years ago. This is the first time the date of the explosion has been made clear in the region.
The research team led by Dr. Jin-Young Lee confirmed in results from radiocarbon dating for carbonized wood (charcoal) found below the basaltic layer located in Sangchang-ri, Seogwipo-si, Jeju-do it dated back to 5,000 years ago; which means the time when the basalt on the upper layer was formed took place relatively recently, i.e. 5,000 years ago, and which demonstrates that the island has experienced a volcanic eruption fairly recently.
The latest volcanic eruption occurring on Jeju Island was volcanic activity known to have spewed around 7,000 years ago at Mt. Songak. The basaltic layer in Sangchang-ri is known to be formed due to the eruption in the vicinity of Byeongak Oreum 35,000 years ago; though, this study revealed that the layer is a product of the most recent volcanic activity among those known ever. Volcanic activity at Mt. Songak was limited hydro volcanic activity out of which a great deal of volcanic ash was released while it is evident that Sangchang-ri was a dynamic active volcano out of which lava was spewed and then flowed down in all directions along the inland slope.
It is also remarkable that the research team enhanced the accuracy of the findings in the radiocarbon dating technique using carbonized wood, consequently raising the reliability of the findings. Until now, previous research used the dating method for rocks covering the upper sedimentary layer, in which such dating method with the relatively longer half-life period shows limitations in determining the time the basalt was formed about 10,000 years ago.
In order to overcome the limitations of the dating method for the rocks covering the upper sedimentary layer, the research team led by Dr. Jin-Young Lee concurrently used radiocarbon dating and optically stimulated luminescence dating (OSL), using such cross-validation of which raised the accuracy of tracing the past volcanic activities.
Judging from the findings, Jeju Island is not an extinct volcano, but seems to rather be a potentially live volcano because a volcano that has erupted within 10,000 years is defined to be a live volcano on a geological basis.
Not remaining complacent for the findings, the research team plans to continuously conduct the studies on the time the volcanic rocks were formed in several regions on the island in order to identify the latest volcanic activity.
Note : The above story is based on materials provided by Korea Institute of Geoscience and Mineral Resources (KIGAM).
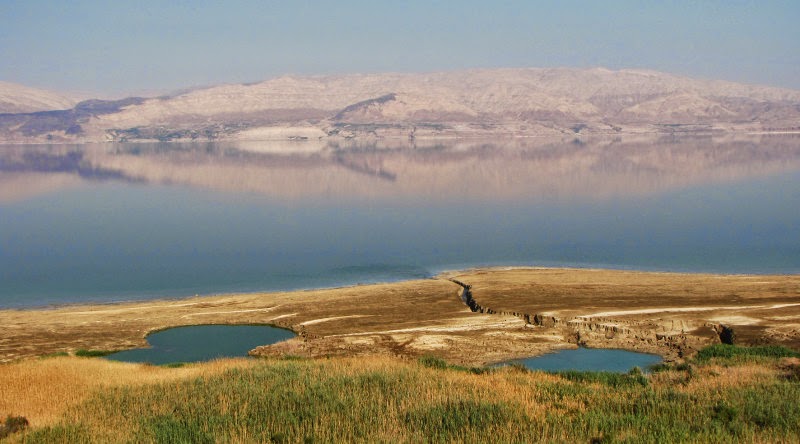
Sinkholes and surface springs in Samar (Western Dead Sea), the Jordan flank of the Dead Sea is visible in the background. Credit: Dr. Christian Siebert/UFZ
The drinking water resources on the eastern, Jordanian side of the Dead Sea could decline severe as a result of climate change than those on the western, Israeli and Palestinian side. This is the conclusion reached by an international team of researchers that calculated the water flows around the Dead Sea. The natural replenishment rate of groundwater will reduce dramatically in the future if precipitation lowers as predicted, say the scientists, writing in the journal Science of the Total Environment. Even now, the available groundwater resources in the region are not sufficient to meet the growing water requirements of the population and agriculture. If the situation worsens, it could therefore have serious social, economic and ecological consequences for the region.
Important data for water providers
A reliable inventory of existing water resources around the Dead Sea, on the border between Israel, Palestine and Jordan, forms the basis for sustainable water management. The lowest lake on earth is not only one of the biggest tourist attractions in the Middle East; more than four million people rely on the groundwater resources in its catchment basin. For a long time, the complex hydrology of this region presented major unknown factors in the local water balance equation. To some extent it still does. Thanks to improved computer simulations, the researchers were able to work out — on an international scale for the first time — how much water actually infiltrates from rainfall and replenishes the groundwater reservoir: around 281 million cubic metres per year. This means that we now also know what the maximum withdrawal limit should be if this resource is to be managed sustainably.
A complicated puzzle with many pieces
Since the 1960s, the majority of the Dead Sea’s tributaries have been dammed to capture the precious water before it disappears into the salt lake. However, this apparent salvaging of water is causing the water level of the Dead Sea to fall by around a metre per year and, with it, the surrounding groundwater levels. Fresh water springs thousands of years old are ebbing away. This much was already known. What was not clear was exactly what impact the retreating water levels have on the quantities of usable groundwater. Over the past five years, the team of researchers from Germany, Israel, Jordan and Palestine working on the SUMAR research project therefore used a combination of comprehensive on-site measurements, remote sensing and computer modelling systems to be able to provide a fairly complete answer to this question.
Tracing the course of the water
The springs in and around the Dead Sea were identified using infra-red sensors on aircraft and satellites, as well as chemical and isotopic methods. “By analysing rare earth elements in particular we were able to trace the origin of the water and the routes it takes underground,” reports Dr Christian Siebert of the Centre for Environmental Research (UFZ). “Not only were we able to locate 37 areas where groundwater flows into the Dead Sea, we now also know the history of each source. This was important for finding out how much fresh water flows into the Dead Sea underground and is therefore no longer available to use as drinking water. The last passage in particular, before the water from the mountains reaches the lake, took us a long time,” says the hydrogeologist. “Here, salt water rising from below mixes with the fresh water, and salt minerals are dissolved in it. But, together with colleagues from the Max Planck Institute in Bremen, we also managed to identify the biogeochemical processes that make permanent changes to the groundwater.”
Computer models calculate the total water balance
In the end, all the available data were fed into computer models that revealed, more accurately than ever before, the situation in the drainage basin in the immediate vicinity of the Dead Sea — an area measuring roughly 7000 square kilometres. The biggest challenges were the heterogeneous distribution of urban areas and the associated gaps in the data. Whereas the number of measuring stations in and around built-up areas like Jerusalem and Amman is very high, there are broad stretches of land that are very sparsely populated and therefore have only few wells and almost no geological or meteorological data. Yet rain is particularly important in this context. The region is characterised by short, heavy downpours that often fall over a very small area. For this reason, the project team set up its own measurement stations so as to be able to measure the flash floods that result from these downpours. A comprehensive flow-measuring station was also set up on the River Jordan near one of the baptismal sites that attract thousands of Christian pilgrims every year.
Bleak forecasts
Using the models, the scientists were able, for the first time, to make predictions about possible future changes in the groundwater resources that are so vital for this region: the western (Israeli-Palestinian) side of the lake receives almost twice as much rainfall as the eastern (Jordanian) side. As a result, groundwater replenishment rates are currently around 50 per cent higher on the western side. Climate scenarios predict a decrease in annual rainfall of around 20 per cent. However, the water that currently ends up underground and replenishes these important groundwater resources would be halved. The decrease on the western Israeli-Palestinian side is expected to be around 45 per cent, whereas the water available for the Jordanian (eastern) side would fall by nearly 55 per cent. The social and economic situation could therefore worsen, in Jordan in particular.
Recycling as a way out of the water crisis
Saving and reusing water could therefore be a solution, and the UFZ researchers are developing this concept further with colleagues from Israel, Palestine and Jordan. For instance, the SMART project researched ways of stabilising water supply in the Middle East. The UFZ developed new concepts for decentralised wastewater treatment and made a significant contribution to the water master plan of Jordan, one of the world’s most arid countries. Great importance was attached to adapting the wastewater treatment concept to local conditions, and to collaborating with local scientists and authorities. A special implementation office was set up in Jordan’s Ministry of Water in Amman.
Ongoing research
Since completion of the SUMAR project, the research has been continued by the Helmholtz centres KIT (Karlsruhe), GFZ (Potsdam), UFZ (Halle) and local partners within the DESERVE (DEad SEa Research VEnue) project. The aim of the meteorologists, hydrogeologists, geologists and geophysicists involved in the project is to look at environmental risks, water availability and climate change as a whole, so as to develop solutions for this unique region, not only so that people will be able to continue to visit the biblical sites, but also so that the people of this region can continue to live there. A stable water supply will therefore play an important role in bringing peace to the Middle East. Whether the region will ever build the canal intended to carry water from the Red Sea to the Dead Sea remains to be seen. Scientists like Christian Siebert are critical of the possible consequences of importing water in this way: “For instance, it is unclear whether the much lighter ocean water will mix with the Dead Sea water, which is ten times more saline, and we cannot be sure what biological and chemical processes will take place.” The impacts on the surrounding groundwater are also disputed. Tilo Arnhold
Note : The above story is based on materials provided by Helmholtz Centre for Environmental Research – UFZ.
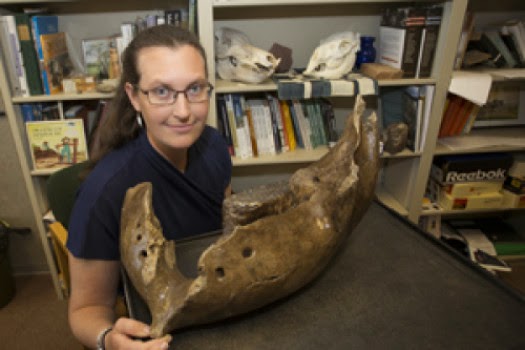
Research led by UC’s Brooke Crowley, posing with this mammoth mandible, has uncovered some interesting ideas about mammoth and mastodon behavior. Credit: Dottie Stover, UC Creative Services
Their scruffy beards weren’t ironic, but there are reasons mammoths and mastodons could have been the hipsters of the Ice Age.
According to research from the University of Cincinnati, the famously fuzzy relatives of elephants liked living in Greater Cincinnati long before it was trendy — at the end of the last ice age. A study led by Brooke Crowley, an assistant professor of geology and anthropology, shows the ancient proboscideans enjoyed the area so much they likely were year-round residents and not nomadic migrants as previously thought.
They even had their own preferred hangouts. Crowley’s findings indicate each species kept to separate areas based on availability of favored foods here at the southern edge of the Last Glacial Maximum’s major ice sheet.
“I suspect that this was a pretty nice place to live, relatively speaking,” Crowley says. “Our data suggest that animals probably had what they needed to survive here year-round.”
Could the past save the future?
Crowley’s research with co-author and recent UC graduate Eric Baumann, “Stable Isotopes Reveal Ecological Differences Among Now-Extinct Proboscideans from the Cincinnati Region, USA,” was recently published in Boreas, an international academic research journal.
Learning more about the different behaviors of these prehistoric creatures could benefit their modern-day cousins, African and Asian elephants. Both types are on the World Wildlife Fund’s endangered species list. Studying how variable different types of elephants might have been in the past, Crowley says, might help ongoing efforts to protect these largest of land mammals from continued threats such as poaching and habitat destruction.
“There are regionally different stories going on,” Crowley says. “There’s not one overarching theme that we can say about a mammoth or a mastodon. And that’s becoming more obvious in studies people are doing in different places. A mammoth in Florida did not behave the same as one in New York, Wyoming, California, Mexico or Ohio.”
The wisdom in teeth
For their research, Crowley and Baumann looked to the wisdom in teeth — specifically museum specimens of molars from four mastodons and eight mammoths from Southwestern Ohio and Northwestern Kentucky. Much can be revealed by carefully drilling a tooth’s surface and analyzing the stable carbon, oxygen and strontium isotopic signatures in the powdered enamel.
Each element tells a different story. Carbon provides insight into an animal’s diet, oxygen relates to overall climatic conditions of an animal’s environment and strontium indicates how much an animal may have traveled at the time its tooth was forming.
“Strontium reflects the bedrock geology of a location,” Crowley says. “So if a local animal grows its tooth and mineralizes it locally and dies locally, the strontium isotope ratio in its tooth will reflect the place where it lived and died. If an animal grows its tooth in one place and then moves elsewhere, the strontium in its tooth is going to reflect where it came from, not where it died.”
Their analysis allowed them to determine several things:
Mammoths ate more grasses and sedges than mastodons, which favored leaves from trees or shrubs.
Strontium from all of the animals (except one mastodon) matched local water samples, meaning they likely were less mobile and migratory than previously thought.
Differences in strontium and carbon between mammoths and mastodons suggest they didn’t inhabit the same localities.
Mammoths preferred to be closer to the retreating ice sheet where grasses were more abundant, whereas mastodons fed farther from the ice sheet in more forested habitat.
“As a geologist, questioning the past is one of the most interesting and exciting things to do,” says Baumann, an environmental geologist with a contractor for the U.S. Environmental Protection Agency. “Based on our data, mammoths and mastodons seemed to have different diets and lived in different areas during their lives. This is important because it allows us to understand how species in the past lived and interacted. And the past is the key to the present.”
Note : The above story is based on materials provided by University of Cincinnati. The original article was written by Tom Robinette
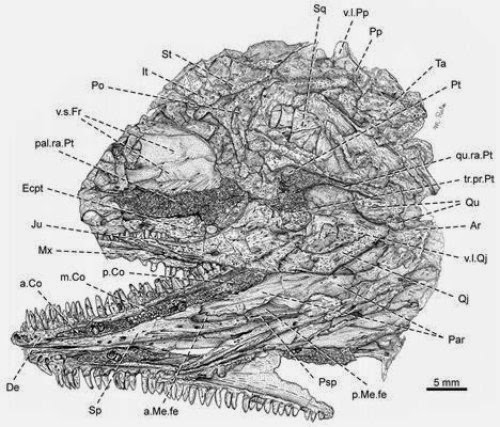
Cranial reconstruction of Gephyrostegus bohemicus. Credit: Image courtesy of University of Lincoln
Paleontologists from the Natural History Museum and academics from Lincoln, Cambridge and Solvakia have recreated the cranial structure of a 308-million-year-old lizard-like vertebrate that could be the earliest example of a reptile and explain the origin of all vertebrates that belong to reptiles, birds and mammals.
Dr Marcello Ruta, from the School of Life Sciences, University of Lincoln, UK, was one of the authors of the paper which is published in the Journal of Vertebrate Paleontology and produced a series of intricate hand-drawn recreations of the cranial structure of Gephyrostegus.
Paleontologists have provided a new cranial reconstruction of a long-extinct limbed vertebrate (tetrapod) from previously unrecognised specimens found in coal deposits from the Czech Republic.
The team of academics reviewed the cranial structural features of the Late Carboniferous Gephyrostegus bohemicus — a small animal of generally lizard-like build that lived 308 million years ago.
This early tetrapod could be the earliest example of a reptile and explain the origin of amniotes, all vertebrates that belong to reptiles, birds and mammals.
Experts from, Comenius University in Bratislava (Slovakia), University Museum of Zoology in Cambridge, The Natural History Museum in London, and the University of Lincoln, UK, have been able to study additional specimens unavailable in previous works.
Their aim was to provide an analysis of early tetrapod relationships incorporating their new observations of Gephyrostegus. Their analysis used skeletal traits across a sample of early tetrapod groups to identify the likely affinities of Gephyrostegus.
Their results are detailed in the Journal of Vertebrate Paleontology.
Dr Marcello Ruta, from the School of Life Sciences, University of Lincoln, UK, was one of the authors and produced a series of intricate hand-drawn recreations of the cranial structure of Gephyrostegus.
He explained: “Gephyrostegus has always been an elusive beast. Several researchers have long considered the possibility that the superficially reptile-like features of this animal might tell us something about amniote ancestry. But Gephyrostegus also shows some much generalised skeletal features that make the issue of its origin even more problematic. We conducted a new study that brings together data from a large number of early tetrapods. The study shows that Gephyrostegus is closely related to another group of Eurasiatic and North American tetrapods called seymouriamorphs, also involved in debates about amniote ancestry. We found some interesting new cranial features in Gephyrostegus that helped us establish this link.
“Staring at specimens for a long time down a microscope and trying to make sense of their anatomy may be frustrating and tiring at times, but always immensely rewarding.”
Note : The above story is based on materials provided by University of Lincoln.
Planet Earth. New research shows the vital role of oceans in moderating climate on Earth-like planets. The presence of oceans is vital for optimal climate stability and habitability, according to a new article. Credit: NASA/ GSFC/ NOAA/ USGS
Researchers at the University of East Anglia have made an important step in the race to discover whether other planets could develop and sustain life.
New research published today in the journal Astrobiology shows the vital role of oceans in moderating climate on Earth-like planets.
Until now, computer simulations of habitable climates on Earth-like planets have focused on their atmospheres. But the presence of oceans is vital for optimal climate stability and habitability.
The research team from UEA’s schools of Mathematics and Environmental Sciences created a computer simulated pattern of ocean circulation on a hypothetical ocean-covered Earth-like planet. They looked at how different planetary rotation rates would impact heat transport with the presence of oceans taken into account.
Prof David Stevens from UEA’s school of Maths said: “The number of planets being discovered outside our solar system is rapidly increasing. This research will help answer whether or not these planets could sustain alien life.
“We know that many planets are completely uninhabitable because they are either too close or too far from their sun. A planet’s habitable zone is based on its distance from the sun and temperatures at which it is possible for the planet to have liquid water.
“But until now, most habitability models have neglected the impact of oceans on climate.
“Oceans have an immense capacity to control climate. They are beneficial because they cause the surface temperature to respond very slowly to seasonal changes in solar heating. And they help ensure that temperature swings across a planet are kept to tolerable levels.
“We found that heat transported by oceans would have a major impact on the temperature distribution across a planet, and would potentially allow a greater area of a planet to be habitable.
“Mars for example is in the sun’s habitable zone, but it has no oceans — causing air temperatures to swing over a range of 100OC. Oceans help to make a planet’s climate more stable so factoring them into climate models is vital for knowing whether the planet could develop and sustain life.
“This new model will help us to understand what the climates of other planets might be like with more accurate detail than ever before.”
‘The Importance of Planetary Rotation Period for Ocean Heat Transport’ is published in the journal Astrobiology on Monday, July 21, 2014. The research was funded by the Engineering and Physical Sciences Research Council (EPSRC).
Note : The above story is based on materials provided by University of East Anglia.
Hawaii Volcanoes National Park National Park Service
(Reuters) – Experts have mapped a huge magma reservoir below Mount Rainier in Washington state that begins melting deep in the Earth’s mantle before pushing upwards to where it will eventually be tapped for eruption.
Researchers from the United States and Norway used seismic imaging and the measurement of variations in electrical and magnetic fields to create a detailed road map of the pathway molten rock takes to the surface.
Their findings, published this week in the journal Nature, are aimed at helping experts understand the volcano’s inner workings, and eventually determine when it might again erupt.
A state landmark, Mount Rainier last erupted in the 19th century. It is widely expected to erupt again, according to the U.S. National Park Service.
The tallest volcano and fifth-highest peak in the contiguous United States, it towers some 14,410-feet (4,392 meters) about 58 miles (93 km) southeast of Seattle, from most of which it is visible.
Phil Wannamaker, a geophysicist at the University of Utah, said the new images were most detailed to date, but that they did not provide any information on the timing of future eruptions by Mount Rainier or other Cascade Range volcanoes.
The volcano’s magma forms deep in the Earth’s mantle, the layer between the planet’s crust and its core. The magma, which is fluid molten rock, then flows upwards to a pool about five miles (8 km) below the peak, the study found.
The pool appears to be about 5 to 10 miles (8 km to 16 km) thick and the same width, the researchers said.
Note : The above story (Reporting by Victoria Cavaliere; Editing by Daniel Wallis and Eric Walsh)
The hazard posed by large earthquakes is difficult to estimate because they often occur hundreds to thousands of years apart. Because written records for the Puget Lowland of northwestern Washington cover less than 170 years, the size and frequency of the largest and oldest earthquakes on the Seattle and Tacoma faults are unknown. Past earthquakes can only be estimated through geologic studies of sediments and landforms that are created when faults break the ground surface.
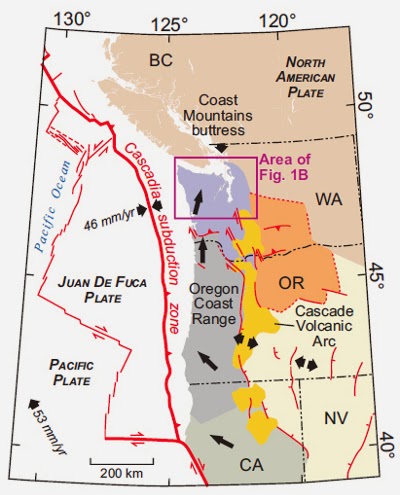
Along the Cascadia margin, the cities of Seattle and Tacoma occupy the Puget Lowland, a structurally complex, seismically active forearc trough between the Coast Range and the Cascade volcanic arc. Deformation of the lowland is caused by the clockwise motion of western Oregon, pushing northward and compressing western Washington against slower moving Canada. Much of the north- to northeast-directed strain in the southern Puget Lowland is accommodated by deformation in the Seattle fault zone, the Tacoma fault zone, the Saddle Mountain deformation zone, and along the Olympia fault.
In their paper for GEOSPHERE, published online 25 June 2014, Alan R. Nelson and colleagues write that although in 1992 a very large earthquake on the Seattle fault was dated to a thousand years ago, the size and frequency of earlier earthquakes on active faults of the southern Puget Lowland remains uncertain. Through a synthesis of earlier geologic data with new field evidence of earthquake faulting at nine sites on the Seattle and Tacoma faults, Nelson and colleagues show that four or five earthquakes large enough to break the ground surface occurred on the Seattle fault or related faults during the past 3,500 years.
More information:
“Diverse rupture modes for surface-deforming upper plate earthquakes in the southern Puget Lowland of Washington State.” Alan R. Nelson et al., Geologic Hazards Science Center, U.S. Geological Survey, MS 966, PO Box 25046, Denver, Colorado 80225, USA. Published online 25 June 2014; dx.doi.org/10.1130/GES00967.1
Note : The above story is based on materials provided by Geological Society of America
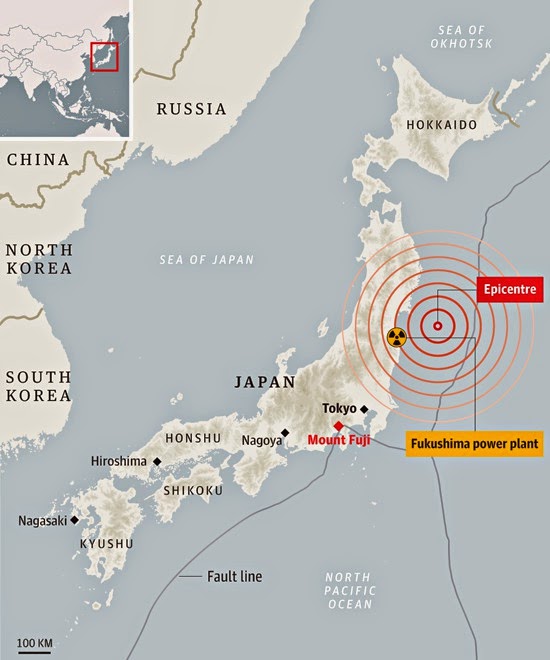
Proximity of Mount Fuji to the epicentre of the March 2011 earthquake. Christine Oliver/Guardian Source: Le Monde
Mount Fuji, or Fujisan as it is known in Japanese, is the highest point on the archipelago (rising to 3,776 metres) and the national emblem, immortalised in countless etchings. In June last year Unesco added it to the World Heritage list as a “sacred place and source of artistic inspiration”. But it is still an active volcano, standing at the junction between the Pacific, Eurasian and Philippine tectonic plates. Though it has rarely stirred in recorded history, it is still potentially explosive.
The Tohoku – or Great East Japan – earthquake on 11 March 2011 triggered a devastating tsunami, which in turn caused the Fukushima Daiichi nuclear disaster. According to a Franco-Japanese study published by Science (PDF), the magnitude-9 tremor also increased the pressure on Mount Fuji. “Our work does not say that the volcano will start erupting, but it does show that it’s in a critical state,” says Florent Brenguier, a researcher at the Institute of Earth Sciences (IST) in Grenoble, France, and lead author of the publication, to which the Institute of Global Physics (IPG) in Paris also contributed.
Adopting a novel approach, the scientists carried out a sort of giant echo-scan of the bowels of the Earth, based on the huge mass of data recorded after the mega-quake by Japan’s Hi-net system, the densest network in the world, with 800 seismic sensors. They focused on signals commonly known as seismic noise, the result of constant interaction between ocean swell and “solid” earth. In the past such data has generally been dismissed as background interference.
By recording fluctuations in this barely perceptible subterranean noise they were able to map geological disturbances in the bedrock of Japan caused by the seismic waves following the violent quake in March 2011. “Seismic waves travel a very long way, going round the world several times,” Brenguier explains. “Their movement makes the Earth’s crust vibrate, and rather like a shock wave this produces breaks or cracks in the rock.”
One might well imagine that such disturbance is greatest close to the epicentre of a quake, but this is not the case. The Franco-Japanese study shows that the area where the Earth’s crust suffered the greatest damage was not around Tohoku, in the north-east of Honshu island, but in the volcanic regions, in particular under Mount Fuji, some 400km away. “The volcanic regions are the ones where the fluids trapped in the rock – boiling water, gas, liquid magma, which cause an eruption when they rise to the surface – exert the greatest pressure. The seismic waves add to this pressure, causing even more disturbance,” Brenguier says.
The magnitude 6.4 quake that occurred four days after the tsunami, followed by many smaller aftershocks, was a further indication that Mount Fuji is under high pressure.
So should Japan be on red alert? “We cannot establish a direct relation of cause and effect between quakes and volcanic eruptions, even if statistically the former lead to an increase in the latter,” Brenguier says. “All we can say is that Mount Fuji is now in a state of pressure, which means it displays a high potential for eruption. The risk is clearly higher.”
Science, however, has no way of predicting when this might happen. But there is a precedent. The last eruption of Mount Fuji occurred in 1707. It projected almost a billion cubic metres of ash and debris into the atmosphere, some of which reached Tokyo (then called Edo) 100km away. It was preceded, 49 days earlier, by a magnitude 8.7 quake to the south of Japan that, in conjunction with the tidal wave it raised, claimed more than 5,000 lives. This time, more than three years have already passed since the Tohoku quake. But that does not mean that Mount Fuji, under the constant supervision of Japanese geologists, is slumbering.
Come what may, the method developed by the Franco-Japanese team for investigating volcanic areas should improve the accuracy of efforts all over the world to assess the risk of major volcanic eruptions.
This story appeared in Guardian Weekly, which incorporates material from Le Monde
Note : The above story is based on materials provided by Pierre Le Hir “Guardian Weekly”
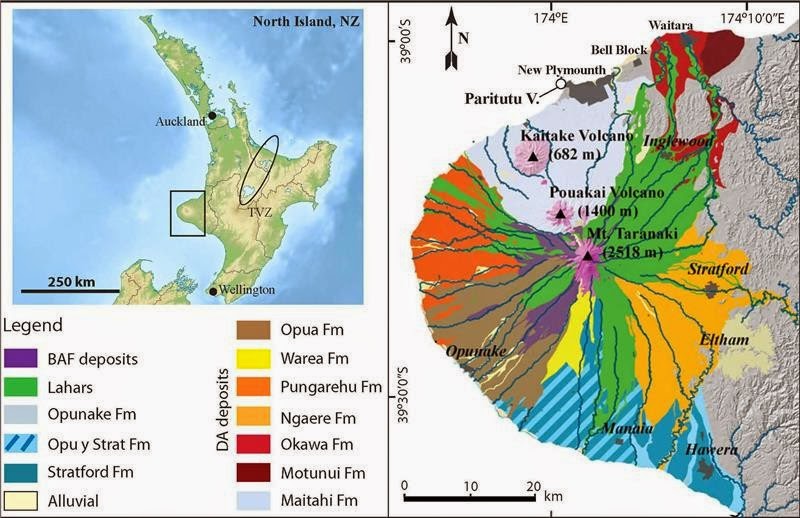
Location map of the Taranaki peninsula and distribution of debris avalanche deposits surrounding Taranaki volcano, New Zealand. Credit: Image courtesy of Geological Society of America
Volcanic hazards aren’t limited to eruptions. Debris avalanche landslides can also cause a great deal of damage and loss of life. Stratovolcanoes, with their steep, conical shapes made up of lava and unconsolidated mixed materials, can reach a critical point of instability when they overgrow their flanks. This leads to partial collapse, and the product of this slope failure is a large-scale, rapid mass movement known as a catastrophic landslide or debris avalanche.
In a matter of minutes, a debris avalanche can drastically modify the shape and nature of the surrounding landscape, covering extensive areas (in this case, up to 27 kilometers away) and changing the normal water drainage system of the region.
About 25 thousand years ago, the biggest slope failure event known at Taranaki volcano, New Zealand, resulted in the Pungarehu debris avalanche deposit (DAD). Initial collapse of the proto-Taranaki volcano occurred near the Last Glacial Maximum, with snow and ice cover and substantial groundwater present. The collapsing, sliding, large blocks of edifice material, known as “megaclasts,” were highly fractured by the landslide generation and the depressurization event, forming pervasive jigsaw textures.
This study by scientists from Brazil, Mexico, and New Zealand provides a textural analysis of the unique features of this landslide. The authors examine grain sizes, sedimentary structures, and microscopic particle attributes and provide new insights into debris avalanche transport and internal evolution processes.
Their findings help to explain the formation of the highly irregular topography of debris avalanche deposits, with chaotically distributed (and probably temporary) zones of shear developing where softer lithologies occur in a collapsing mass, thus leading to differential velocity profiles of portions of the flowing mass in vertical and horizontal planes.
The authors write that their goal is not only to provide new insight concerning the transport and emplacement mechanisms of Pungarehu DAD, but to also improve understanding giant debris avalanche deposits worldwide.
Note : The above story is based on materials provided by Geological Society of America.
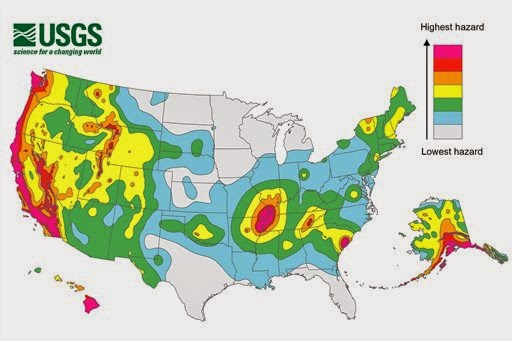
This undated handout image provided by the US Geological Survey (USGS) shows an updated federal earthquake risk map. A new map dials up the shaking hazard just a bit for about half of the US and lowers it for nearly a quarter of the nation. The U.S. Geologic Survey updated Thursday its national seismic hazard maps for the first time since 2008, taking into account research from the devastating 2011 earthquake and tsunami off the Japanese coast and the surprise 2011 Virginia temblor. (AP Photo/USGS)
A new federal earthquake map dials up the shaking hazard just a bit for about half of the United States and lowers it for nearly a quarter of the nation.
The U.S. Geologic Survey updated Thursday its national seismic hazard maps for the first time since 2008, taking into account research from the devastating 2011 earthquake and tsunami off the Japanese coast and the surprise 2011 Virginia temblor.
Most of the changes are slight. Project chief Mark Petersen said parts of Washington, Oregon, Utah, Oklahoma, Colorado, Wyoming and Tennessee moved into the top two hazard zones.
Parts of 16 states have the highest risk for earthquakes: Alaska, Hawaii, California, Oregon, Washington, Nevada, Utah, Idaho, Montana, Wyoming, Missouri, Arkansas, Tennessee, Illinois, Kentucky and South Carolina.
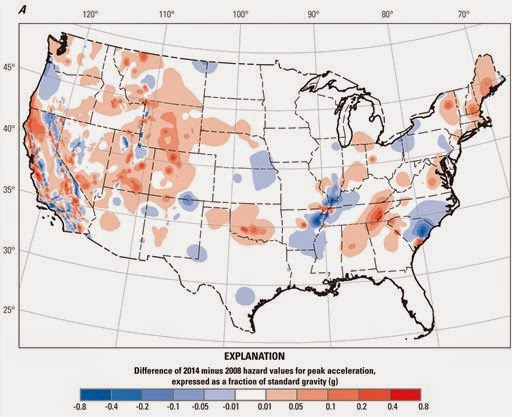
This undated handout image provided by the US Geological Survey (USGS) shows where the earthquake hazard increased and decreased from 2008. Red/brown increased. Blue decreased. A new federal earthquake risk map dials up the shaking hazard just a bit for about half of the United States and lowers it for nearly a quarter of the nation. The U.S. Geologic Survey updated Thursday its national seismic hazard maps for the first time since 2008, taking into account research from the devastating 2011 earthquake and tsunami off the Japanese coast and the surprise 2011 Virginia temblor. (AP Photo/USGS)
University of Maine oceanographer Ivona Cetinic is participating in a NASA project to advance space-based capabilities for monitoring microscopic plants that form the base of the marine food chain.
Phytoplankton—tiny ocean plants that absorb carbon dioxide and deliver oxygen to Earth’s atmosphere—are key to the planet’s health. And NASA wants a clear, global view of them.
NASA’s Ship-Aircraft Bio-Optical Research (SABOR) mission will bring together marine and atmospheric scientists to tackle optical issues associated with satellite observations of phytoplankton.
The goal is to better understand marine ecology and phytoplankton’s major role in the global cycling of atmospheric carbon between the ocean and the atmosphere.
“Teams involved in this project are working together to develop next-generation tools that will change forever how we study oceans,” says Cetinic, a research associate at UMaine’s Darling Marine Center (DMC) in Walpole, Maine.
“Methods that will be developed during this experiment are something like 3-D glasses. They will allow us to see more details on the surface of the ocean and to see deeper into the ocean, helping us learn more about carbon in the ocean—carbon that is fueling oceanic ecosystems, as well as the fisheries and aquaculture.”
Cetinic will be a chief scientist aboard RV Endeavor that departs July 18 from Narragansett, Rhode Island. She received $1,043,662 from NASA’s Ocean Biology and Biogeochemistry program for her part in the three-year project.
Cetinic’s crew, which includes Wayne Slade of Sequoia Scientific, Inc., Nicole Poulton of Bigelow Laboratory for Ocean Sciences and UMaine Ph.D. student Alison Chase, will analyze water samples for carbon, as well as pump seawater continuously through on-board instruments to measure how ocean particles, including phytoplankton, interact with light.
Chase, who recently earned her master’s in oceanography at UMaine, will blog about the experience at earthobservatory.nasa.gov/blogs/fromthefield.
Interim DMC director Mary Jane Perry, who is participating in another research cruise this summer, will be involved in future data analysis.
Mike Behrenfeld of Oregon State University also will be aboard Endeavor and he and his team will use a new technique to directly measure phytoplankton biomass and photosynthesis.
“The goal is to develop mathematical relationships that allow scientists to calculate the biomass of the phytoplankton from optical signals measured from space, and thus to be able to monitor how ocean phytoplankton change from year to year and figure out what causes these changes,” he says.
Another research team also will be aboard Endeavor, which for three weeks will cruise through a range of ecosystems between the East Coast and Bahamas.
Alex Gilerson of City College of New York will lead a crew that will operate an array of instruments, including an underwater video camera equipped with polarization vision. It will continuously measure key characteristics of the sky and the water.
The measurements taken from aboard the ship will provide an up-close perspective and validate measurements taken simultaneously by scientists in aircraft.
NASA’s UC-12 airborne laboratory, based at NASA’s Langley Research Center in Hampton, Virginia, will make coordinated science flights beginning July 20.
One obstacle in observing marine ecosystems from space is that atmospheric particles interfere with measurements. Brian Cairns of NASA’s Goddard Institute for Space Studies in New York will lead an aircraft team with a polarimeter instrument to address the issue.
From an altitude of about 30,000 feet, the instrument will measure properties of reflected light, including brightness and magnitude of polarization. These measurements will define the concentration, size, shape and composition of particles in the atmosphere.
Polarimeter measurements of reflected light should provide valuable context for data from another instrument on the UC-12 designed to reveal how plankton and optical properties vary with water depth.
Chris Hostetler of Langley is leading that group. He and others will test a prototype lidar (light detection and ranging) system—the High Spectral Resolution Lidar-1 (HSRL-1). A laser that will probe the ocean to a depth of about 160 feet should reveal how phytoplankton concentrations change with depth, along with the amount of light available for photosynthesis.
Phytoplankton largely drive the functioning of ocean ecosystems and knowledge of their vertical distribution is needed to understand their productivity. This knowledge will allow NASA scientists to improve satellite-based estimates of how much atmospheric carbon dioxide is absorbed by the ocean.
NASA satellites contributing to SABOR are the Cloud-Aerosol Lidar and Infrared Pathfinder Satellite Observation (CALIPSO), which view clouds and tiny particles in Earth’s atmosphere, as well as the Terra and Aqua satellites, which measure atmospheric, land and marine processes.
Analysis of data collected from the ship, aircraft and satellites is expected to guide preparation for a new, advanced ocean satellite mission—Pre-Aerosol, Clouds, and ocean Ecosystem (PACE), according to NASA.
PACE will extend observations of ocean ecology, biogeochemical cycling and ocean productivity begun by NASA in the late 1970s with the Coastal Zone Color Scanner and continued with the Sea-viewing Wide Field-of-view-Sensor (SeaWiFS) and the Moderate Resolution Imaging Spectroradiometer (MODIS) instruments on Terra and Aqua.
Note : The above story is based on materials provided by University of Maine
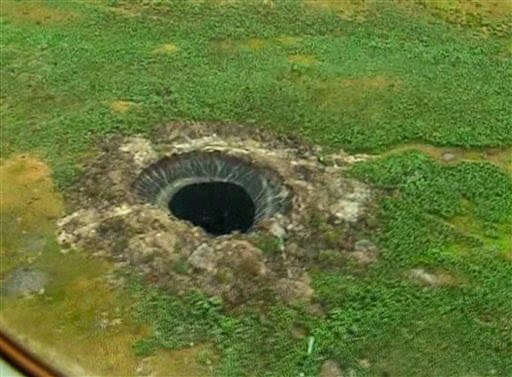
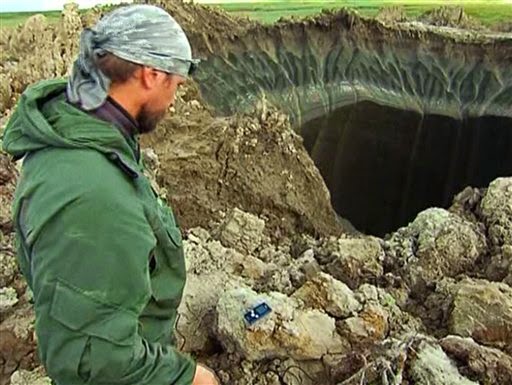
This frame grab made Wednesday, July 16, 2014, shows a crater, discovered recently in the Yamal Peninsula, in Yamalo-Nenets Autonomous Okrug, Russia. Russian scientists said Thursday July 17, 2014 that they believe the 60-meter wide crater, discovered recently in far northern Siberia, could be the result of changing temperatures in the region. Andrei Plekhanov, a senior researcher at the Scientific Research Center of the Arctic, traveled on Wednesday to the crater. Plekhanov said 80 percent of the crater appeared to be made up of ice and that there were no traces of an explosion, eliminating the possibility that a meteorite had struck the region. (AP Photo/Associated Press Television)
Russian scientists say they believe a 60-meter (66-yard) wide crater discovered recently in far northern Siberia could be the result of changing temperatures in the region.
Andrei Plekhanov, a senior researcher at the Scientific Research Center of the Arctic, told the AP Thursday that the crater was mostly likely the result of a “build-up of excessive pressure” underground due to rising temperatures in the region.
Plekhanov on Wednesday traveled to the crater, some 30 kilometers (18.64 miles) from the Bovanenkovo gas field in the far northern Yamal peninsula. He said 80 percent of the crater appeared to be made up of ice and that there were no traces of an explosion, eliminating the possibility that a meteorite had struck the region.
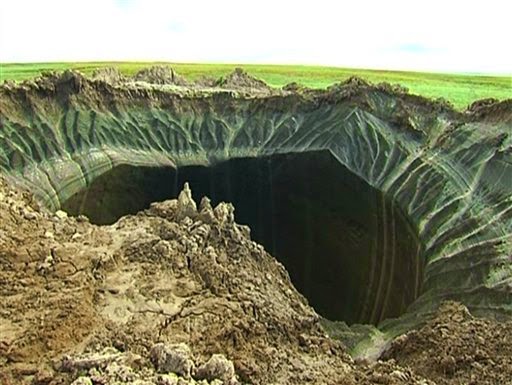
This frame grab made Wednesday, July 16, 2014, shows a crater, discovered recently in the Yamal Peninsula, in Yamalo-Nenets Autonomous Okrug, Russia. Russian scientists said Thursday July 17, 2014 that they believe a 60-meter wide crater, discovered recently in far northern Siberia, could be the result of changing temperatures in the region. Andrei Plekhanov, a senior researcher at the Scientific Research Center of the Arctic, traveled on Wednesday to the crater. Plekhanov said 80 percent of the crater appeared to be made up of ice and that there were no traces of an explosion, eliminating the possibility that a meteorite had struck the region. (AP Photo/Associated Press Television)In this frame grab made Wednesday, July 16, 2014, Andrei Plekhanov, a senior researcher at the Scientific Research Center of the Arctic, stands at a crater, discovered recently in the Yamal Peninsula, in Yamalo-Nenets Autonomous Okrug, Russia. Russian scientists said Thursday july 17, 2014 that they believe a 60-meter wide crater, discovered recently in far northern Siberia, could be the result of changing temperatures in the region. Andrei Plekhanov said 80 percent of the crater appeared to be made up of ice and that there were no traces of an explosion, eliminating the possibility that a meteorite had struck the region. (AP Photo/Associated Press Television)
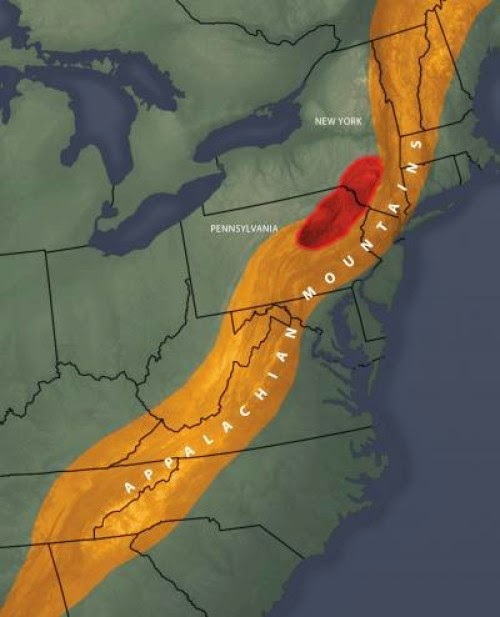
A dense, underground block of volcanic rock (shown in red) helped shape the well-known bend in the Appalachian mountain range. Credit: Graphic by Michael Osadciw/University of Rochester.
The 1500 mile Appalachian mountain chain runs along a nearly straight line from Alabama to Newfoundland — except for a curious bend in Pennsylvania and New York State. Researchers from the College of New Jersey and the University of Rochester now know what caused that bend — a dense, underground block of rigid, volcanic rock forced the chain to shift eastward as it was forming millions of years ago.
According to Cindy Ebinger, a professor of earth and environmental sciences at the University of Rochester, scientists had previously known about the volcanic rock structure under the Appalachians. “What we didn’t understand was the size of the structure or its implications for mountain-building processes,” she said.
The findings have been published in the journal Earth and Planetary Science Letters.
When the North American and African continental plates collided more than 300 million years ago, the North American plate began folding and thrusting upwards as it was pushed westward into the dense underground rock structure — in what is now the northeastern United States. The dense rock created a barricade, forcing the Appalachian mountain range to spring up with its characteristic bend.
The research team — which also included Margaret Benoit, an associate professor of physics at the College of New Jersey, and graduate student Melanie Crampton at the College of New Jersey — studied data collected by the Earthscope project, which is funded by the National Science Foundation. Earthscope makes use of 136 GPS receivers and an array of 400 portable seismometers deployed in the northeast United States to measure ground movement.
Benoit and Ebinger also made use of the North American Gravity Database, a compilation of open-source data from the U.S., Canada, and Mexico. The database, started two decades ago, contains measurements of the gravitational pull over the North American terrain. Most people assume that gravity has a constant value, but when gravity is experimentally measured, it changes from place to place due to variations in the density and thickness of Earth’s rock layers. Certain parts of Earth are denser than others, causing the gravitational pull to be slightly greater in those places.
Data on the changes in gravitational pull and seismic velocity together allowed the researchers to determine the density of the underground structure and conclude that it is volcanic in origin, with dimensions of 450 kilometers by 100 kilometers. This information, along with data from the Earthscope project ultimately helped the researchers to model how the bend was formed.
Ebinger called the research project a “foundation study” that will improve scientists’ understanding of Earth’s underlying structures. As an example, Ebinger said their findings could provide useful information in the debate over hydraulic fracturing — popularly known is hydrofracking — in New York State.
Hydrofracking is a mining technique used to extract natural gas from deep in the Earth. It involves drilling horizontally into shale formations, then injecting the rock with sand, water, and a cocktail of chemicals to free the trapped gas for removal. The region just west of the Appalachian Basin — the Marcellus Shale formation — is rich in natural gas reserves and is being considered for development by drilling companies.
Note : The above story is based on materials provided by University of Rochester.
A small army of 75 geophysicists is set to converge on Mount St. Helens this weekend to begin final preparations for the equivalent of a combined ultrasound and CAT scan of the famous volcano’s internal plumbing. The ambitious project, a joint undertaking by Earth scientists at Rice University, the University of Washington, the University of Texas at El Paso and other institutions, requires placing more than 3,500 active seismological sensors and 23 seismic charges around the volcano over the next few days.
“Mount St. Helens and other volcanoes in the Cascade Range threaten urban centers from Vancouver to Portland, and we’d like to better understand their inner workings in order to better predict when they may erupt and how severe those eruptions are likely to be,” said Rice’s Alan Levander, the lead scientist for the experiment.
Levander, Rice’s Carey Croneis Professor of Earth Science, said the instruments will measure seismic waves generated by the detonation of charges in 23 boreholes that are each about 80 feet deep. Most of the detonations are scheduled in the evening on July 22-23, but Levander said area residents are unlikely to hear or feel them because of the depth of the boreholes and because the detonations will produce vibrations that approximate a magnitude 2 earthquake, which typically cannot be felt.
“Our shots will provide enough seismic energy to develop a clear picture of the mountain’s inner workings, but in most cases not enough to be felt and certainly no more than low-level seismic activity that occurs in the area on a weekly basis,” Levander said.
Levander said the detonations will take place in areas where the ground has already been disturbed, such as clear-cuts, quarries, gravel pits and garbage dumps.
Dozens of mostly student volunteers are expected to arrive Friday for two days of training about how to set up the 3,500 active seismic sensors that will gather the bulk of the experimental data.
“These sensors are basically a computer in a can with a small battery,” Levander said. “They’re about the size of a water bottle, but because of their limited power supply, we only have about two days to deploy the whole lot.”
He said the volunteers will also pick up all the active sensors—and the data they’ve collected—within a couple of days of the explosions. A few more detonations will occur on the evening of July 30. A rearrangement of part of the sensor network will accompany those tests.
The coming tests follow two years of detailed planning and are part of a four-year project called Imaging Magma Under St. Helens (iMUSH), which could bring improvements in volcanic monitoring and advance warning systems at Mount St. Helens and other volcanoes.
The work area for the tests extends from Mount Rainier on the north to the Columbia River on the south, and from Interstate 5 on the west to Mount Adams on the east. An advanced team of researchers has been in the area for weeks installing 70 passive seismographs. Levander said these instruments, which take several hours to set up and will be left in place for two years, are more sophisticated and sensitive than the active sensors.
“The active-source monitoring will provide very high-resolution images at a relatively shallow depth, while the passive experiment data will be at a lower resolution but will be at a much greater depth,” said Kenneth Creager, a University of Washington professor of Earth and space sciences who is leading the passive monitoring.
Having both sets of monitors recording data from the active-source detonations will help scientists have a much clearer idea of how the deeper, harder-to-see structure compares with better defined shallow structure, he said.
A third technique, magnetotelluric monitoring, which produces data based on fluctuations in Earth’s electromagnetic field, will also be used to image the subterranean structures.
Mount St. Helens was chosen for the study because it has been the most active volcano in the Cascade Range, erupting twice in the last 35 years, and is readily accessible for the researchers and their equipment, Levander said.
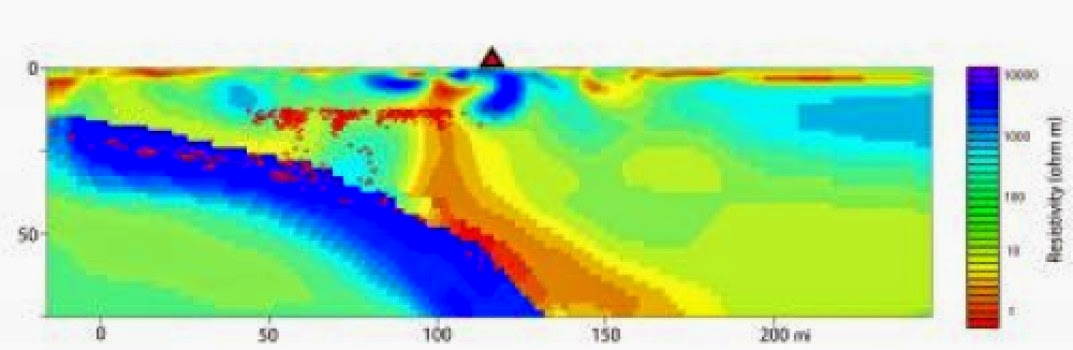
This image was made by measuring how the ground conducts or resists electricity in a study co-authored by geophysicist Phil Wannamaker of the University of Utah Energy & Geoscience Institute. It shows the underground plumbing system that provides molten and partly molten rock to the magma chamber beneath the Mount Rainier volcano in Washington state. The scale at left is miles depth. The scale at bottom is miles from the Pacific Coast. The Juan de Fuca plate of Earth’s Pacific seafloor crust and upper mantle is shown in blue on the left half of the image as it dives or ‘subducts’ eastward beneath Washington state. The reddish orange and yellow colors represent molten and partly molten rock forming atop the Juan de Fuca plate or ‘slab.’ The image shows the rock begins to melt about 50 miles beneath Mount Rainier (the red triangle at top). Some is pulled downward and eastward as the slab keeps diving, but other melts move upward to the orange magma chamber shown under but west of Mount Rainier. The line of sensors used to make this image were placed north of the 14,410-foot peak, so the image may be showing a lobe of the magma chamber that extends northwest of the mountain. Red ovals on the left half of the page are the hypocenters of earthquakes. Credit: R Shane McGary, Woods Hole Oceanographic Institution.
By measuring how fast Earth conducts electricity and seismic waves, a University of Utah researcher and colleagues made a detailed picture of Mount Rainier’s deep volcanic plumbing and partly molten rock that will erupt again someday.
“This is the most direct image yet capturing the melting process that feeds magma into a crustal reservoir that eventually is tapped for eruptions,” says geophysicist Phil Wannamaker, of the university’s Energy & Geoscience Institute and Department of Civil and Environmental Engineering. “But it does not provide any information on the timing of future eruptions from Mount Rainier or other Cascade Range volcanoes.”
The study was published today in the journal Nature by Wannamaker and geophysicists from the Woods Hole Oceanographic Institution in Massachusetts, the College of New Jersey and the University of Bergen, Norway.
In an odd twist, the image appears to show that at least part of Mount Rainier’s partly molten magma reservoir is located about 6 to 10 miles northwest of the 14,410-foot volcano, which is 30 to 45 miles southeast of the Seattle-Tacoma area.
But that could be because the 80 electrical sensors used for the experiment were placed in a 190-mile-long, west-to-east line about 12 miles north of Rainier. So the main part of the magma chamber could be directly under the peak, but with a lobe extending northwest under the line of detectors, Wannamaker says.
The top of the magma reservoir in the image is 5 miles underground and “appears to be 5 to 10 miles thick, and 5 to 10 miles wide in east-west extent,” he says. “We can’t really describe the north-south extent because it’s a slice view.”
Wannamaker estimates the reservoir is roughly 30 percent molten. Magma chambers are like a sponge of hot, soft rock containing pockets of molten rock.
The new image doesn’t reveal the plumbing tying Mount Rainier to the magma chamber 5 miles below it. Instead, it shows water and partly molten and molten rock are generated 50 miles underground where one of Earth’s seafloor crustal plates or slabs is “subducting” or diving eastward and downward beneath the North America plate, and how and where those melts rise to Rainier’s magma chamber.
The study was funded largely by the National Science Foundation’s Earthscope program, which also has made underground images of the United States using seismic or sound-wave tomography, much like CT scans show the body’s interior using X-rays.
The new study used both seismic imaging and magnetotelluric measurements, which make images by showing how electrical and magnetic fields in the ground vary due to differences in how much underground rock and fluids conduct or resist electricity.
Wannamaker says it is the most detailed cross-section view yet under a Cascades volcanic system using electrical and seismic imaging. Earlier seismic images indicated water and partly molten rock atop the diving slab. The new image shows melting “from the surface of the slab to the upper crust, where partly molten magma accumulates before erupting,” he adds.
Wannamaker and Rob L. Evans, of the Woods Hole Oceanographic Institution, conceived the study. First author R Shane McGary — then at Woods Hole and now at the College of New Jersey — did the data analysis. Other co-authors were Jimmy Elsenbeck of Woods Hole and Stéphane Rondenay of the University of Bergen.
Mount Rainier: Hazardous Backdrop to Metropolitan Seattle-Tacoma
Mount Rainier, the tallest peak in the Cascades, “is an active volcano that will erupt again,” says the U.S. Geological Survey. Rainier sits atop volcanic flows up to 36 million years old. An ancestral Rainier existed 2 million to 1 million years ago. Frequent eruptions built the mountain’s modern edifice during the past 500,000 years. During the past 11,000 years, Rainier erupted explosively dozens of times, spewing ash and pumice.
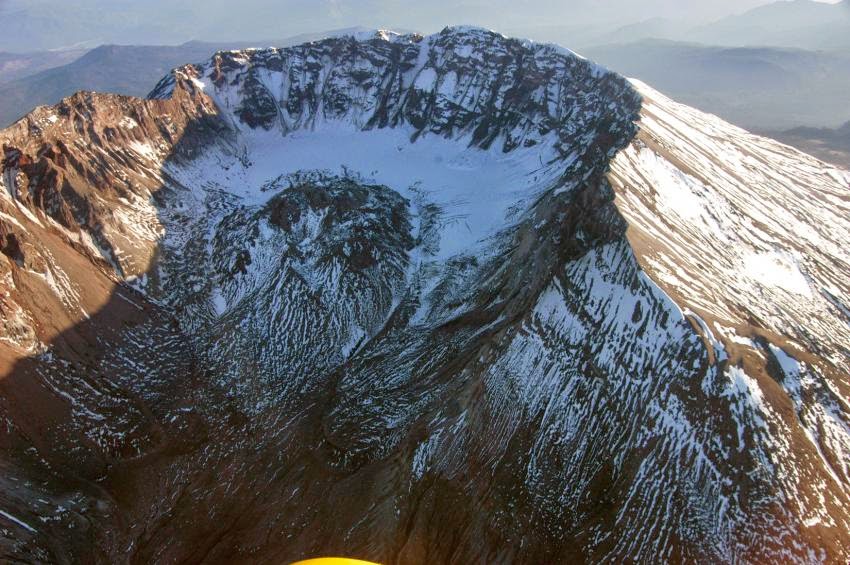
Rainier once was taller until it collapsed during an eruption 5,600 years ago to form a large crater open to the northeast, much like the crater formed by Mount St. Helens’ 1980 eruption. The 5,600-year-old eruption sent a huge mudflow west to Puget Sound, covering parts or all of the present sites of the Port of Tacoma, Seattle suburbs Kent and Auburn, and the towns Puyallup, Orting, Buckley, Sumner and Enumclaw.
Rainier’s last lava flows were 2,200 years ago, the last flows of hot rock and ash were 1,100 years ago and the last big mudflow 500 years ago. There are disputed reports of steam eruptions in the 1800s.
Subduction Made Simple — and a Peek beneath a Peak
The “ring of fire” is a zone of active volcanoes and frequent earthquake activity surrounding the Pacific Ocean. It exists where Earth’s tectonic plates collide — specifically, plates that make up the seafloor converge with plates that carry continents.
From Cape Mendocino in northern California and north past Oregon, Washington state and into British Columbia, an oceanic plate is being pushed eastward and downward — a process called subduction — beneath the North American plate. This relatively small Juan de Fuca plate is located between the huge Pacific plate and the Pacific Northwest.
New seafloor rock — rich with water in cracks and minerals — emerges from an undersea volcanic ridge some 250 miles off the coast, from northern California into British Columbia. That seafloor adds to the western edge of the Juan de Fuca plate and pushes it east-northeast under the Pacific Northwest, as far as Idaho.
The part of the plate diving eastward and downward is called the slab, which ranges from 30 to 60 miles thick as it is jammed under the North American plate. The part of the North American plate above the diving slab is shaped like a wedge.
When the leading, eastern edge of the diving slab descends deep enough, where pressures and temperatures are high, water-bearing minerals such as chlorite and amphibole release water from the slab, and the slab and surrounding mantle rock begin to melt. That is why the Cascade Range of active volcanoes extends north-to-south — above the slab and parallel but about 120 miles inland from the coast — from British Columbia south to Mount Shasta and Lassen Peak in northern California.
In the new image, yellow-orange-red areas correspond to higher electrical conductivity (or lower resistivity) in places where fluids and melts are located.
The underground image produced by the new study shows where water and molten rock accumulate atop the descending slab, and the route they take to the magma chamber that feeds eruptions of Mount Rainier:
— The rock begins to melt atop the slab about 50 miles beneath Mount Rainier. Wannamaker says it is best described as partly molten rock that contains about 2 percent water and “is a mush of crystals within an interlacing a network of molten rock.”
— Some water and partly molten rock actually gets dragged downward atop the descending slab, to depths of 70 miles or more.
— Other partly molten rock rises up through the upper mantle wedge, crosses into the crust at a depth of about 25 miles, and then rises into Rainier’s magma chamber — or at least the lobe of the chamber that crosses under the line of sensors used in the study. Evidence suggests the magma moves upward at least 0.4 inches per year.
— The new magnetotelluric image also shows a shallower zone of fluid perhaps 60 miles west of Rainier and 25 miles deep at the crust-mantle boundary. Wannamaker says it is largely water released from minerals as the slab is squeezed and heated as it dives.
The seismic data were collected during 2008-2009 for other studies. The magnetotelluric data were gathered during 2009-2010 by authors of the new study.
Wannamaker and colleagues placed an east-west line of magnetotelluric sensors: 60 that made one-day measurements and looked as deep as 30 miles into the Earth, and 20 that made measurements for a month and looked at even greater depths.
Journal Reference:
R. Shane McGary, Rob L. Evans, Philip E. Wannamaker, Jimmy Elsenbeck, Stéphane Rondenay. Pathway from subducting slab to surface for melt and fluids beneath Mount Rainier. Nature, 2014; 511 (7509): 338 DOI: 10.1038/nature13493
Note : The above story is based on materials provided by University of Utah.
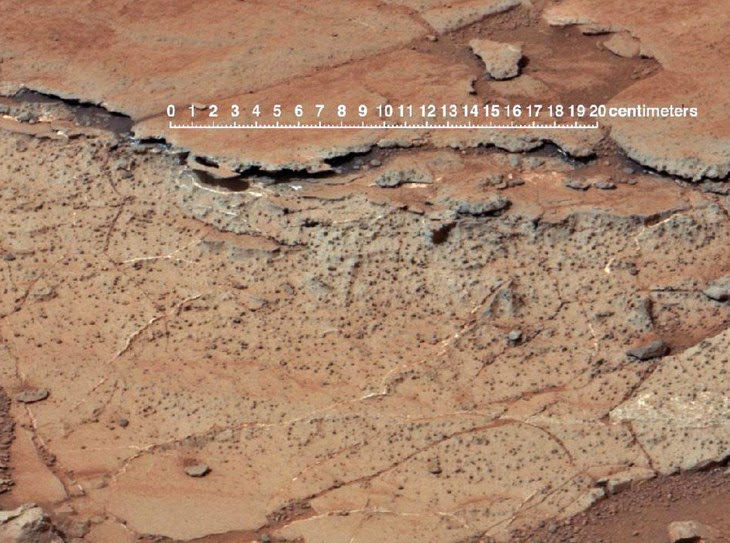
Rover image from Gale Crater reveals soil features similar to paleosols on Earth. Credit: NASA
Soil deep in a crater dating to some 3.7 billion years ago contains evidence that Mars was once much warmer and wetter, saysUniversity of Oregon geologist Gregory Retallack, based on images and data captured by the rover Curiosity.
NASA rovers have shown Martian landscapes littered with loose rocks from impacts or layered by catastrophic floods, rather than the smooth contours of soils that soften landscapes on Earth. However, recent images from Curiosity from the impact Gale Crater, Retallack said, reveal Earth-like soil profiles with cracked surfaces lined with sulfate, ellipsoidal hollows and concentrations of sulfate comparable with soils in Antarctic Dry Valleys and Chile’s Atacama Desert.
His analyses appear in a paper placed online this week by the journal Geology in advance of print in the September issue of the world’s top-ranked journal in the field. Retallack, the paper’s lone author, studied mineral and chemical data published by researchers closely tied with the Curiosity mission. Retallack, professor of geological sciences and co-director of paleontology research at the UO Museum of Natural and Cultural History, is an internationally known expert on the recognition of paleosols — ancient fossilized soils contained in rocks.
“The pictures were the first clue, but then all the data really nailed it,” Retallack said. “The key to this discovery has been the superb chemical and mineral analytical capability of the Curiosity Rover, which is an order of magnitude improvement over earlier generations of rovers. The new data show clear chemical weathering trends, and clay accumulation at the expense of the mineral olivine, as expected in soils on Earth. Phosphorus depletion within the profiles is especially tantalizing, because it attributed to microbial activity on Earth.”
The ancient soils, he said, do not prove that Mars once contained life, but they do add to growing evidence that an early wetter and warmer Mars was more habitable than the planet has been in the past 3 billion years.
Curiosity rover is now exploring topographically higher and geologically younger layers within the crater, where the soils appear less conducive to life. For a record of older life and soils on Mars, Retallack said, new missions will be needed to explore older and more clayey terrains.
Surface cracks in the deeply buried soils suggest typical soil clods. Vesicular hollows, or rounded holes, and sulfate concentrations, he said, are both features of desert soils on Earth.
“None of these features is seen in younger surface soils of Mars,” Retallack said. “The exploration of Mars, like that of other planetary bodies, commonly turns up unexpected discoveries, but it is equally unexpected to discover such familiar ground.”
The newly discovered soils provide more benign and habitable soil conditions than known before on Mars. Their dating to 3.7 billion years ago, he noted, puts them into a time of transition from “an early benign water cycle on Mars to the acidic and arid Mars of today.” Life on Earth is believed to have emerged and began diversifying about 3.5 billion years ago, but some scientists have theorized that potential evidence that might take life on Earth farther back was destroyed by plate tectonics, which did not occur on Mars.
In an email, Malcolm Walter of the Australian Centre for Astrobiology, who was not involved in the research, said the potential discovery of these fossilized soils in the Gale Crater dramatically increases the possibility that Mars has microbes. “There is a real possibility that there is or was life on Mars,” he wrote.
Retallack noted that Steven Benner of the Westheimer Institute of Science and Technology in Florida has speculated that life is more likely to have originated on a soil planet like Mars than a water planet like Earth. In an email, Benner wrote that Retallack’s paper “shows not only soils that might be direct products of an early Martian life, but also the wet-dry cycles that many models require for the emergence of life.”
Reference: G. J. Retallack. Paleosols and paleoenvironments of early Mars. Geology, 2014; DOI: 10.1130/G35912.1
Note : The above story is based on materials provided by University of Oregon.
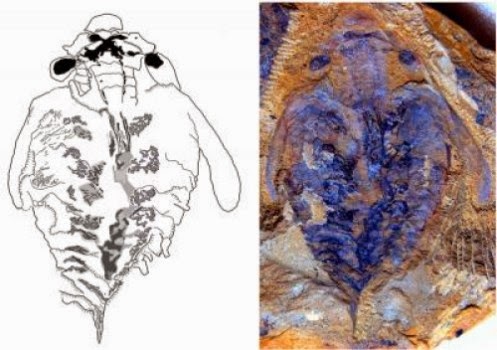
This is a side-by-side comparison reveals the similarity between the brain of a living onychophoran (green) and that of the anomalocaridid fossil Lyrarapax unguispinus (gray). Long nerves from the frontal appendages extend to paired ganglia lying in front of the optic nerve and connect to the main brain mass in front of the mouth. Anomalocaridids had a pair of clawlike grasping appendages instead of feelers. Credit: Illustration by Nicholas Strausfeld
An international team of paleontologists has identified the exquisitely preserved brain in the fossil of one of the world’s first known predators that lived in the Lower Cambrian, about 520 million years ago. The discovery revealed a brain that is surprisingly simple and less complex than those known from fossils of some of the animal’s prey.
The find for the first time identifies the fossilized brain of what are considered the top predators of their time, a group of animals known as anomalocaridids, which translates to “abnormal shrimp.” Long extinct, these fierce-looking arthropods were first discovered as fossils in the late 19th century but not properly identified until the early 1980s. They still have scientists arguing over where they belong in the tree of life.
“Our discovery helps to clarify this debate,” said Nicholas Strausfeld, director of the University of Arizona’s Center for Insect Science. “It turns out the top predator of the Cambrian had a brain that was much less complex than that of some of its possible prey and that looked surprisingly similar to a modern group of rather modest worm-like animals.”
Strausfeld, a Regents’ Professor in the Department of Neuroscience in the UA College of Science is senior author on a paper about the findings recently published in the journal Nature.
The brain in the fossil, a new species given the name Lyrarapax unguispinus — Latin for “spiny-clawed lyre-shaped predator” — suggests its relationship to a branch of animals whose living descendants are known as onychophorans or velvet worms. These wormlike animals are equipped with stubby unjointed legs that end in a pair of tiny claws.
Onychophorans, which are also exclusively predators, grow to no more than a few inches in length and are mostly found in the Southern Hemisphere, where they roam the undergrowth and leaf litter in search of beetles and other small insects, their preferred prey. Two long feelers extend from the head, attached in front of a pair of small eyes.
The anomalocaridid fossil resembles the neuroanatomy of today’s onychophorans in several ways, according to Strausfeld and his collaborators. Onychophorans have a simple brain located in front of the mouth and a pair of ganglia — a collection of nerve cells — located in the front of the optic nerve and at the base of their long feelers.
“And — surprise, surprise — that is what we also found in our fossil,” Strausfeld said, pointing out that anomalocaridids had a pair of clawlike grasping appendages in front of the eyes.
“These top predators in the Cambrian are defined by just their single pair of appendages, wicked-looking graspers, extending out from the front of their head,” he said. “These are totally different from the antennae of insects and crustaceans. Such frontally disposed appendages are not found in any other living animals with the exception of velvet worms.”
The similarities of their brains and other attributes suggest that the anomalocaridid predators could have been very distant relatives of today’s velvet worms, Strausfeld said.
“This is another contribution towards the new field of research we call neuropaleontology,” said Xiaoya Ma of the Natural History Museum in London, a co-author on the paper. “These grasping appendages are a characteristic feature of this most celebrated Cambrian animal group, whose affinity with living animals has troubled evolutionary scientists for almost a century. The discovery of preserved brain in Lyrarapax resolves specific anatomical correspondences with the brains of onychophorans.”
“Being able to directly associate appendages with parts of the brain in Cambrian animals is a huge advantage,” said co-author Gregory Edgecombe, also at the Natural History Museum. “For many years now paleontologists have struggled with the question of how different kinds of appendages in Cambrian fossils line up with each other and with what we see in living arthropods. Now for the first time, we didn’t have to rely just on the external form of the appendages and their sequence in the head to try and sort out segmental identities, but we can draw on the same tool kit we use for extant arthropods — the brain.”
Strausfeld and his colleagues recently presented evidence of the oldest known fossil of a brain belonging to arthropods related to insects and crustaceans and another belonging to a creature related to horseshoe crabs and scorpions (see links below).
“With this paper and our previous reports in Nature, we have identified the three principal brain arrangements that define the three groups of arthropods that exist today,” Strausfeld said. “They appear to have already coexisted 520 million years ago.”
The Lyrarapax fossil was found in 2013 by co-author Peiyun Cong near Kunming in the Chinese province of Yunnan. Co-authors Ma and Edgecombe participated in the analysis, as did Xianguang Hou — who discovered the Chengjiang fossil beds in 1984 ¬ — at the Yunnan Key Laboratory for Paleobiology at the University of Yunnan.
“Because its detailed morphology is exquisitely preserved, Lyrarapax is amongst the most complete anomalocaridids known so far,” Cong said.
Just over five inches long, Lyrarapax was dwarfed by some of the larger anomalocaridids, which reached more than three feet in length. Paleontologists excavating lower Cambrian rocks in southern Australia found that some anomalocaridids had huge compound eyes, up to 10 times larger than the biggest dragonfly eye, befitting what must have been a highly efficient hunter, Strausfeld said.
The fact that the brain of the earliest known predator appears much simpler in shape than the previously unearthed brains of its contemporaries begs intriguing questions, according to Strausfeld, one of which is whether it is possible that predators drove the evolution of more complex brains.
“With the evolution of dedicated and highly efficient predators, the pressure was on other animals to be able to detect and recognize potential danger and rapidly coordinate escape movements. These requirements may have driven the evolution of more complex brain circuitry,” Strausfeld said.
Journal Reference:
Peiyun Cong, Xiaoya Ma, Xianguang Hou, Gregory D. Edgecombe, Nicholas J. Strausfeld. Brain structure resolves the segmental affinity of anomalocaridid appendages. Nature, 2014; DOI: 10.1038/nature13486 Note : The above story is based on materials provided by University of Arizona. The original article was written by Daniel Stolte.
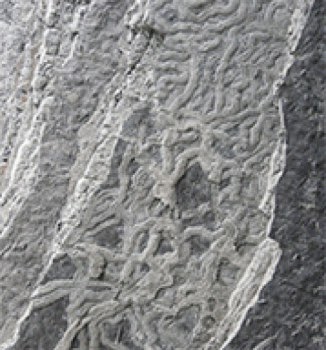
Fossilized sea urchin tracks at Zumaia. Credit: Richard Twitchett / Trustees NHM
Animals have used the same technique to search for food that’s in short supply for at least 50 million years, a University of Southampton-led study suggests.
Researchers analysed fossilised sea urchin trails from northern Spain and found the tracks reflect a search pattern still used by a huge range of creatures today.
But this is the first example of extinct animals using such a strategy.
The findings could explain why so many modern animals use the technique, and suggest the pattern may have an even more ancient origin.
Creatures including sharks, honeybees, albatrosses and penguins all search for food according to a mathematical pattern of movement called a Lévy walk — a random search strategy made up of many small steps combined with a few longer steps. Although a Lévy walk is random, it’s the most efficient way to find food when it’s scarce.
David Sims, Professor of Marine Ecology at the University of Southampton and lead author of the study, says: “How best to search for food in complex landscapes is a common problem facing all mobile creatures.
“Finding food in a timely fashion can be a matter of life or death for animals — choose the wrong direction to move in often enough and it could be curtains. But moving in a random search pattern called a Lévy walk is mathematically the best way to find isolated food.”
Even though a wide range of modern creatures search for food according to this pattern, scientists had no idea how the pattern came about, until now.
Professor Sims and colleagues from the University of Southampton, NERC’s National Oceanography Centre, Rothamsted Research, VU University Amsterdam and the Natural History Museum analysed the fossilised Eocene-era tracks that were made by sea urchins that lived on the deep sea floor around 50 million years ago. The long trails are preserved in rocky cliffs in a region called Zumaia in northern Spain.
“Finding the signature of an optimal behaviour in the fossil record is exceedingly rare and will help to understand how ancient animals survived very harsh conditions associated with the effects of dramatic climate changes,” says Professor Sims, who is currently seconded to the Marine Biological Association in Plymouth. “Perhaps it’s a case of when the going got tough, the tough really did get going.”
“The patterns are striking, because they indicate optimal Lévy walk searches likely have a very ancient origin and may arise from simple behaviours observed in much older fossil trails from the Silurian period, around 440 million years ago,” he adds.
Professor Richard Twitchett of the Natural History Museum and co-author of the study adds: “It’s amazing to think that 50 million-year-old fossil burrows and trails have provided us with the first evidence of foraging strategies in animals that live on and in the deep-sea floor — studies which would be nearly impossible and very expensive to do in modern oceans.
“Trace fossils are remarkable and beautiful records of the movements of ancient animals, which have been frozen in time and tell us so much about the evolution of life on Earth and the environments of the past.”
The researchers think the collapse of primary producers, such as phytoplankton, and widespread food scarcity caused by mass extinctions, which show up in the fossil record, could have triggered the evolution of Lévy-like searches.
The Eocene lasted from 56 to 33.9 million years ago, and began as a time of global warming, with temperatures soaring across the planet.
Lévy walks aren’t just confined to animals; our ancient hunter-gatherer ancestors used exactly the same approach, as do modern hunter-gatherers in northern Tanzania.
The study is published in The Proceedings of the National Academy of Sciences.
Journal Reference:
D. W. Sims, A. M. Reynolds, N. E. Humphries, E. J. Southall, V. J. Wearmouth, B. Metcalfe, R. J. Twitchett. Hierarchical random walks in trace fossils and the origin of optimal search behavior. Proceedings of the National Academy of Sciences, 2014; DOI: 10.1073/pnas.1405966111
Note : The above story is based on materials provided by University of Southampton.
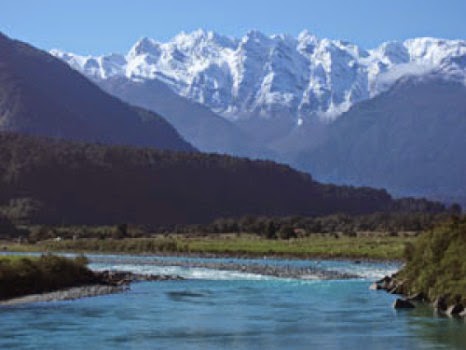
The Southern Alps Mountain Range, New Zealand. Rain and snow falling on the mountains percolate to great depths. Credit: Simon Cox
University of Southampton researchers have found that rainwater can penetrate below the Earth’s fractured upper crust, which could have major implications for our understanding of earthquakes and the generation of valuable mineral deposits.
It had been thought that surface water could not penetrate the ductile crust — where temperatures of more than 300°C and high pressures cause rocks to flex and flow rather than fracture — but researchers, led by Southampton’s Dr Catriona Menzies, have now found fluids derived from rainwater at these levels.
Fluids in the Earth’s crust can weaken rocks and may help to initiate earthquakes along locked fault lines. They also concentrate valuable metals such as gold. The new findings suggest that rainwater may be responsible for controlling these important processes, even deep in the Earth.
Researchers from the University of Southampton, GNS Science (New Zealand), the University of Otago, and the Scottish Universities Environmental Research Centre studied geothermal fluids and mineral veins from the Southern Alps of New Zealand, where the collision of two tectonic plates forces deeper layers of the Earth closer to the surface.
The team looked into the origin of the fluids, how hot they were and to what extent they had reacted with rocks deep within the mountain belt.
“When fluids flow through the crust they leave behind deposits of minerals that contain a small amount of water trapped within them,” says Postdoctoral Researcher Catriona, who is based at the National Oceanography Centre. “We have analysed these waters and minerals to identify where the fluids deep in the crust came from.
“Fluids may come from a variety of sources in the crust. In the Southern Alps fluids may flow upwards from deep in the crust, where they are released from hot rocks by metamorphic reactions, or rainwater may flow down from the surface, forced by the high mountains above. We wanted to test the limits of where rainwater may flow in the crust. Although it has been suggested before, our data shows for the first time that rainwater does penetrate into rocks that are too deep and hot to fracture.”
Surface-derived waters reaching such depths are heated to over 400°C and significantly react with crustal rocks. However, through testing the researchers were able to establish the water’s meteoric origin.
Funding for this research, which has been published in Earth and Planetary Science Letters, was provided by the Natural Environmental Research Council (NERC). Catriona and her team are now looking further at the implications of their findings in relation to earthquake cycles as part of the international Deep Fault Drilling Project, which aims to drill a hole through the Alpine Fault at a depth of about 1km later this year.
Journal Reference:
Catriona D. Menzies, Damon A.H. Teagle, Dave Craw, Simon C. Cox, Adrian J. Boyce, Craig D. Barrie, Stephen Roberts. Incursion of meteoric waters into the ductile regime in an active orogen. Earth and Planetary Science Letters, 2014; 399: 1 DOI: 10.1016/j.epsl.2014.04.046
Note : The above story is based on materials provided by University of Southampton.
A 25-year-long study published in Geology on 14 July provides the first quantitative measurement of in situ calcium-magnesium silicate mineral dissolution by ants, termites, tree roots, and bare ground. This study reveals that ants are one of the most powerful biological agents of mineral decay yet observed. It may be that an understanding of the geobiology of ant-mineral interactions might offer a line of research on how to “geoengineer” accelerated CO2 consumption by Ca-Mg silicates.
Researcher Ronald Dorn of Arizona State University writes that over geological timescales, the dissolution of calcium (Ca) and magnesium (Mg) bearing silicates has led to the graduate drawdown of atmospheric carbon dioxide (CO2) through the accumulation of limestone and dolomite. Many contemporary efforts to sequester CO2 involve burial, with some negative environmental consequences.
Dorn suggests that, given that ant nests as a whole enhance abiotic rates of Ca-Mg dissolution by two orders of magnitude (via biologically enhanced weathering), future research leading to the isolation of ant-based enhancement process could lead to further acceleration. If ant-based enhancement could reach 100 times or greater, he writes, this process might be able to geo-engineer sequestration of CO2 from the atmosphere. Similarly, ants might also provide clues on geoengineering efficient pathways of calcium carbonate precipitation to sequester atmospheric CO2.
Earth’s climate has cooled significantly over the past 65 m.y., likely from hydrologic regulation, vegetation change, and interactions related to tectonism, in part mediated by Ca-Mg silicate mineral dissolution that draws down CO2. Although speculative, says Dorn, the timing of the expansion in the variety and number of ants in the Paleogene and the Neogene suggests that biologically enhanced weathering by ants could potentially be a part of the puzzle of Cenozoic cooling.
Journal Reference:
R. I. Dorn. Ants as a powerful biotic agent of olivine and plagioclase dissolution. Geology, 2014; DOI: 10.1130/G35825.1
Note : The above story is based on materials provided by Geological Society of America.