back to top
27.8 C
New York
Friday, November 15, 2024
Home Blog Page 276

Ancient Arctic sharks tolerated brackish water 50 million years ago

CU-Boulder Associate Professor Jaerlyn Eberle, left, and research colleagues collect ancient sharks teeth on Banks Island in the Arctic Circle. Oxygen isotopes in the teeth indicated sharks living in the Eocene Arctic Ocean roughly 50 million years ago were tolerant of brackish water, unlike their shark relatives living today. Credit: Courtesy Jaelyn Eberle, University of Colorado

Sharks were a tolerant bunch some 50 million years ago, cruising an Arctic Ocean that contained about the same percentage of freshwater as Louisiana’s Lake Ponchatrain does today, says a new study involving the University of Colorado Boulder and the University of Chicago.
The study indicates the Eocene Arctic sand tiger shark, a member of the lamniform group of sharks that includes today’s great white, thresher and mako sharks, was thriving in the brackish water of the western Arctic Ocean back then. In contrast, modern sand tiger sharks living today in the Atlantic Ocean are very intolerant of low salinity, requiring three times the saltiness of the Eocene sharks in order to survive.

“This study shows the Arctic Ocean was very brackish and had reduced salinity back then,” said University of Chicago postdoctoral researcher Sora Kim, first author on the study. “The ancient sand tiger sharks that lived in the Arctic during the Eocene were very different than sand tiger sharks living in the Atlantic Ocean today.”

The findings have implications for how today’s sharks might fare in a warming Arctic region, which is heating up at about twice the rate of the rest of the planet due to increasing greenhouse gases, said CU-Boulder geological sciences Associate Professor Jaelyn Eberle, a study co-author. The potential consequences of warming in the Arctic include changes in freshwater runoff and atmospheric water vapor and decreases in salinity that can affect marine biology and seawater circulation dynamics.

“As more freshwater flows into the Arctic Ocean due to global warming, I think we are going to see it become more brackish,” said Eberle, also curator of fossil vertebrates at the University of Colorado Museum of Natural History. “Maybe the fossil record can shed some light on how the groups of sharks that are with us today may fare in a warming world.”

A paper on the subject was published online June 30 in the journal Geology. Other co-authors include David Bell from the University of Wyoming, Dewayne Fox from Delaware State University and Aspen Padilla, a CU-Boulder graduate who worked with Eberle as a master’s candidate. The study was funded in part by the National Science Foundation.

The new findings on Arctic Ocean salinity conditions in the Eocene were calculated in part by comparing ratios of oxygen isotopes locked in ancient shark teeth found in sediments on Banks Island in the Arctic Circle and incorporating the data into a salinity model. The team also compared its information to prior studies of sediment cores extracted from an oceanic region in the central Arctic Ocean called the Lomonosov Ridge — a steep hump of continental crust that rises more than 1,000 feet from the ocean floor — to estimate past environmental conditions in the Arctic Ocean.

“Oxygen isotopes in ancient bones and teeth reflect the water animals are living in or drinking,” said Kim, a former postdoctoral researcher at the University of Wyoming. “Because sharks are aquatic, the oxygen from the ocean is constantly being exchanged with oxygen in their body water, and that’s what is incorporated into their teeth. When I analyzed their isotopic composition, the numbers seemed weird at first because they indicated an essentially freshwater environment.”

The team analyzed 30 fossil sand tiger shark teeth exhumed from Banks Island and 19 modern sand tiger shark teeth from specimens caught in Delaware Bay bordered by Delaware and New Jersey. The paleo-salinity estimate for the modern sand tiger sharks is consistent with the continental shelf salinity present from Delaware south to Florida and from the coastline to roughly six miles offshore, known hunting grounds for modern sand tiger sharks, which have formidable teeth and can reach a length of nearly 10 feet.

The Eocene Epoch, which ran from about 56 to 34 million years ago, was marked by wild temperature fluctuations, including intense greenhouse periods when lush rainforests abounded in the Arctic. Previous studies by Eberle and colleagues showed the fauna there included ancestors of tapirs, hippo-like creatures, crocodiles and giant tortoises. Despite the six months of darkness each year, the terrestrial Arctic climate included warm humid summers and mild winters with temperatures ranging from just above freezing to about 70 degrees Fahrenheit.

“We now know a fair amount about the terrestrial animals and plants that were living in the Eocene Arctic greenhouse period,” said Eberle. “To finally get some data on the Eocene marine environment using these shark teeth will help us to begin filling in the gaps.”

Eberle said the Eocene Arctic Ocean was largely isolated from the global oceans. “Increased freshwater runoff from the land due to an intensified hydrologic cycle and a humid Arctic would have turned it more brackish pretty quickly,” she said.

The salinity gradient across the Eocene Arctic Ocean that provided habitat for the ancient sand tiger sharks also was found to be much larger than the salinity gradient tolerated by modern sand tiger sharks living in the Atlantic Ocean, said Eberle. “The Eocene lamniform group of sharks had a much broader environmental window than lamniform sharks do today.”

Eberle and Kim said the early-middle Eocene greenhouse period from 53 to 38 million years ago is used as a deep-time analog by climate scientists for what could happen on Earth if CO2 and other greenhouse gases in Earth’s atmosphere continue to rise, and what a “runaway” greenhouse effect potentially could look like.

“Through an analysis of fossil sand tiger shark teeth from the western Arctic Ocean, this study offers new evidence for a less salty Arctic Ocean during an ancient ‘greenhouse period,’ ” says Yusheng “Chris” Liu, program director in the NSF’s Division of Earth Sciences, which co-funded the research with NSF’s Division of Polar Programs. “The results also confirm that the Arctic Ocean was isolated during that long-ago time.”

Note : The above story is based on materials provided by University of Colorado at Boulder.

Extinct undersea volcanoes squashed under Earth’s crust cause tsunami earthquakes, according to new research

Superheated molten lava from West Mata submarine volcano © NOAA/National Science Foundation

New research has revealed the causes and warning signs of rare tsunami earthquakes, which may lead to improved detection measures

New research has revealed the causes and warning signs of rare tsunami earthquakes, which may lead to improved detection measures.
Tsunami earthquakes happen at relatively shallow depths in the ocean and are small in terms of their magnitude. However, they create very large tsunamis, with some earthquakes that only measure 5.6 on the Richter scale generating waves that reach up to ten metres when they hit the shore.

A global network of seismometers enables researchers to detect even the smallest earthquakes. However, the challenge has been to determine which small magnitude events are likely to cause large tsunamis.

In 1992, a magnitude 7.2 tsunami earthquake occurred off the coast of Nicaragua in Central America causing the deaths of 170 people. Six hundred and thirty seven people died and 164 people were reported missing following a tsunami earthquake off the coast of Java, Indonesia, in 2006, which measured 7.2 on the Richter scale.

The new study, published in the journal Earth and Planetary Science Letters, reveals that tsunami earthquakes may be caused by extinct undersea volcanoes causing a “sticking point” between two sections of the Earth’s crust called tectonic plates, where one plate slides under another.

The researchers from Imperial College London and GNS Science in New Zealand used geophysical data collected for oil and gas exploration and historical accounts from eye witnesses relating to two tsunami earthquakes, which happened off the coast of New Zealand’s north island in 1947. Tsunami earthquakes were only identified by geologists around 35 years ago, so detailed studies of these events are rare.

The team located two extinct volcanoes off the coast of Poverty Bay and Tolaga Bay that have been squashed and sunk beneath the crust off the coast of New Zealand, in a process called subduction.

The researchers suggest that the volcanoes provided a “sticking point” between a part of the Earth’s crust called the Pacific plate, which was trying to slide underneath the New Zealand plate. This caused a build-up of energy, which was released in 1947, causing the plates to “unstick” and the Pacific plate to move and the volcanoes to become subsumed under New Zealand. This release of the energy from both plates was unusually slow and close to the seabed, causing large movements of the sea floor, which led to the formation of very large tsunami waves.

All these factors combined, say the researchers, are factors that contribute to tsunami earthquakes. The researchers say that the 1947 New Zealand tsunami earthquakes provide valuable insights into what geological factors cause these events. They believe the information they’ve gathered on these events could be used to locate similar zones around the world that could be at risk from tsunami earthquakes. Eyewitnesses from these tsunami earthquakes also describe the type of ground movement that occurred and this provides valuable clues about possible early warning signals for communities.

Dr Rebecca Bell, from the Department of Earth Science and Engineering at Imperial College London, says: “Tsunami earthquakes don’t create massive tremors like more conventional earthquakes such as the one that hit Japan in 2011, so residents and authorities in the past haven’t had the same warning signals to evacuate. These types of earthquakes were only identified a few decades ago, so little information has been collected on them. Thanks to oil exploration data and eyewitness accounts from two tsunami earthquakes that happened in New Zealand more than 70 years ago, we are beginning to understand for first time the factors that cause these events. This could ultimately save lives.”

By studying the data and reports, the researchers have built up a picture of what happened in New Zealand in 1947 when the tsunami earthquakes hit. In the March earthquake, eyewitnesses around Poverty Bay on the east coast of the country, close to the town of Gisborne, said that they didn’t feel violent tremors, which are characteristic of typical earthquakes. Instead, they felt the ground rolling, which lasted for minutes, and brought on a sense of sea sickness. Approximately 30 minutes later the bay was inundated by a ten metre high tsunami that was generated by a 5.9 magnitude offshore earthquake. In May, an earthquake measuring 5.6 on the Richter scale happened off the coast of Tolaga Bay, causing an approximate six metre high tsunami to hit the coast. No lives were lost in the New Zealand earthquakes as the areas were sparsely populated in 1947. However, more recent tsunami earthquakes elsewhere have devastated coastal communities.

The researchers are already working with colleagues in New Zealand to develop a better warning system for residents. In particular, new signage is being installed along coastal regions to alert people to the early warning signs that indicate a possible tsunami earthquake. In the future, the team hope to conduct new cutting-edge geophysical surveys over the sites of other sinking volcanoes to better understand their characteristics and the role they play in generating this unusual type of earthquake.

Note : The above story is based on materials provided by Imperial College London

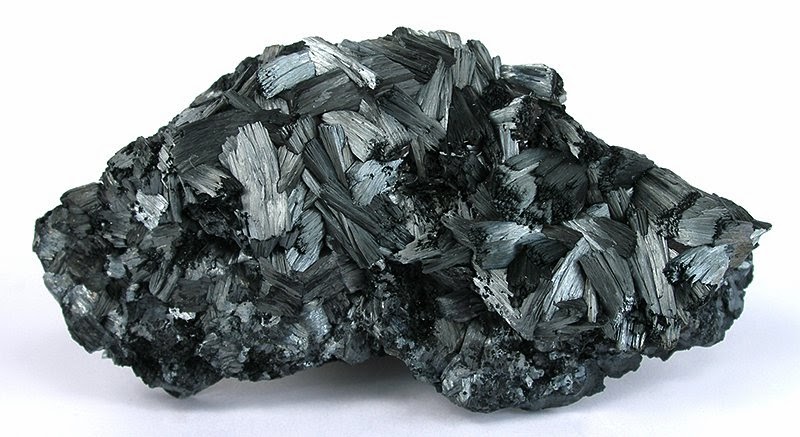
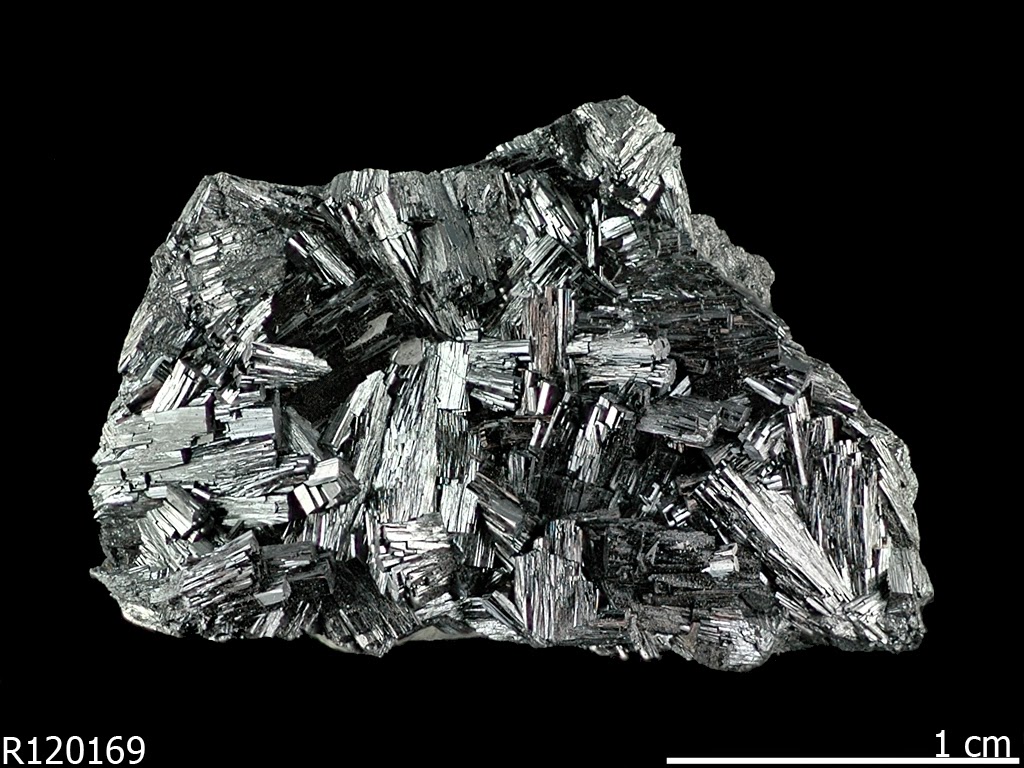
Plancheite

Locality: Kolwezi District, Katanga Copper Crescent, Katanga (Shaba), Democratic Republic of Congo (Zaïre) Dimensions: 5.9 cm x 3.2 cm x 2.6 cm”Courtesy of Rob Lavinsky, The Arkenstone, www.iRocks.com”

Chemical Formula: Cu8(Si8O22)(OH)4·H2O
Locality: Tantara and Kambowe, Zaire.
Name Origin: Named after J. Planche who brought it from Africa.

Plancheite is a hydrated copper silicate mineral with the formula Cu8(Si8O22)(OH)4·H2O. It is closely related to shattuckite in structure and appearance, and the two minerals are often confused.

Structure

Plancheite is a chain silicate (inosilicate), with double chains of silica tetrahedra parallel to the c crystal axis. It occurs as sprays of acicular or fibrous radial clusters, with fibers extended parallel to the chains, i.e. along the c crystal axis; it can also form tiny tabular or platy crystals. It is a member of the orthorhombic crystal class m m m (2/m 2/m 2/m), which is the most symmetrical class in the orthorhombic system.

History

Discovery date : 1908
Town of Origin : MINDOULI
Country of Origin : ZAIRE ex-CONGO

Optical properties

Optical and misc. Properties:  Translucide
Refractive Index: from 1,69 to 1,74
Axial angle 2V: 88,5°

Physical properties

Hardness : 6,00
Density : from 3,65 to 3,80
Color: pale blue; dark blue; green blue; greenish blue
Luster: adamantine; silky; unpolished; bright; satin-like
Streak : pale blue
Cleavage : NO

Photos :

Brochantite (XLS!) with Plancheite Musinoi Mine, Kolwezi, Democratic Republic of Congo Small Cabinet, 9 x 5.6 x 3.7 cm “Courtesy of Rob Lavinsky, The Arkenstone, www.iRocks.com”
Dioptase, plancheite 4.5×3.4×3.4 cm Tsumeb, Naibia Copyright © David K. Joyce Minerals

Promising new approach allows global and regional climate models to share process information

PNNL scientists developed an approach that allows climate models at different scales to share parameterizations and other information.

A new climate modeling approach that combines a detailed regional model with a more wide-ranging global model was developed by a team of researchers at Pacific Northwest National Laboratory, in collaboration with the University of Wyoming. This approach, described in a recent article in the journal Geoscientific Model Development, improves the way models represent atmospheric particles, clouds, and particle-cloud interactions and how they vary at regional and local scales. The approach minimizes inconsistencies in how process information is parameterized—that is, translated into simplifications that well represent process complexity.
“Our approach facilitates comparisons and produces results that agree more closely with real-world observations than previous approaches,” said Dr. Po-Lun Ma, PNNL atmospheric scientist and lead author of the paper.

Understanding the past and predicting future climate trends takes lots of computational power. Global climate models break up the planet in chunks of 100 kilometers and then average climate processes over that large grid space. Because of this large scale, scientists have struggled to accurately capture regional and local variations and extreme weather events in these models. Instead, researchers often use regional-scale climate models to characterize real-world weather events, but different representations of physical, chemical, and other processes between global and regional climate models produce inconsistent information about the atmosphere. In this study, scientists used the new modeling approach to consistently share the climate’s physical process complexities at all scales-global, regional, and local.

The PNNL research team transferred a set of Community Atmosphere Model version 5.1 (CAM5) physical parameters into the regional model Weather Research and Forecasting with Chemistry (WRF-Chem). The resulting approach allowed both the high-resolution regional model and the lower-resolution global model to share information, using the same equations and computer codes for the physical and chemical representation of clouds and aerosols and consistent estimates of emissions of gases and aerosol particles. Sharing information between the models helped the researchers understand the impact of model resolution on the simulation using a consistent framework and allowed them to avoid problems typically encountered when connecting models.

The team applied the approach at multiple horizontal resolutions over an area encompassing the northern Pacific Ocean, northeast Asia, and northwest North America for April 2008. This timeframe took advantage of the data collected by a series of field campaigns managed by the U.S. Department of Energy’s (DOE’s) Atmospheric Radiation Measurement (ARM) Climate Research Facility. The researchers then evaluated the model results against those field campaign measurements, data from satellites, and ground-based observations. The modules they created through this approach are now a part of WRF-Chem 3.5, which is available online for use by other researchers.

Scientists will use data from other field campaigns to determine which set of physical and chemical representations in the models produce results more consistent with observations and why. They will focus on simulations that explore how the scale of the model affects clouds and atmospheric particles in different climate regimes.

More information:
Ma PL, PJ Rasch, JD Fast, RC Easter, WI Gustafson Jr, X Liu, SJ Ghan, and B Singh. 2014. “Assessing the CAM5 Physics Suite in the WRF-Chem Model: Implementation, Resolution Sensitivity, and a First Evaluation for a Regional Case Study.” Geoscientific Model Development 7:755-778. DOI: 10.5194/gmd-7-755-2014

Note : The above story is based on materials provided by Pacific Northwest National Laboratory

Shatt al-Arab

Shatt al-Arab is a river in Southwest Asia of some 200 km (120 mi) in length, formed by the confluence of the Euphrates and the Tigris in the town of al-Qurnah in the Basra Governorate of southern Iraq. The southern end of the river constitutes the border between Iraq and Iran down to the mouth of the river as it discharges into the Persian Gulf. It varies in width from about 232 metres (761 ft) at Basra to 800 metres (2,600 ft) at its mouth. It is thought that the waterway formed relatively recently in geologic time, with the Tigris and Euphrates originally emptying into the Persian Gulf via a channel further to the west.

The Karun river, a tributary which joins the waterway from the Iranian side, deposits large amounts of silt into the river; this necessitates continuous dredging to keep it navigable.

The area is judged to hold the largest date palm forest in the world. In the mid-1970s, the region included 17 to 18 million date palms, an estimated one-fifth of the world’s 90 million palm trees. But by 2002, war, salt, and pests had wiped out more than 14 million of the palms, including around 9 million in Iraq and 5 million in Iran. Many of the remaining 3 to 4 million trees are in poor condition.

In Middle Persian literature and the Shahnama (written between c. 977 and 1010 AD), the name اروند Arvand is used for the Tigris, the confluent of the Shatt al-Arab. Iranians also used this name specifically to designate the Shatt al-Arab during the later Pahlavi period, and continue to do so after the Iranian Revolution of 1979.

Territorial disputes

Conflicting territorial claims and disputes over navigation rights between Iran and Iraq were among the main factors for the Iran–Iraq War that lasted from 1980 to 1988, when the pre-1980 status quo was restored. The Iranian cities of Abadan and Khorramshahr and the Iraqi city and major port of Basra are situated along this river.

Control of the waterway and its use as a border was a source of contention between Iran and the predecessor of the Iraqi state since a peace treaty signed in 1639 between the Persian and the Ottoman empires, which divided the territory according to tribal customs and loyalties, without attempting a rigorous land survey. The tribes on both sides of the lower waterway, however, are Marsh Arabs, and the Ottoman Empire claimed to represent them. Tensions between the opposing empires that extended across a wide range of religious, cultural and political conflicts, led to the outbreak of hostilities in the 19th century and eventually yielded the Second Treaty of Erzurum between the two parties, in 1847, after protracted negotiations, which included British and Russian delegates. Even afterwards, backtracking and disagreements continued, until British Foreign Secretary, Lord Palmerston, was moved to comment in 1851 that “the boundary line between Turkey and Persia can never be finally settled except by an arbitrary decision on the part of Great Britain and Russia”. A protocol between the Ottomans and the Persians was signed in Istanbul in 1913, which declared that the Ottoman-Persian frontier run along the thalweg, but World War I canceled all plans.

During the Mandate of Iraq (1920–32), the British advisors in Iraq were able to keep the waterway binational under the thalweg principle that worked in Europe: the dividing line was a line drawn between the deepest points along the stream bed. In 1937, Iran and Iraq signed a treaty that settled the dispute over control of the Shatt al-Arab. The 1937 treaty recognized the Iranian-Iraqi border as along the low-water mark on the eastern side of the Shatt al-Arab except at Abadan and Khorramshahr where the frontier ran along the thalweg (the deep water line) which gave Iraq control of almost the entire waterway; provided that all ships using the Shatt al-Arab fly the Iraqi flag and have an Iraqi pilot, and required Iran to pay tolls to Iraq whenever its ships used the Shatt al-Arab. By the late 1960s, the build-up of Iranian power under Shah Mohammad Reza Pahlavi, who had gone on a gargantuan military spending spree, led Iran to take a more assertive stance in the Near East. In April 1969, Iran abrogated the 1937 treaty over the Shatt al-Arab, and as such, Iran ceased paying tolls to Iraq when its ships used the Shatt al-Arab. The Shah justified his move by arguing that almost all river borders all over the world ran along the thalweg, and by claiming that because most of the ships that used the Shatt al-Arab were Iranian, the 1937 treaty was unfair to Iran. Iraq threatened war over the Iranian move, but when on 24 April 1969 an Iranian tanker escorted by Iranian warships sailed down the Shatt al-Arab, Iraq being the militarily weaker state did nothing. The Iranian abrogation of the 1937 treaty marked the beginning of a period of acute Iraqi-Iranian tension that was to last until the Algiers Accords of 1975.

All United Nations attempts to intervene as mediators were rebuffed. Under Saddam Hussein, Baathist Iraq claimed the entire waterway up to the Iranian shore as its territory. In response, Iran in the early 1970s became the main patron of Iraqi Kurdish groups fighting for independence from Iraq. In March 1975, Iraq signed the Algiers Accord in which it recognized a series of straight lines closely approximating the thalweg (deepest channel) of the waterway, as the official border, in exchange for which Iran ended its support of the Iraqi Kurds. In 1980, Hussein released a statement claiming to abrogate the treaty that he signed, and Iraq invaded Iran. (International law, however, holds that in all cases no bilateral or multilateral treaty can be abrogated by one party only.) The main thrust of the military movement on the ground was across the waterway which was the stage for most of the military battles between the two armies. The waterway was Iraq’s only outlet to the Persian Gulf, and thus, its shipping lanes were greatly affected by continuous Iranian attacks. When the Al-Faw peninsula was captured by the Iranians in 1986, Iraq’s shipping activities virtually came to a halt and had to be diverted to other Arab ports, such as Kuwait and even Aqaba, Jordan. At the end of the Iran–Iraq War both sides agreed to once again treat the Algiers Accord as binding.

Recent conflicts

In the 2003 invasion of Iraq, the waterway was a key military target for the Coalition Forces. Since it is the only outlet to the Persian Gulf, its capture was important in delivering humanitarian aid to the rest of the country, and also to stop the flow of operations trying to break the naval blockade against Iraq. The British Royal Marines staged an amphibious assault to capture the key oil installations and shipping docks located at Umm Qasr on the al-Faw peninsula at the onset of the conflict.

Following the end of the war, the UK was given responsibility, subsequently mandated by United Nations Security Council Resolution 1723, to patrol the waterway and the area of the Persian Gulf surrounding the river mouth. They were tasked until 2007 to make sure that ships in the area were not being used to transport munitions into Iraq. British forces also trained Iraqi naval units to take over the responsibility of guarding their waterways after the Coalition Forces left Iraq in December of 2011.

On two separate occasions, Iranian forces operating on the Shatt al-Arab have captured British Royal Navy sailors who they claim have trespassed into their territory.

  • In June 2004, several British servicemen were held for two days after purportedly straying into the Iranian side of the waterway. After being initially threatened with prosecution, they were released after high-level conversations between British Foreign Secretary Jack Straw and Iranian Foreign Minister Kamal Kharrazi. The initial hardline approach was put down to power struggles within the Iranian government. The British marines’ weapons and boats were confiscated.
  • In 2007, a seizure of fifteen more British personnel became a major diplomatic crisis between the two nations. It was resolved after thirteen days when the Iranians unexpectedly released the captives under an “amnesty.”

Note : The above story is based on materials provided by Wikipedia

Columnar Basalt , Mendisha Mountain , Egypt

White Desert, Farafra, Egypt

Produced By : Geology Page
Copyright © All Rights Reserved To Geology Page 2013

Plate Tectonics & Plate Boundaries Map

Produced By : Geology Page
Copyright © All Rights Reserved To Geology Page
Plate Boundary By : USGS

Plagionite

Plagionite Locality: San José Mine, Oruro City, Cercado Province, Oruro Department, Bolivia Size: miniature, 3.3 x 3.0 x 1.7 cm © Rob Lavinsky / iRocks

Chemical Formula: Pb5Sb8S17
Name Origin: From the Greek, plagios meaning “oblique.”

History

Discovery date : 1833
Town of Origin : MINE GRAF JOST-CHRISTINA-ZECKE, WOLFSBERG, HARZ
Country of Origin : ALLEMAGNE

Optical properties

Optical and misc. Propertie : Opaque
Reflective Power : 33,2-41% (580)

Physical properties

Hardness : 2,50
Density : 5,54
Color : blackish grey
Luster: metallic
Streak: blackish grey; reddish brown
Break: irregular; conchoidal
Cleavage : yes

Photos:

Plagionite and Zinkenite Locality: Graf Jost-Christian Mine, Wolfsberg, Harz Mountains, Saxony-Anhalt, Germany (Type Locality for Plagionite and Zinkenite) Overall Size: 4x3x1.5 cm Crystals: 0.1-1.0 mm © JohnBetts-FineMinerals
Plagionite Locality: San José Mine, Oruro City, Cercado Province, Oruro Department, Bolivia Size: 3.3 x 3.0 x 1.7 cm. © Rob Lavinsky / iRocks

Hot tropical oceans during Pliocene greenhouse warming

Tropical forest in Martinique near the city of Fond St-Denis. Credit: Wikipedia

The impact of the greenhouse gas CO2 on the Earth’s temperature is well established by climate models and temperature records over the past 100 years, as well as coupled records of carbon dioxide concentration and temperature throughout Earth history. However, past temperature records have suggested that warming is largely confined to mid-to-high latitudes, especially the poles, whereas tropical temperatures appear to be relatively stable: the tropical thermostat model.
The new results, published today in Nature Geoscience, contradict those previous studies and indicate that tropical sea surface temperatures were warmer during the early-to-mid Pliocene, an interval spanning about 5 to 3 million years ago.

The Pliocene is of particular interest because CO2 concentrations then were thought to have been about 400 parts per million, the highest level of the past 5 million years but a level that was reached for the first time last summer due to human activity. The higher CO2 levels of the Pliocene have long been associated with a warmer world, but evidence from tropical regions suggested relatively stable temperatures.

Project leader and Director of the Cabot Institute, Professor Richard Pancost said: “These results confirm what climate models have long predicted – that although greenhouse gases cause greater warming at the poles they also cause warming in the tropics. Such findings indicate that few places on Earth will be immune to global warming and that the tropics will likely experience associated climate impacts, such as increased tropical storm intensity.”

The scientists focussed their attention on the South China Sea which is at the fringe of a vast warm body of water, the West Pacific Warm Pool (WPWP). Some of the most useful temperature proxies are insensitive to temperature change in the heart of the WPWP, which is already at the maximum temperature they can record. By focussing on the South China Sea, the researchers were able to use a combination of geochemical records to reconstruct sea surface temperature in the past.

Not all of the records agree, however, and the researchers argue that certain tools used for reconstructing past ocean temperatures should be re-evaluated.

The paper’s first author, Charlotte O’Brien added: “It’s challenging to reconstruct the temperatures of the ocean many millions of years ago, and each of the tools we use has its own set of limitations. That is why we have used a combination of approaches in this investigation. We have shown that two different approaches agree – but a third approach agrees only if we make some assumptions about how the magnesium and calcium content of seawater has changed over the past 5 million years. That is an assumption that now needs to be tested.”

The work was funded by the UK’s Natural Environment Research Council and is ongoing.

Dr Gavin Foster at the University of Southampton is particularly interested in coupling the temperature records with improved estimates of Pliocene carbon dioxide levels. He said: “Just as we continue to challenge our temperature reconstructions we must challenge the corresponding carbon dioxide estimates. Together, they will help us truly understand the natural sensitivity of the Earth system and provide a better framework for predicting future climate change.”

More information:
Nature Geoscience, dx.doi.org/10.1038/ngeo2194

Note : The above story is based on materials provided by University of Bristol

Volga River

Map of the Volga watershed

The Volga is the longest river in Europe; it is also Europe’s largest river in terms of discharge and watershed. It flows through central Russia and is widely viewed as the national river of Russia. Eleven of the twenty largest cities of Russia, including the capital, Moscow, are situated in the Volga’s drainage basin. Some of the largest reservoirs in the world can be found along the Volga. The river has a symbolic meaning in Russian culture and is often referred to as Volga-Matushka (Mother Volga) in Russian literature and folklore.

Table of Contents

Nomenclature

The Russian hydronym Volga (Волга) derives from Proto-Slavic *vòlga “wetness, moisture”, which is preserved in many Slavic languages, including Ukrainian volóha (воло́га) “moisture”, Russian vlaga (влага) “moisture”, Bulgarian vlaga (влага) “moisture”, Czech vláha “dampness”, Serbo-Croatian vlȁga “moisture”, and Slovene vlaga “moisture” among others.

The Slavic name is a loan translation of earlier Scythian Rā (Ῥᾶ) “Volga”, literally “wetness”, seen also in Avestan Raŋhā “mythical stream” and Sogdian r’k “vein, blood vessel” (*raha-ka), and cognate with Sanskrit rasā́h “liquid, juice; mythical river”. The Scythian name survives in modern Mordvin Rav (Рав) “Volga”.

The Turkic peoples living along the river formerly referred to it as Itil or Atil “big river”. In modern Turkic languages, the Volga is known as İdel (Идел) in Tatar, Атăл (Atăl) in Chuvash, Idhel in Bashkir, Edil in Kazakh, and İdil in Turkish. The Turkic peoples associated the Itil’s origin with the Kama River. Thus, a left tributary to the Kama River was named the Aq Itil “White Itil” which unites with the Kara Itil “Black Itil” at the modern city of Ufa. The name Indyl (Indɨl) is used in Adyge (Cherkess) language.

Among Asians the river was known by its other Turkic name Sarı-su “yellow water”, but Mongols also used their own name: Ijil mörön “adaptation river”. Presently the Mari, another Uralic group, call the river Юл (Jul), meaning “way” in Tatar. Formerly, they called the river Volgydo, a borrowing from Old Russian.

Description

The Volga River is the longest river in Europe. It belongs to the closed basin of the Caspian Sea. Rising in the Valdai Hills 225 meters (738 ft) above sea level northwest of Moscow and about 320 kilometers (200 mi) southeast of Saint Petersburg, the Volga heads east past Lake Sterzh, Tver, Dubna, Rybinsk, Yaroslavl, Nizhny Novgorod, and Kazan. From there it turns south, flows past Ulyanovsk, Tolyatti, Samara, Saratov and Volgograd, and discharges into the Caspian Sea below Astrakhan at 28 meters (92 ft) below sea level. At its most strategic point, it bends toward the Don (“the big bend”). Volgograd, formerly Stalingrad, is located there.

The Volga has many tributaries, most importantly the Kama, the Oka, the Vetluga, and the Sura rivers. The Volga and its tributaries form the Volga river system, which flows through an area of about 1,350,000 square kilometres (521,238 square miles) in the most heavily populated part of Russia. The Volga Delta has a length of about 160 kilometres (99 miles) and includes as many as 500 channels and smaller rivers. The largest estuary in Europe, it is the only place in Russia where pelicans, flamingos, and lotuses may be found. The Volga freezes for most of its length for three months each year.

The Volga drains most of Western Russia. Its many large reservoirs provide irrigation and hydroelectric power. The Moscow Canal, the Volga–Don Canal, and the Volga–Baltic Waterway form navigable waterways connecting Moscow to the White Sea, the Baltic Sea, the Caspian Sea, the Sea of Azov and the Black Sea. High levels of chemical pollution have adversely affected the river and its habitats.

The fertile river valley provides large quantities of wheat, and also has many mineral riches. A substantial petroleum industry centers on the Volga valley. Other resources include natural gas, salt, and potash. The Volga Delta and the nearby Caspian Sea offer superb fishing grounds. Astrakhan, at the delta, is the center of the caviar industry.

Note : The above story is based on materials provided by Wikipedia

Phosphophyllite

Phosphophyllite (classic textbook twins) with Siderite and Sphalerite Locality: Unificada mine, Cerro Rico, Potosi, Potosi Department, Bolivia Specimen Size: 3.1 x 2.2 x 1.6 cm (thumbnail) Largest Crystal: 2 mm © minclassics

Chemical Formula: Zn2Fe(PO4)2·4H2O
Name Origin: Named after its chemical composition containing phosphorus and the Greek fyllon – meaning “leaf.”
Phosphophyllite is a rare mineral composed of hydrated zinc phosphate. Its name derives from its chemical composition (phosphate) and the Greek word for “leaf”, phyllon, a reference to its cleavage. It is highly prized by collectors for its rarity and for its delicate bluish green colour. Phosphophyllite is rarely cut because it is fragile and brittle, and large crystals are too valuable to be broken up.

The finest phosphophyllite crystals come from Potosí, Bolivia, but it is no longer mined there. Other sources include New Hampshire, USA and Hagendorf, Bavaria, Germany. It is often found in association with the minerals chalcopyrite and triphylite.

History

Discovery date : 1920
Town of Origin: PEGMATITE DE HAGENDORF, OBERPFALZ, BAVIERE
Country of Origin : ALLEMAGNE

Optical properties

Optical and misc. Properties: Transparent  –   Luminescent, fluorescent  –   Gemme, pierre fine  –   Fragile, cassant  –   Macles possibles  –
Refractive Index: from 1,59 to 1,61
Axial angle 2V: 44,3°

Physical properties

Hardness : from 3,00 to 3,50
Density : 3,13
Color : colorless; bluish green; blue green; pale green
Luster: vitreous
Streak: white
Break: irregular
Cleavage: yes

Photos :

Phosphophyllite Locality: Huayllani mine, Infiernillos mine, Huayllani, Machacamarca District, Saavedra Province, Potosi Department, Bolivia Specimen Size: 5.2 x 3.7 x 1.8 cm (small cabinet) Largest Crystal: 5 mm minclassics
Phosphophyllite (classic “butterfly” twins) Locality: Huayllani mine, Infiernillos mine, Huayllani, Machacamarca District, Saavedra Province, Potosi Department, Bolivia (new locality for Phosphophyllite in Bolivia) Specimen Size: 3.3 x 2.1 x 1.7 cm (miniature) Largest Crystal: 2.3 cm © minclassics
Phosphophyllite Unificada Mine, Cerro de Potosi, Potosi City, Potosi Department, Bolivia Thumbnail, 18 x 9 x 6 mm; 10.32 cts © irocks

Fracking flowback could pollute groundwater with heavy metals

Partially wetted sand grains (grey) with colloids (red)

ITHACA, N.Y. – The chemical makeup of wastewater generated by “hydrofracking” could cause the release of tiny particles in soils that often strongly bind heavy metals and pollutants, exacerbating the environmental risks during accidental spills, Cornell University researchers have found.
Previous research has shown 10 to 40 percent of the water and chemical solution mixture injected at high pressure into deep rock strata, surges back to the surface during well development. Scientists at the College of Agriculture and Life Sciences studying the environmental impacts of this “flowback fluid” found that the same properties that make it so effective at extracting natural gas from shale can also displace tiny particles that are naturally bound to soil, causing associated pollutants such as heavy metals to leach out.

They described the mechanisms of this release and transport in a paper published in the American Chemical Society journal Environmental Science & Technology.

The particles they studied are colloids – larger than the size of a molecule but smaller than what can be seen with the naked eye – which cling to sand and soil due to their electric charge.

In experiments, glass columns were filled with sand and synthetic polystyrene colloids. They then flushed the column with different fluids – deionized water as a control, and flowback fluid collected from a Marcellus Shale drilling site – at different rates of flow and measured the amount of colloids that were mobilized.

On a bright field microscope, the polystyrene colloids were visible as red spheres between light-grey sand grains, which made their movement easy to track. The researchers also collected and analyzed the water flowing out of the column to quantify the colloid concentration leaching out.

They found that fewer than five percent of colloids were released when they flushed the columns with deionized water. That figure jumped to 32 to 36 percent when flushed with flowback fluid. Increasing the flow rate of the flowback fluid mobilized an additional 36 percent of colloids.

They believe this is because the chemical composition of the flowback fluid reduced the strength of the forces that allow colloids to remain bound to the sand, causing the colloids to actually be repelled from the sand.

“This is a first step into discovering the effects of flowback fluid on colloid transport in soils,” said postdoctoral associate Cathelijne Stoof, a co-author on the paper.

The authors hope to conduct further experiments using naturally occurring colloids in more complex field soil systems, as well as different formulations of flowback fluid collected from other drilling sites.

Stoof said awareness of the phenomenon and an understanding of the mechanisms behind it can help identify risks and inform mitigation strategies.

“Sustainable development of any resource requires facts about its potential impacts, so legislators can make informed decisions about whether and where it can and cannot be allowed, and to develop guidelines in case it goes wrong,” Stoof said. “In the case of spills, you want to know what happens when the fluid moves through the soil.”

This research was supported by the Cornell University Agricultural Experiment Station’s USDA Hatch funds, as well as the U.S. National Science Foundation and the National Natural Science Foundation of China.

Note : The above story is based on materials provided by Melissa Osgood ” Cornell University “

Araguaia River

Map of the Araguaia/Tocantins Watershed

The Araguaia River is one of the major rivers of Brazil, and the principal tributary of the Tocantins, though it is almost equal in volume at its confluence with the Tocantins. It has a total length of approximately 2,627 km. Araguaia means “river of (red) macaws” in the Tupi language.

Table of Contents

Geography

Because of the vast number of tributaries, it is not easy to define its source. Important tributaries originate in the Araras mountain range in Mato Grosso as well in the Divisões mountain range situated in Goiás (according to other sources however, the Araguaia comes from the Caiapó Range, at the Goiás-Mato Grosso border). From there it flows northeast to a junction with the Tocantins near the town of São João.

Along its course, the river forms the border between the Brazilian federal states of Goiás, Mato Grosso, Tocantins and Pará. Roughly in the middle of its course, the Araguaia splits into two forks (with the western one retaining the name Araguaia and the eastern one being called Rio Javaés). These later reunite, forming the Ilha do Bananal, the world’s largest river island. The mouth of the Javaés forms a broad inland delta where it pours back into the main Araguaia, a 100,000 hectare expanse of igapó flooded forest, blackwater river channels, and oxbow lakes called Cantão. This is one of the biologically richest areas of the eastern Amazon, with over 700 species of birds, nearly 300 species of fish, large populations of threatened species such as the giant otter, the black cayman, the world’s largest freshwater fish, the pirarucú, and the endemic Araguaian river dolphin (or Araguaian boto) all occurring within a relatively small area.

A large portion of the Araguaia’s course is navigable all year, but the river below the Cantão wetlands is interrupted by rapids.

The combined watershed of Araguaia and Tocantins rivers (named the Araguaia Tocantins Basin) covers approximately 9.5% of Brazil’s national territory. This area is an integral part of the Amazon Basin. However, the Araguaia River is not a tributary of the Amazon.

“Araguaia” means “River of the Macaws” in the native Tupi language.

Tributaries

Its principal tributary is the Rio das Mortes, which rises in the Serra de São Jerônimo, near Cuiabá, Mato Grosso, and is navigable to Pará.

Other important tributaries include the Bonito, Garcas, Cristallino and Tapirape on the west, and the Pitombas, Claro, Vermelho, Tucupa and Chavante on the east.

Note : The above story is based on materials provided by Wikipedia

Phosgenite

Phosgenite Monteponi Mine, Iglesias, Province of Carbonia-Iglesias, Sardinia, Italy Specimen weight:155 gr. Crystal size:2,8 cm Overall size:5,5 x 3 x 3,5 cm © minservice
Chemical Formula: Pb2CO3Cl2
Name Origin: Named from the composition phosgene (COCl2), as the mineral contains this compound.Phosgenite is a rare mineral consisting of lead chlorocarbonate, Pb2CO3Cl2. The tetragonal crystals are prismatic or tabular in habit: they are usually colorless and transparent, and have a brilliant adamantine lustre. Sometimes the crystals have a curious helical twist about the tetrad or principal axis. The hardness is 3 and the specific gravity 6.3. The mineral is rather sectile, and consequently was earlier known as corneous lead.

Name and occurrence

The name phosgenite was given by August Breithaupt in 1820, from phosgene, carbon oxychloride, because the mineral contains the elements carbon, oxygen and chlorine.

It was found associated with anglesite and matlockite in cavities within altered galena in a lead mine at Cromford, near Matlock: hence its common name cromfordite. Crystals are also found in galena at Monteponi near Iglesias in Sardinia, and near Dundas in Tasmania. It has also been reported from Laurium, Greece; Tarnowitz, Poland; the Altai district, Siberia; the Touissit mine, near Oujda, Morocco; Sidi Amor ben Salem, Tunisia; Tsumeb, Namibia; Broken Hill, New South Wales; and Boleo, near Santa Rosalia, Baja California. In the US it has been reported from the Terrible mine, Custer County, Colorado; the Stevenson-Bennett mine, Organ Mountains, Doña Ana County, New Mexico; and the Mammoth mine, Tiger, Pinal County, Arizona.

Crystals of phosgenite, and also of the corresponding bromine compound Pb2Br2CO3, have been prepared artificially.

History

Discovery date : 1800

Optical properties

Optical and misc. Properties : Luminescent, fluorescent  –   Transparent  –   Translucide  –   Gemme, pierre fine
Refractive Index: from 2,11 to 2,14

Physical properties

Hardness : from 2,00 to 3,00
Density : 6,13
Color: colorless; white; yellowish white; grey; brown; greenish; pinkish; pale brown
Luster : adamantine; vitreous; greasy; waxy
Streak: white
Break : conchoidal
Cleavage: Yes

Photos:

Phosgenite Monteponi mine – Iglesias – Carbonia-Iglesias prov. – Sardinia – Italy Specimen weight:850 gr. Crystal size:mm. 17 x 14 x 12 Overall size: 85mm x 45 mm x 70 mm © minservice
Phosgenite Monteponi Mine, Iglesias, Province of Carbonia-Iglesias, Sardinia, Italy Specimen weight:25 gr. Crystal size:2,5 cm Overall size: 29mm x 22 mm x 15 mm © minservice
Phosgenite Monteponi Mine, Iglesias, Carbonia-Iglesias, Sardegna  Italy (1989-1992) Specimen size: 5.6 × 4.4 × 1.8 cm = 2.2” × 1.7” × 0.7” Main crystal size: 5.2 × 4 cm = 2.0” × 1.6” © Fabre Minerals

Extinct undersea volcanoes squashed under Earth’s crust cause tsunami earthquakes

New research has revealed the causes and warning signs of rare tsunami earthquakes, which may lead to improved detection measures.

Tsunami earthquakes happen at relatively shallow depths in the ocean and are small in terms of their magnitude. However, they create very large tsunamis, with some earthquakes that only measure 5.6 on the Richter scale generating waves that reach up to ten metres when they hit the shore.

A global network of seismometers enables researchers to detect even the smallest earthquakes. However, the challenge has been to determine which small magnitude events are likely to cause large tsunamis.

In 1992, a magnitude 7.2 tsunami earthquake occurred off the coast of Nicaragua in Central America causing the deaths of 170 people. Six hundred and thirty seven people died and 164 people were reported missing following a tsunami earthquake off the coast of Java, Indonesia, in 2006, which measured 7.2 on the Richter scale.

The new study, published in the journal Earth and Planetary Science Letters, reveals that tsunami earthquakes may be caused by extinct undersea volcanoes causing a “sticking point” between two sections of Earth’s crust called tectonic plates, where one plate slides under another.

The researchers from Imperial College London and GNS Science in New Zealand used geophysical data collected for oil and gas exploration and historical accounts from eye witnesses relating to two tsunami earthquakes, which happened off the coast of New Zealand’s north island in 1947. Tsunami earthquakes were only identified by geologists around 35 years ago, so detailed studies of these events are rare.

The team located two extinct volcanoes off the coast of Poverty Bay and Tolaga Bay that have been squashed and sunk beneath the crust off the coast of New Zealand, in a process called subduction.

The researchers suggest that the volcanoes provided a “sticking point” between a part of Earth’s crust called the Pacific plate, which was trying to slide underneath the New Zealand plate. This caused a build-up of energy, which was released in 1947, causing the plates to “unstick” and the Pacific plate to move and the volcanoes to become subsumed under New Zealand. This release of the energy from both plates was unusually slow and close to the seabed, causing large movements of the sea floor, which led to the formation of very large tsunami waves.

All these factors combined, say the researchers, are factors that contribute to tsunami earthquakes. The researchers say that the 1947 New Zealand tsunami earthquakes provide valuable insights into what geological factors cause these events. They believe the information they’ve gathered on these events could be used to locate similar zones around the world that could be at risk from tsunami earthquakes. Eyewitnesses from these tsunami earthquakes also describe the type of ground movement that occurred and this provides valuable clues about possible early warning signals for communities.

Dr Rebecca Bell, from the Department of Earth Science and Engineering at Imperial College London, says: “Tsunami earthquakes don’t create massive tremors like more conventional earthquakes such as the one that hit Japan in 2011, so residents and authorities in the past haven’t had the same warning signals to evacuate. These types of earthquakes were only identified a few decades ago, so little information has been collected on them. Thanks to oil exploration data and eyewitness accounts from two tsunami earthquakes that happened in New Zealand more than 70 years ago, we are beginning to understand for first time the factors that cause these events. This could ultimately save lives.”

By studying the data and reports, the researchers have built up a picture of what happened in New Zealand in 1947 when the tsunami earthquakes hit. In the March earthquake, eyewitnesses around Poverty Bay on the east coast of the country, close to the town of Gisborne, said that they didn’t feel violent tremors, which are characteristic of typical earthquakes. Instead, they felt the ground rolling, which lasted for minutes, and brought on a sense of sea sickness. Approximately 30 minutes later the bay was inundated by a ten metre high tsunami that was generated by a 5.9 magnitude offshore earthquake. In May, an earthquake measuring 5.6 on the Richter scale happened off the coast of Tolaga Bay, causing an approximate six metre high tsunami to hit the coast. No lives were lost in the New Zealand earthquakes as the areas were sparsely populated in 1947. However, more recent tsunami earthquakes elsewhere have devastated coastal communities.

The researchers are already working with colleagues in New Zealand to develop a better warning system for residents. In particular, new signage is being installed along coastal regions to alert people to the early warning signs that indicate a possible tsunami earthquake. In the future, the team hope to conduct new cutting-edge geophysical surveys over the sites of other sinking volcanoes to better understand their characteristics and the role they play in generating this unusual type of earthquake.

Note : The above story is based on materials provided by Imperial College London.

New theory on cause of ice age 2.6 million years ago

Researchers analysed deposits of wind-blown dust in northern China to reconstruct monsoon and temperature patterns. Credit: Image courtesy of University of Royal Holloway London

New research in the journal Nature’s Scientific Reports has provided a major new theory on the cause of the ice age that covered large parts of the Northern Hemisphere 2.6 million years ago.
The study, co-authored by Dr Thomas Stevens, from the Department of Geography at Royal Holloway, University of London, found a previously unknown mechanism by which the joining of North and South America changed the salinity of the Pacific Ocean and caused major ice sheet growth across the Northern Hemisphere.

The change in salinity encouraged sea ice to form which in turn created a change in wind patterns, leading to intensified monsoons. These provided moisture that caused an increase in snowfall and the growth of major ice sheets, some of which reached 3km thick.

The team of researchers analyzed deposits of wind-blown dust called red clay that accumulated between six million and two and a half million years ago in north central China, adjacent to the Tibetan plateau, and used them to reconstruct changing monsoon precipitation and temperature.

“Until now, the cause of the Quaternary ice age had been a hotly debated topic,” said Dr Stevens. “Our findings suggest a significant link between ice sheet growth, the monsoon and the closing of the Panama Seaway, as North and South America drifted closer together. This provides us with a major new theory on the origins of the ice age, and ultimately our current climate system.”

Surprisingly, the researchers found there was a strengthening of the monsoon during global cooling, instead of the intense rainfall normally associated with warmer climates.

Dr Stevens added: “This led us to discover a previously unknown interaction between plate tectonic movements in the Americas and dramatic changes in global temperature. The intensified monsoons created a positive feedback cycle, promoting more global cooling, more sea ice and even stronger precipitation, culminating in the spread of huge glaciers across the Northern Hemisphere.”

Note : The above story is based on materials provided by University of Royal Holloway London.

Phlogopite

Phlogopite in Calcite Franklin, Sussex Co., New Jersey, USA Small Cabinet, 8.6 x 7.1 x 6.4 cm “Courtesy of Rob Lavinsky, The Arkenstone, www.iRocks.com”
Chemical Formula: KMg3(AlSi3O10)(OH,F)2
Name Origin: From the Greek flogopos – “resembling fire.”Phlogopite is a yellow, greenish, or reddish-brown member of the mica family of phyllosilicates. It is also known as magnesium mica.Phlogopite is the magnesium endmember of the biotite solid solution series, with the chemical formula KMg3(AlSi3O10)(OH,F)2. Iron substitutes for magnesium in variable amounts leading to the more common biotite with higher iron content. For physical and optical identification, it shares most of the characteristic properties of biotite.

History

Discovery date : 1841
Town of Origin: ANTWERP, NEW YORK
Country of Origin : USA

Optical properties

Optical and misc. Properties : Luminescent, fluorescent  –   Flexible  –   Elastique  –   Tenace  –   Transparent  –   Translucide  –   Macles possibles
Refractive Index : from 1,53 to 1,63
Axial angle 2V: 0-15°

Physical properties

Hardness : from 2,00 to 3,00
Density: from 2,78 to 2,85
Color : yellowish brown; brownish red; colorless; white; greenish; grey; brown yellow; blackish; whitish; green
Luster : submetallic; nacreous
Streak : white
Cleavage : Yes

Photos:

Flogopite San Vito quarry, Monte Somma, Campania, Italy Specimen weight:52 gr. Crystal size:1 mm Overall size: 53mm x 32 mm x 33 mm © minservice
Phlogopite Bancroft, Ontario, Canada Cabinet, 34.7 x 26.3 x 1.6 cm © ircoks


Tocantins River

Map of the Araguaia/Tocantins Watershed.

The Tocantins is a river in Brazil, the central fluvial artery of the country. In the Tupi language, its name means “toucan’s beak” (Tukã for “toucan” and Ti for “beak”). It runs from south to north for about 2,640 km. It is not really a branch of the Amazon River, although usually so considered, since its waters flow into the Atlantic Ocean alongside those of the Amazon. It flows through four Brazilian states (Goiás, Tocantins, Maranhão and Pará) and gives its name to one of Brazil’s newest states, formed in 1988 from what was until then the northern portion of Goiás.

Course

It rises in the mountainous district known as the Pireneus, west of the Federal District, but its western tributary, the Araguaia River, has its extreme southern headwaters on the slopes of the Serra dos Caiapós. The Araguaia flows 1,670 km before its confluence with the Tocantins, to which it is almost equal in volume. Besides its main tributary, the Rio das Mortes, the Araguaia has twenty smaller branches, offering many miles of canoe navigation. In finding its way to the lowlands, it breaks frequently into waterfalls and rapids, or winds violently through rocky gorges, until, at a point about 160 km above its junction with the Tocantins, it saws its way across a rocky dyke for 20 km in roaring cataracts.

Two other tributaries, called the Maranhão and Paranatinga, collect an immense volume of water from the highlands which surround them, especially on the south and south-east. Between the latter and the confluence with the Araguaia, the Tocantins is occasionally obstructed by rocky barriers which cross it almost at a right angle.

Fauna

The Tocantins River Basin (which include the Araguaia River) is the home of several large aquatic mammals such as Amazonian manatee, Araguaian river dolphin and tucuxi, and larger reptiles such as black caiman, spectacled caiman and yellow-spotted river turtle.

The Tocantins River Basin has a high richness of fish species, although it is relatively low by Amazon Basin standards. More than 350 fish species have been registered, including more than 175 endemics. The most species rich families are Characidae (tetras and allies), Loricariidae (pleco catfish and allies) and Rivulidae (South American killifish). While most species essentially are of Amazonian origin, there are also some showing a connection with the Paraná and São Francisco rivers. The Tocantins and these two rivers flow in different directions, but all have their source in the Brazilian Plateau in a region where a low watershed allows some exchange between them. There are several fish species that migrate along the Tocantins to spawn, but this has been restricted by the dams. Following the construction of the massive Tucuruí dam, the flow of the river changed. Some species have been adversely affected and there has been a substantial reduction in species richness in parts of the river.

Dams

Downstream from the Araguaia confluence, in the state of Pará, the river used to have many cataracts and rapids, but they were flooded in the early 1980s by the artificial lake created by the Tucuruí dam, one of the world’s largest. When the second phase of the Tucuruí project is completed, there will be a system of locks that will make a long extension of the river navigable. The construction works on the locks have been stalled for many years due to lack of funding, but it is possible that they will be included in a massive development program launched by the Brazilian government in 2007, in which case they could be operational within about four years.

In total there are four dams on the river, of which the largest are the Tucuruí and the Serra da Mesa Dam.

Geology

The flat, broad valleys, composed of sand and clay, of both the Tocantins and its Araguaia branch are overlooked by steep bluffs. They are the margins of the great sandstone plateaus, from 300 to 600 m elevation above sea-level, through which the rivers have eroded their deep beds. Around the estuary of the Tocantins the great plateau has disappeared, to give place to a part of the forest-covered, half submerged alluvial plain, which extends far to the north-east and west. The Pará River, generally called one of the mouths of the Amazon, is only the lower reach of the Tocantins. If any portion of the waters of the Amazon runs round the southern side of the large island of Marajó into the river Para, it is only through tortuous, natural canals, which are in no sense outflow channels of the Amazon.

Discharge

The Tocantins River records a mean discharge rate of 13,598 m³/s and a specific discharge rate of 14.4 l/s/km². The sub-basins have the following specific discharge rates: Tocantins (11 l/s/km²), Araguaia (16 l/s/km²), Pará (17l/s/km²) and Guamá (21l/s/km²).

Note : The above story is based on materials provided by Wikipedia

Researchers develop a geothermometer for methane formation

The Thermo IRMS 253 Ultra is Caltech’s prototype mass spectrometer, which enables John Eiler and his team to determine formation temperatures for methane samples. Credit: Caltech

Methane is a simple molecule consisting of just one carbon atom bound to four hydrogen atoms. But that simplicity belies the complex role the molecule plays on Earth—it is an important greenhouse gas, is chemically active in the atmosphere, is used in many ecosystems as a kind of metabolic currency, and is the main component of natural gas, which is an energy source.
Methane also poses a complex scientific challenge: it forms through a number of different biological and nonbiological processes under a wide range of conditions. For example, microbes that live in cows’ stomachs make it; it forms by thermal breakdown of buried organic matter; and it is released by hot hydrothermal vents on the sea floor. And, unlike many other, more structurally complex molecules, simply knowing its chemical formula does not necessarily reveal how it formed. Therefore, it can be difficult to know where a sample of methane actually came from.

But now a team of scientists led by Caltech geochemist John M. Eiler has developed a new technique that can, for the first time, determine the temperature at which a natural methane sample formed. Since methane produced biologically in nature forms below about 80°C, and methane created through the thermal breakdown of more complex organic matter forms at higher temperatures (reaching 160°C-220°C, depending on the depth of formation), this determination can aid in figuring out how and where the gas formed.

A paper describing the new technique and its first applications as a geothermometer appears in a special section about natural gas in the current issue of the journal Science. Former Caltech graduate student Daniel A. Stolper (PhD ’14) is the lead author on the paper.

“Everyone who looks at methane sees problems, sees questions, and all of these will be answered through basic understanding of its formation, its storage, its chemical pathways,” says Eiler, the Robert P. Sharp Professor of Geology and professor of geochemistry at Caltech.

“The issue with many natural gas deposits is that where you find them—where you go into the ground and drill for the methane—is not where the gas was created. Many of the gases we’re dealing with have moved,” says Stolper. “In making these measurements of temperature, we are able to really, for the first time, say in an independent way, ‘We know the temperature, and thus the environment where this methane was formed.'”

Eiler’s group determines the sources and formation conditions of materials by looking at the distribution of heavy isotopes—species of atoms that have extra neutrons in their nuclei and therefore have different chemistry. For example, the most abundant form of carbon is carbon-12, which has six protons and six neutrons in its nucleus. However, about 1 percent of all carbon possesses an extra neutron, which makes carbon-13. Chemicals compete for these heavy isotopes because they slow molecular motions, making molecules more stable. But these isotopes are also very rare, so there is a chemical tug-of-war between molecules, which ends up concentrating the isotopes in the molecules that benefit most from their stabilizing effects. Similarly, the heavy isotopes like to bind, or “clump,” with each other, meaning that there will be an excess of molecules containing two or more of the isotopes compared to molecules containing just one. This clumping effect is strong at low temperatures and diminishes at higher temperatures. Therefore, determining how many of the molecules in a sample contain heavy isotopes clumped together can tell you something about the temperature at which the sample formed.

Eiler’s group has previously used such a “clumped isotope” technique to determine the body temperatures of dinosaurs, ground temperatures in ancient East Africa, and surface temperatures of early Mars. Those analyses looked at the clumping of carbon-13 and oxygen-18 in various minerals. In the new work, Eiler and his colleagues were able to examine the clumping of carbon-13 and deuterium (hydrogen-2).

The key enabling technology was a new mass spectrometer that the team designed in collaboration with Thermo Fisher, mixing and matching existing technologies to piece together a new platform. The prototype spectrometer, the Thermo IRMS 253 Ultra, is equipped to analyze samples in a way that measures the abundances of several rare versions, or isotopologues, of the methane molecule, including two “clumped isotope” species: 13CH3D, which has both a carbon-13 atom and a deuterium atom, and 12CH2D2, which includes two deuterium atoms.

Using the new spectrometer, the researchers first tested gases they made in the laboratory to make sure the method returned the correct formation temperatures.

They then moved on to analyze samples taken from environments where much is known about the conditions under which methane likely formed. For example, sometimes when methane forms in shale, an impermeable rock, it is trapped and stored, so that it cannot migrate from its point of origin. In such cases, detailed knowledge of the temperature history of the rock constrains the possible formation temperature of methane in that rock. Eiler and Stolper analyzed samples of methane from the Haynesville Shale, located in parts of Arkansas, Texas, and Louisiana, where the shale is not thought to have moved much after methane generation. And indeed, the clumped isotope technique returned a range of temperatures (169°C-207°C) that correspond well with current reservoir temperatures (163°C-190°C). The method was also spot-on for methane collected from gas that formed as a product of oil-eating bugs living on top of oil reserves in the Gulf of Mexico. It returned temperatures of 34°C and 48°C plus or minus 8°C for those samples, and the known temperatures of the sampling locations were 42°C and 48°C, respectively.

To validate further the new technique, the researchers next looked at methane from the Marcellus Shale, a formation beneath much of the Appalachian basin, where the gas-trapping rock is known to have formed at high temperature before being uplifted into a cooler environment. The scientists wanted to be sure that the methane did not reset to the colder temperature after formation. Using their clumped isotope technique, the researchers verified this, returning a high formation temperature.

“It must be that once the methane exists and is stable, it’s a fossil remnant of what its formation environment was like,” Eiler says. “It only remembers where it formed.”

An important application of the technique is suggested by the group’s measurements of methane from the Antrim Shale in Michigan, where groundwater contains both biologically and thermally produced methane. Clumped isotope temperatures returned for samples from the area clearly revealed the different origins of the gases, hitting about 40°C for a biologically produced sample and about 115°C for a sample involving a mix of biologically and thermally produced methane.

“There are many cases where it is unclear whether methane in a sample of groundwater is the product of subsurface biological communities or has leaked from petroleum-forming systems,” says Eiler. “Our results from the Antrim Shale indicate that this clumped isotope technique will be useful for distinguishing between these possible sources.”

One final example, from the Potiguar Basin in Brazil, demonstrates another way the new method will serve geologists. In this case the methane was dissolved in oil and had been free to migrate from its original location. The researchers initially thought there was a problem with their analysis because the temperature they returned was much higher than the known temperature of the oil. However, recent evidence from drill core rocks from the region shows that the deepest parts of the system actually got very hot millions of years ago. This has led to a new interpretation suggesting that the methane gas originated deep in the system at high temperatures and then percolated up and mixed into the oil.

“This shows that our new technique is not just a geothermometer for methane formation,” says Stolper. “It’s also something you can use to think about the geology of the system.”

More information:
Formation temperatures of thermogenic and biogenic methane, by D.A. Stolper et al. www.sciencemag.org/lookup/doi/… 1126/science.1254509

Note : The above story is based on materials provided by California Institute of Technology

Related Articles