CA lot can happen to water as it rises to the surface from deep underground. It can mix with groundwater, for example. This makes it difficult for scientists to estimate the temperature of a geothermal reservoir, which is an important step as they decide whether a site merits further exploration as a source of clean, renewable energy.
Now, Berkeley Lab researchers have developed a new way to take a geothermal reservoir’s temperature.
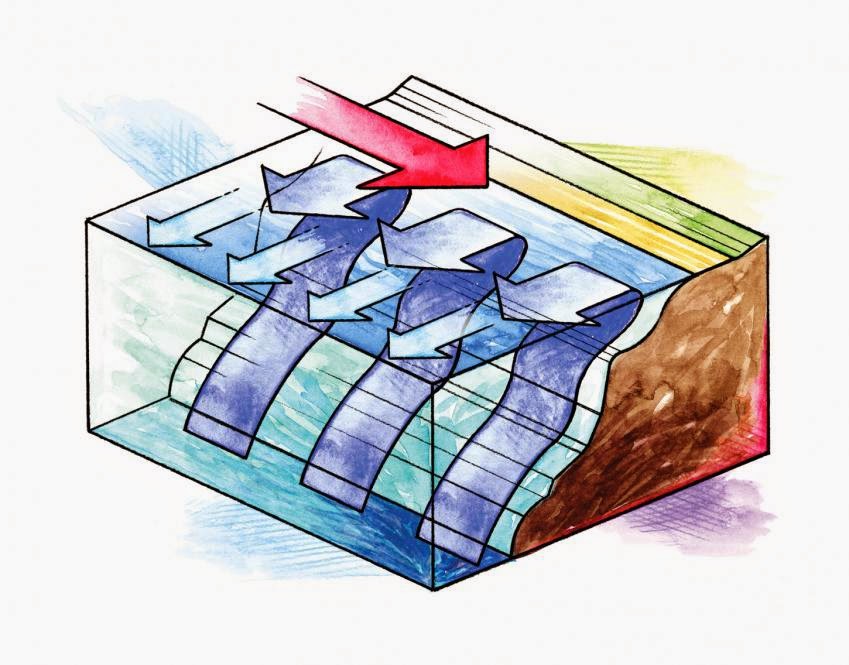
The method isn’t new really, but rather a high-tech makeover of a 20-year-old technique. It’s a computer program, called GeoT, which calculates a deep reservoir’s temperature by starting with the concentrations of dissolved salts in a fluid sample obtained at the surface, such as from a hot spring. It then reconstructs the data to reflect what the water composition would be in a deep geothermal reservoir, which can be one kilometer underground.
Because the solubility of a mineral is a function of temperature, this reconstruction can indicate the temperature of the subsurface reservoir.
Initial tests show that the technique has the potential to be more reliable than current methods for thermal waters that have mixed with groundwater, lost gases, or both. As such, it could become a valuable tool to help scientists evaluate geothermal sites.
“Our method is not intended to replace older techniques, but to complement them and advance a way of investigating deep reservoirs in a more integrated manner,” says Nicolas Spycher, a scientist in Berkeley Lab’s Earth Sciences Division who leads the project.
“It’s another way of increasing our confidence over whether a geothermal resource is worth further study,” Spycher adds.
The technique is based on a time-tested method called solute geothermometry, in which the temperature of a deep reservoir is estimated by measuring the concentrations of dissolved minerals in a water sample. Simple tests are based on the concentration of silica, while others use elements such as sodium and potassium.
But these chemical signatures can change as fluid rises. Minerals can reach a new equilibrium, water can boil away as pressure changes, or the fluid can mix with saline water. When this happens, a fluid sample obtained at the surface may not be a good indicator of a subsurface reservoir’s temperature.
Back in the mid 1980s, Spycher, then a graduate student at the University of Oregon, helped Prof. Mark Reed develop a method that estimates a reservoir’s temperature by measuring the full water composition, not just one or two elements. This “whole-water analysis” irons out some of the influences that perturb traditional solute geothermometry measurements.
Working with several scientists, Spycher has now modernized this approach by developing GeoT. The program automatically reconstructs the deep-reservoir composition of a fluid sample, and then estimates the reservoir temperature by numerically lining up the myriad saturation points of the minerals in the sample. Unknown or poorly understood variables are estimated by numerical optimization.
The software has been tested on a well-characterized geothermal system at Dixie Valley, Nevada.
“In the past, processing whole-water analyses was time-consuming, and lining-up mineral saturation points required eyeballing and trial and error,” says Spycher. “Our new software makes the process much easier, and allows processing multiple waters at the same time.”
More information:
N. Spycher, L. Peiffer, E.L. Sonnenthal, G. Saldi, M.H. Reed, B.M. Kennedy, “Integrated multicomponent solute geothermometry,” Geothermics, Volume 51, July 2014, Pages 113-123, ISSN 0375-6505, dx.doi.org/10.1016/j.geothermics.2013.10.012 (www.sciencedirect.com/science/… ii/S0375650513001016)
Note : The above story is based on materials provided by Lawrence Berkeley National Laboratory