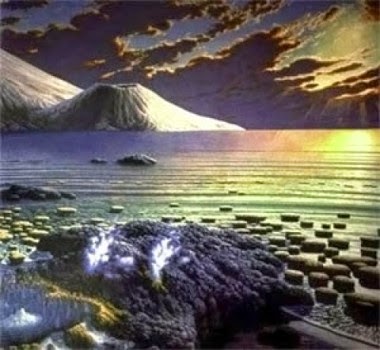
Earth’s landscape, as it may have looked more than 2.5 billion years ago. Credit: From a painting by Peter Sawyer, The Smithsonian Institute; Courtesy of Syracuse University
Geologists in the College of Arts and Sciences have discovered a new way to study oxygen levels in Earth’s oldest oceans.
Zunli Lu and Xiaoli Zhou, an assistant professor and Ph.D. student, respectively, in the Department of Earth Sciences, are part of an international team of researchers whose findings have been published by the journal Geology (Geological Society of America, 2014). Their research approach may have important implications for the study of marine ecology and global warming.
“More than 2.5 billion years ago, there was little to no oxygen in the oceans, as methane shrouded the Earth in a haze,” says Lu, a member of Syracuse University’s Low-Temperature Geochemistry Research Group. “Organisms practicing photosynthesis eventually started to overpower reducing chemical compounds [i.e., electron donors], and oxygen began building up in the atmosphere. This period has been called the Great Oxidation Event.”
Using a novel approach called iodine geochemistry, Lu, Zhou and their colleagues have confirmed the earliest appearance of dissolved oxygen in the ocean’s surface waters.
Central to their approach is iodate, a form of iodine that exists only in oxygenated waters. When iodate is detected in carbonate rocks in a marine setting, Lu and company are able to measure the elemental ratio of iodine to calcium. This measurement, known as a proxy for ocean chemistry, helps them figure out how much oxygen has dissolved in the water.
“Iodine geochemistry enables us to constrain oxygen levels in oceans that have produced calcium carbonate minerals and fossils,” says Lu, who developed the proxy. “What we’ve found in ancient rock reinforces the proxy’s reliability. Already, we’re using the proxy to better understand the consequences of ocean deoxygenation, due to rapid global warming.”
In addition to Lu and Zhou, the article was co-authored by Dalton S. Hardistry, a graduate student at the University of California, Riverside; Noah J. Planavsky, assistant professor of geology and geophysics at Yale University; Andrey Bekker, assistant professor of geological sciences at the University of Manitoba (Canada); Pascal Philippot, professor of physics at the University of Denis Diderot in Paris (France); and Timothy W. Lyons, professor of biogeochemistry at UC Riverside.
Journal Reference:
D. S. Hardisty, Z. Lu, N. J. Planavsky, A. Bekker, P. Philippot, X. Zhou, T. W. Lyons. An iodine record of Paleoproterozoic surface ocean oxygenation. Geology, 2014; DOI: 10.1130/G35439.1
Note : The above story is based on materials provided by Syracuse University.
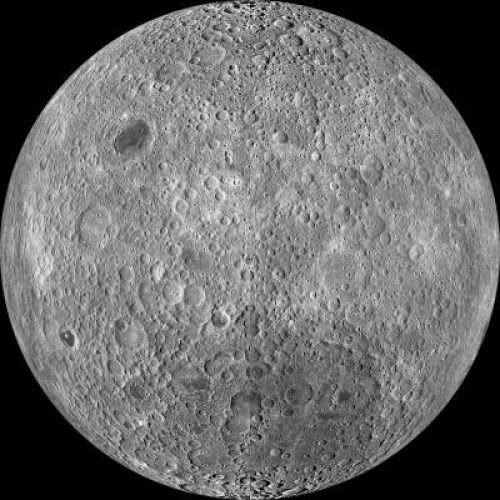
Far side of the moon: this is a composite image of the lunar farside taken by the Lunar Reconnaissance Orbiter in June 2009, note the absence of dark areas. Credit: NASA
The Man in the Moon appeared when meteoroids struck Earth-facing side of the moon creating large flat seas of basalt that we see as dark areas called maria. But no “face” exists on farside of the moon and now, Penn State astrophysicists think they know why.
“I remember the first time I saw a globe of the moon as a boy, being struck by how different the farside looks,” said Jason Wright, assistant professor of astrophysics. “It was all mountains and craters. Where were the maria? It turns out it’s been a mystery since the fifties.”
This mystery is called the Lunar Farside Highlands Problem and dates back to 1959, when the Soviet spacecraft Luna 3 transmitted the first images of the “dark” side of the moon back to Earth. It was called the dark side because it was unknown, not because sunlight does not reach it. Researchers immediately noticed that fewer “seas” or maria existed on this portion of the moon that always faces away from Earth.
Wright, Steinn Sigurdsson, professor of astrophysics and Arpita Roy, graduate student in astronomy and astrophysics, and lead author of the study, realized that the absence of maria, which is due to a difference in crustal thickness between the side of the moon we see and the hidden side, is a consequence of how the moon originally formed. The researchers report their results in today’s (June 9) Astrophysical Journal Letters.
The general consensus on the moon’s origin is that it probably formed shortly after Earth and was the result of a Mars-sized object hitting Earth with a glancing, but devastating impact. This Giant Impact Hypothesis suggests that the outer layers of Earth and the object were flung into space and eventually formed the moon.
“Shortly after the giant impact, Earth and the moon were very hot,” said Sigurdsson.
Earth and the impact object did not just melt; parts of them vaporized, creating a disk of rock, magma and vapor around Earth.
“The moon and Earth loomed large in each others skies when they formed, ” said Roy.
The geometry was similar to the rocky exoplanets recently discovered very close to their stars, said Wright. The moon was 10 to 20 times closer to Earth than it is now, and the researchers found that it quickly assumed a tidally locked position with the rotation time of the moon equal to the orbital period of the moon around Earth. The same real estate on the moon has probably always faced Earth ever since. Tidal locking is a product of the gravity of both objects.
The moon, being much smaller than Earth cooled more quickly. Because Earth and the moon were tidally locked from the beginning, the still hot Earth — more than 2500 degrees Celsius — radiated towards the near side of the moon. The far side, away from the boiling Earth, slowly cooled, while Earth-facing side was kept molten creating a temperature gradient between the two halves.
This gradient was important for crustal formation on the moon. The moon’s crust has high concentrations of aluminum and calcium, elements that are very hard to vaporize.
“When rock vapor starts to cool, the very first elements that snow out are aluminum and calcium,” said Sigurdsson.
Aluminum and calcium would have preferentially condensed in the atmosphere of the cold side of the moon because the nearside was still too hot. Thousands to millions of years later, these elements combined with silicates in the moon’s mantle to form plagioclase feldspars, which eventually moved to the surface and formed the moon’s crust, said Roy. The farside crust had more of these minerals and is thicker.
The moon has now completely cooled and is not molten below the surface. Earlier in its history, large meteoroids struck the nearside of the moon and punched through the crust, releasing the vast lakes of basaltic lava that formed the nearside maria that make up the man in the moon. When meteoroids struck the farside of the moon, in most cases the crust was too thick and no magmatic basalt welled up, creating the dark side of the moon with valleys, craters and highlands, but almost no maria.
Journal Reference:
Arpita Roy et al. Earthshine on a Young Moon: Explaining the Lunar Farside Highlands. Astrophysical Journal Letters., June 2014 DOI: 10.1088/2041-8205/788/2/L42
Note : The above story is based on materials provided by Penn State.
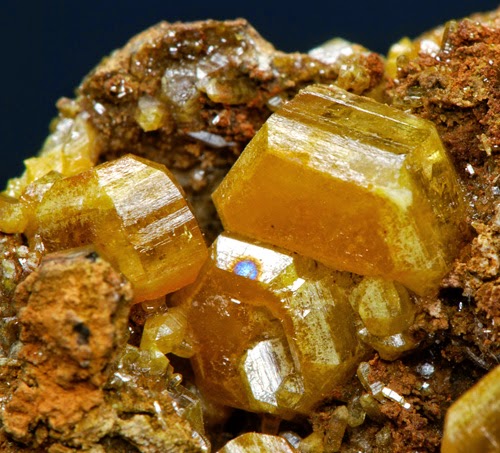
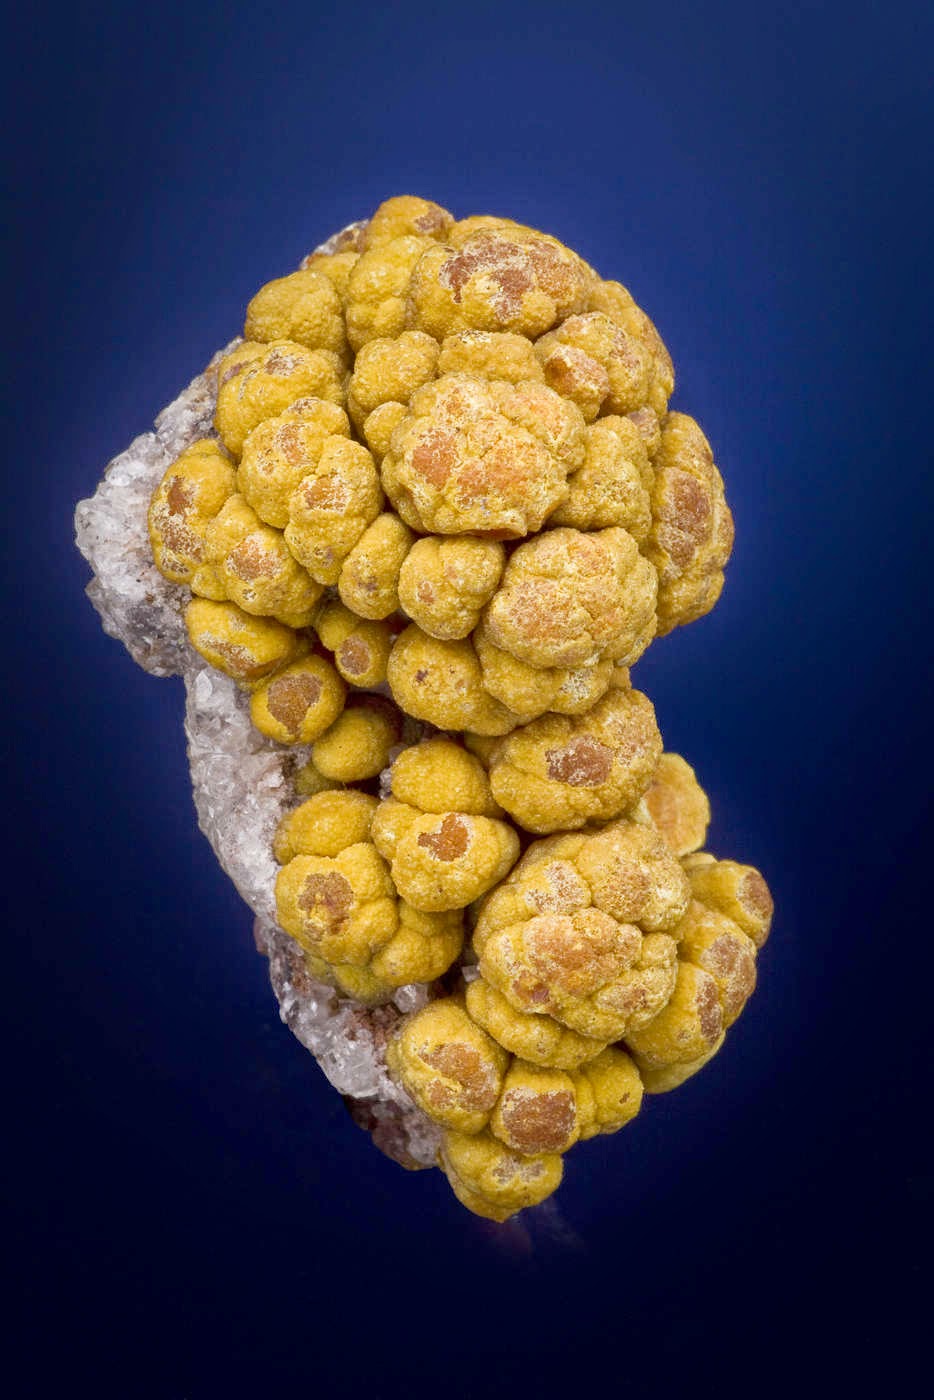
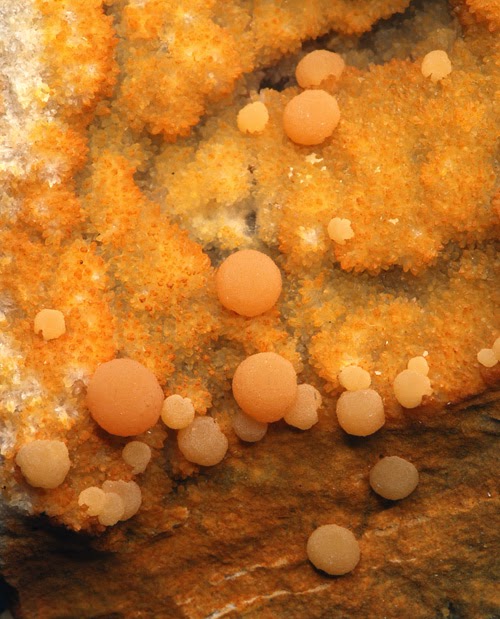
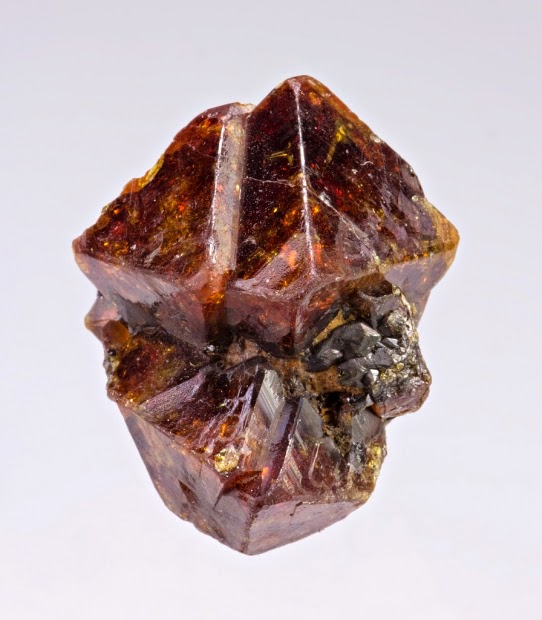
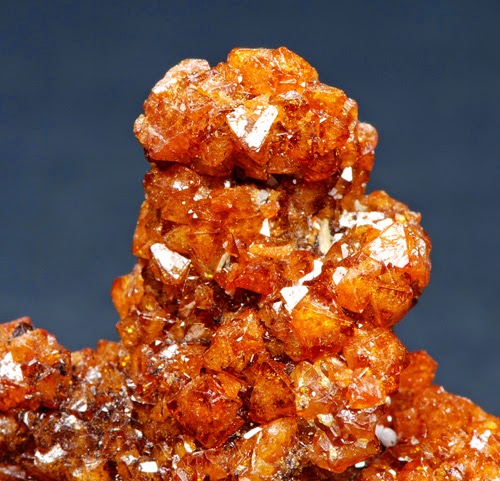
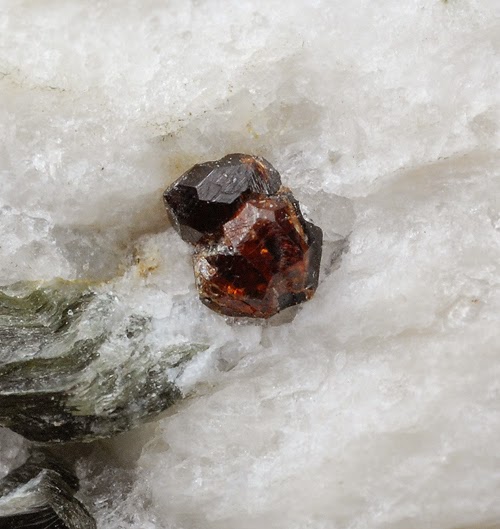
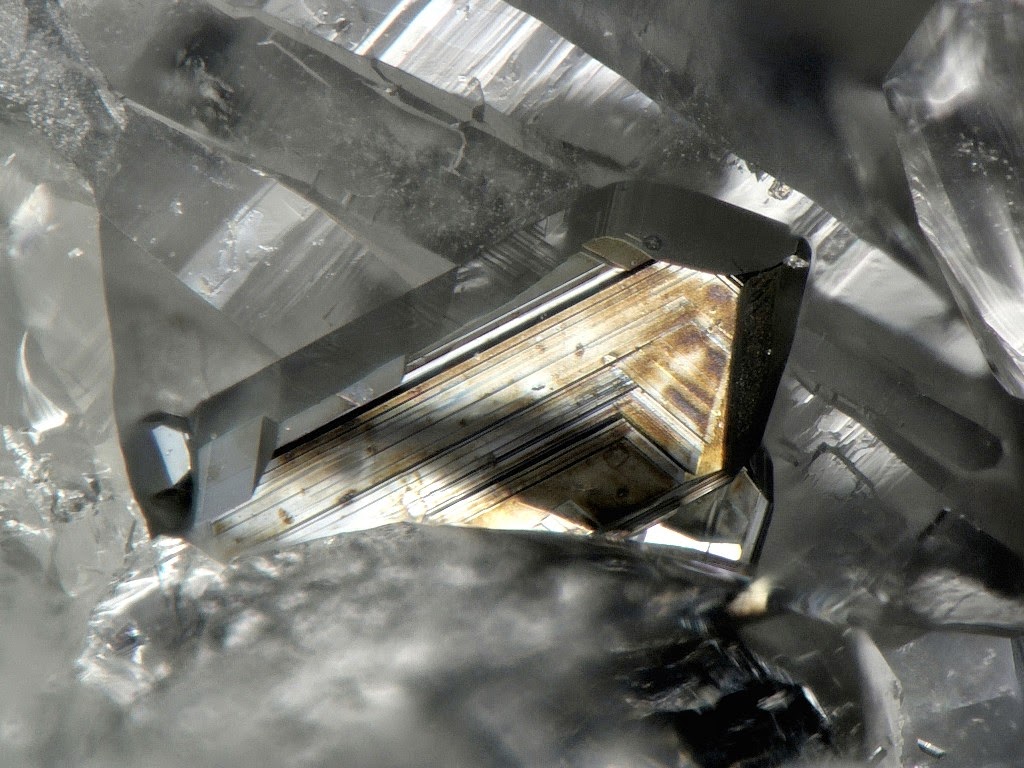
Chemical Formula: Pb5(AsO4)3Cl Locality: Treue Freundschaft Mine, Johanngeorgenstadt, Erzgebirge, Saxony, Germany. Name Origin: From the Greek mimethes – “imitator” , because of its resemblance to pyromorphite.
Mimetite, whose name derives from the Greek Μιμητής mimetes, meaning “imitator”, is a lead arsenate chloride mineral (Pb5(AsO4)3Cl) which forms as a secondary mineral in lead deposits, usually by the oxidation of galena and arsenopyrite. The name is a reference to mimetite’s resemblance to the mineral pyromorphite. This resemblance is not coincidental, as mimetite forms a mineral series with pyromorphite (Pb5(PO4)3Cl) and with vanadinite (Pb5(VO4)3Cl). Notable occurrences are Mapimi, Durango, Mexico and Tsumeb, Namibia.
History
Discovery date : 1832
Optical properties
Optical and misc. Properties : Subtransparent to translucent
Physical Properties
Cleavage: {1011} Imperfect Color: White, Yellow, Orange, Brown, Red. Density: 7.1 – 7.24, Average = 7.17 Diaphaneity: Subtransparent to translucent Fracture: Brittle – Conchoidal – Very brittle fracture producing small, conchoidal fragments. Hardness: 3.5-4 – Copper Penny-Fluorite Luminescence: Fluorescent, Short UV=orange, Long UV=orange. Luster: Adamantine – Resinous Streak: white
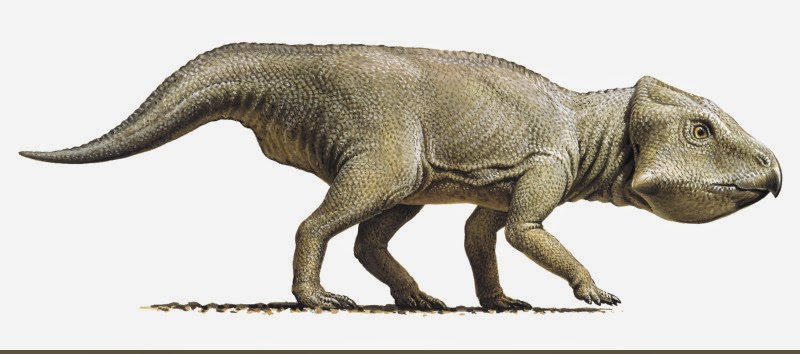
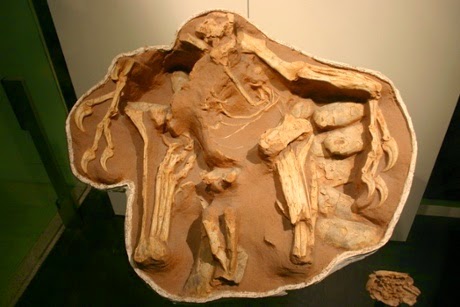
Artistic rendering of Leptoceratops, a likely relative of Serendipaceratops arthurcclarkei by Peter Trusler. Credit: OIST
Dinosaurs and mathematics do not seem like an obvious pair, but for Professor Robert Sinclair and his Mathematical Biology Unit, they are a logical match. Sinclair was part of a team that recently published a paper in Alcheringa: An Australasian Journal of Palaeontology that reexamined the classification of a dinosaur bone found in Australia. Using his expertise in mathematics, Sinclair was able to help the paleontologists reclassify a single arm bone as belonging to a dinosaur family previously believed not to have existed in the Southern Hemisphere. This research may lead to revisions in the current thinking about how continents were connected in the ancient world.
The bone in question, an ulna, or arm bone, was found in southern Australia. The researchers named this new species of dinosaur Serendipaceratops arthurcclarkei, and classified it as belonging to the Neoceratopsia family, which includes the famous dinosaur Triceratops. Not long after that paper was published, another research group published a paper saying that the bone could not be ceratopsian, partly because that family of dinosaurs existed only in the Northern Hemisphere and the land masses had already split, therefore there was no way that a bone from that family could be found in Australia. One caveat to this logic is that the data used to determine when the continents split is based on fossil data. “It becomes a chicken and egg scenario,” says Sinclair. If the data used to establish a theory is then refuted by finding something unexpected, that theory should be challenged, which is not an easy thing to do.
This is where Sinclair can use mathematics to provide solid evidence for one theory or another. He is interested in using mathematics to solve difficult problems in fields of research where current methodologies are not sufficient. He was attracted to paleontology for this reason, particularly in his native Australia. After an invitation to speak at OIST, Dr. Thomas Rich, one of the Australian paleontologists on the paper, asked Sinclair for help in showing that the bone he had analyzed belonged to Ceratopsia.
Sinclair went about investigating whether the dimensions and characteristics of the bone matched other members of the Ceratopsia family, or whether they matched a different family. Sinclair said the challenge was to “use mathematics in a field where it is not commonly used or well understood and utilize it in a way that is understandable to those in the field.” First he had to find a characteristic that could be measured on the bone in question and the same type of bone in other species and families of dinosaurs, in this case, the flatness of the bone. He had to mathematically account for variability in the bones since fossils tend to become broken or deformed over time. Some paleontologists were still skeptical of what the mathematics really meant. This is where the hard work began, and Sinclair had to find other measurements to make and used several different mathematical techniques to show that they all reached the same conclusion.
In the end, he showed mathematical data of three different types in order to convince certain paleontologists that the bone in question belonged to the Ceratopsia family. The driving point for Sinclair is using mathematics to tackle difficult questions when conventional methods in the field are not sufficient. His statistical analysis, combined with other analyses provided by the co-authors, was convincing enough to put the bone back into the Ceratopsia family.
Sinclair says he is excited about people finding more dinosaur bones in Australia to see how it challenges the current thinking about what did and did not exist on the continent. As for his other endeavors, he looks forward to working in new fields and figuring out the “dance of what you would do as a mathematician and what is accepted in that community.” With that goal in mind, it is easy to see how dinosaurs and mathematics formed a logical pair for Sinclair.
Note : The above story is based on materials provided by Okinawa Institute of Science and Technology – OIST.
A group of scientists believe that a previously unexplained isotopic ratio from deep within Earth may be a signal from material from the time before Earth collided with another planet-sized body, leading to the creation of the Moon. This may represent the echoes of the ancient Earth, which existed prior to the proposed collision 4.5 billion years ago. This work is being presented at the Goldschmidt conference in Sacramento, California.
The currently favored theory says that the Moon was formed 4.5 billion years ago, when Earth collided with a Mars-sized mass, which has been given the name “Theia.” According to this theory, the heat generated by the collision would have caused the whole planet to melt, before some of the debris cooled and spun off to create the Moon.
Now however, a group of scientists from Harvard University believe that they have identified a sign that only part of Earth melted, and that an ancient part still exists within Earth’s mantle.
According to lead researcher Associate Professor Sujoy Mukhopadhyay (Harvard):
“The energy released by the impact between Earth and Theia would have been huge, certainly enough to melt the whole planet. But we believe that the impact energy was not evenly distributed throughout the ancient Earth. This means that a major part of the impacted hemisphere would probably have been completely vaporized, but the opposite hemisphere would have been partly shielded, and would not have undergone complete melting.”
The team has analyzed the ratios of noble gas isotopes from deep within Earth’s mantle, and has compared these results to isotope ratios closer to the surface. The found that 3He to 22Ne ratio from the shallow mantle is significantly higher than the equivalent ratio in the deep mantle.
Professor Mukhopadhyay commented, “This implies that the last giant impact did not completely mix the mantle and there was not a whole mantle magma ocean.”
Additional evidence comes from analysis of the 129-Xenon to 130-Xenon ratio. It is known that material brought to the surface from the deep mantle (via mantle plumes) has a lower ratio than that normally found nearer the surface, for example in the basalts from mid-ocean ridges. Since 129-Xenon is produced by radioactive decay of 129-Iodine, these xenon isotopes put a time stamp on the formation age of the ancient parcel of mantle to within the first 100 million years of Earth’s history.
Professor Mukhopadhyay continued “The geochemistry indicates that there are differences between the noble gas isotope ratios in different parts of Earth, and these need to be explained. The idea that a very disruptive collision of Earth with another planet-sized body, the biggest event in Earth’s geological history, did not completely melt and homogenize Earth challenges some of our notions on planet formation and the energetics of giant impacts. If the theory is proven correct, then we may be seeing echoes of the ancient Earth, from a time before the collision.”
Commenting, Professor Richard Carlson (Carnegie Institute of Washington), Past President of the Geochemical Society said:
“This exciting result is adding to the observational evidence that important aspects of Earth’s composition were established during the violent birth of the planet and is providing a new look at the physical processes by which this can occur.”
Note : The above story is based on materials provided by European Association of Geochemistry.
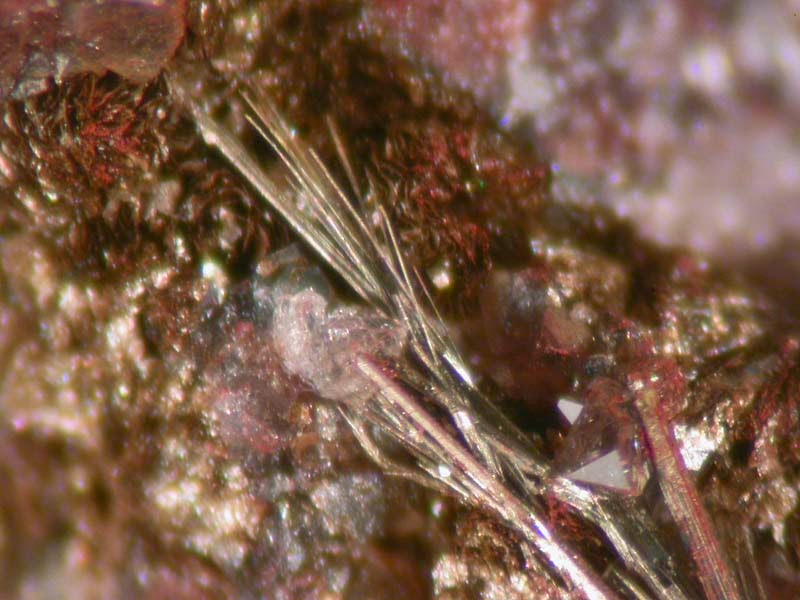
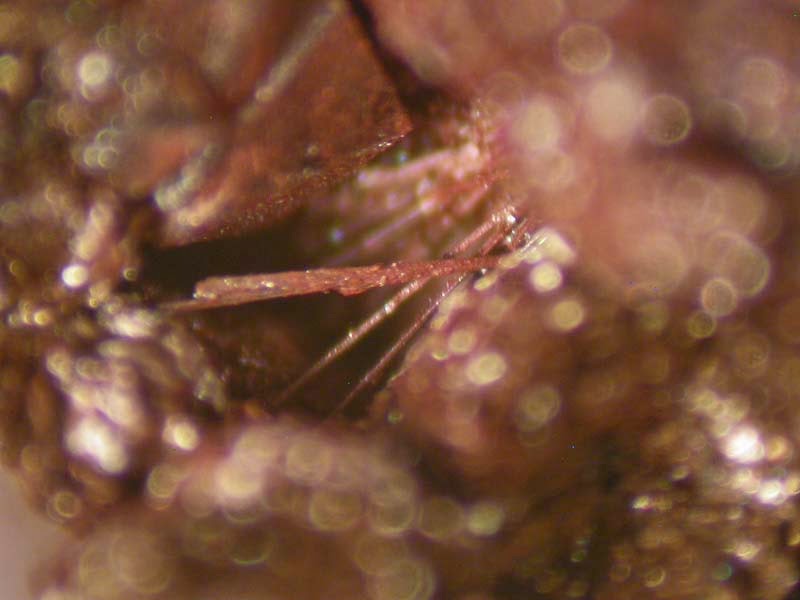
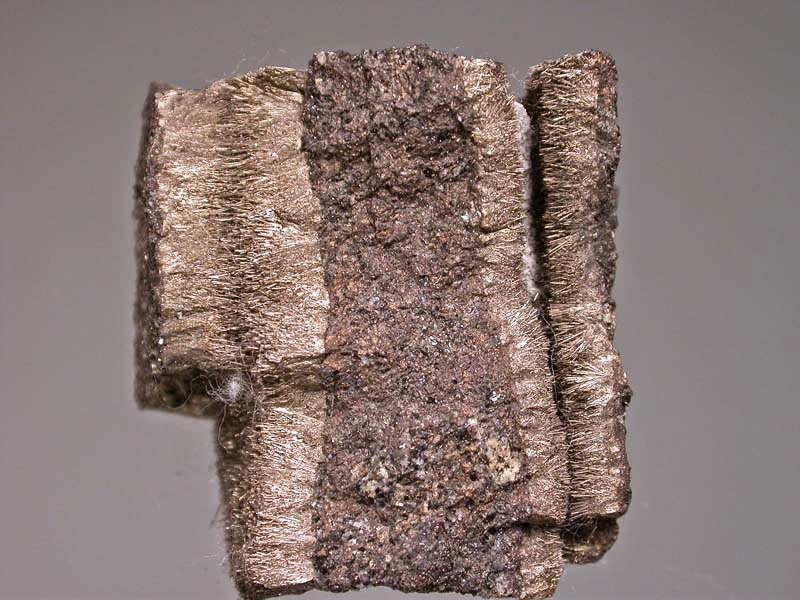
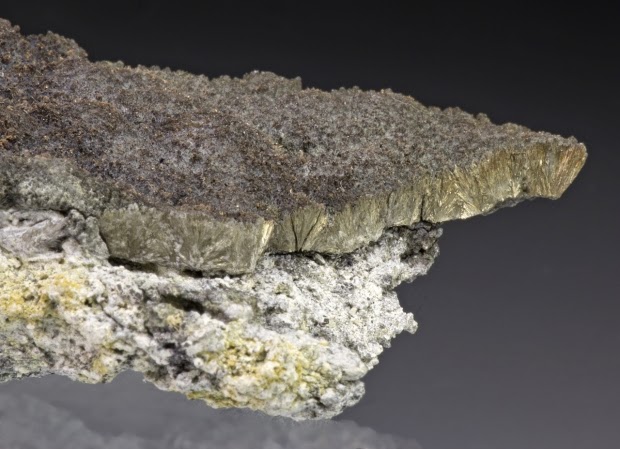
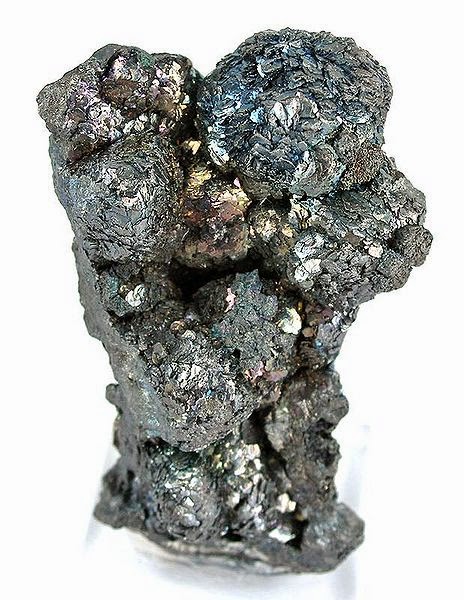
Chemical Formula: NiS Locality: St. Louis, Missouri and Keokuk, Kansas. Name Origin: Named after the English mineralogist, William Hallowes Miller (1801-1880)
Millerite is a nickel sulfide mineral, NiS. It is brassy in colour and has an acicular habit, often forming radiating masses and furry aggregates. It can be distinguished from pentlandite by crystal habit, its duller colour, and general lack of association with pyrite or pyrrhotite.
Occurrence
Millerite is found as a metamorphic replacement of pentlandite within the Silver Swan nickel deposit, Western Australia, and throughout the many ultramafic serpentinite bodies of the Yilgarn Craton, Western Australia, generally as a replacement of metamorphosed pentlandite.
It is commonly found as radiating clusters of acicular needle-like crystals in cavities in sulfide rich limestone and dolomite or in geodes. It is also found in nickel-iron meteorites, such as CK carbonaceous chondrites.
Millerite was discovered by Wilhelm Haidinger in 1845 in the coal mines of Wales. It was named for British mineralogist William Hallowes Miller. The mineral is quite rare in specimen form, and the most common source of the mineral is the in Halls Gap area of Lincoln County, Kentucky in the United States.
History
Discovery date : 1845 Town of Origin: JOACHIMSTHAL, BOHEME Country of Origin : TCHEQUIE
Optical properties
Optical and misc. Properties : Opaque Reflective Power : 54,8-57,2% (580)
Physical Properties
Cleavage: {1011} Perfect, {0112} Perfect Color: Bronze, Greenish gray, Gray, Brass yellow. Density: 5.5 Diaphaneity: Opaque Fracture: Uneven – Flat surfaces (not cleavage) fractured in an uneven pattern. Hardness: 3-3.5 – Calcite-Copper Penny Luminescence: Non-fluorescent. Luster: Metallic Magnetism: Magnetic after heating Streak: greenish black
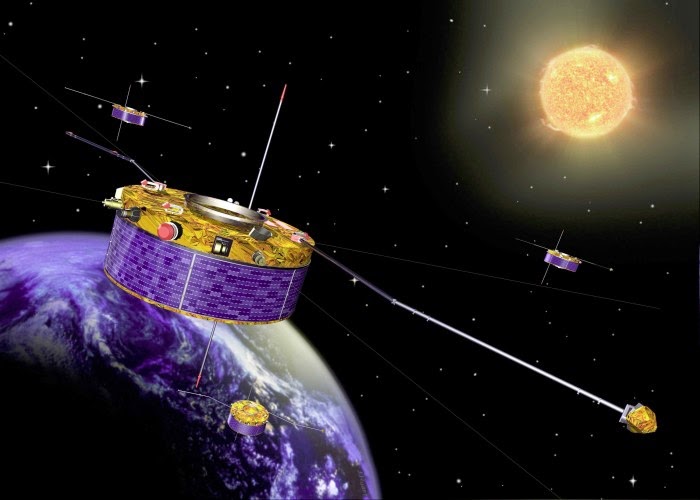
The study has been carried out with data from the four Cluster satellites (Image: ESA)
Space is not empty. A wind of charged particles blows outwards from the Sun, carrying a magnetic field with it. Sometimes this solar wind can break through the Earth’s magnetic field. Researchers at the Swedish Institute of Space Physics (IRF) in Uppsala now have an answer to one of the questions about how this actually occurs.
When two areas with plasma (electrically charged gas) and magnetic fields with different orientations collide, the magnetic fields can be “clipped off” and “reconnected” so that the topology of the magnetic field is changed. This magnetic reconnection can give energy to eruptions on the solar surface, it can change the energy from the solar wind so that it then creates aurora, and it is one of the obstacles to storing energy through processes in fusion reactors.
If two colliding regions of plasma have the same density, temperature and strength (but different orientation) of their magnetic fields, symmetrical reconnection begins. Scientists understand much about this process. But more usual in reality is that two regions of plasma have different characteristics, for example when the solar wind meets the environment round the Earth. Daniel Graham at IRF has recently published a detailed study of this asymmetrical magnetic reconnection in Physical review Review Letters 112, 215004 (2014). The study uses data from the four European Space Agency satellites in the Cluster mission, satellites which fly in formation in the Earth’s magnetic field.
“Especially important were measurements with two satellites only a few tens of kilometres from each other, in the region where the solar wind meets the Earth’s magnetic field,” says Daniel Graham. “We can thus do detailed measurements to understand plasma physics at a height of 60,000 km.”
Heating of electrons parallel to the magnetic field in conjunction with magnetic reconnection is of especial interest.
“We believe that this is an important piece of the puzzle for understanding how magnetic reconnection works, how charged particles are accelerated, and how particles from different regions can be mixed with each other,” says Daniel Graham. “Our detailed measurements in the Earth’s magnetic field can be used to understand the physics even in fusion reactors on Earth, and in far distant regions in space that we can’t reach with satellites.”
Note : The above story is based on materials provided by Institutet för rymdfysik – Swedish Institute of Space Physics (IRF).
How did oxygen levels in the atmosphere expand enough to allow life to evolve? Researchers may have solved one of the biggest puzzles in geochemistry. Credit: Copyright Michele Hogan
Scientists investigating one of the greatest riddles of Earth’s past may have discovered a mechanism to help determine how oxygen levels in the atmosphere expanded to allow life to evolve.
High concentrations of atmospheric oxygen have been essential for the evolution of complex life on Earth. Over the 4.5 billion years of Earth history, oxygen concentration has risen from trace amounts to 21% of the atmosphere today. However, the mechanisms behind this rise are uncertain, and it remains one of the biggest puzzles in geochemistry.
A research group from the University of Exeter has discovered one possible mechanism, relating to the way in which carbon dioxide is removed from the atmosphere over long timescales.
Dr Benjamin Mills, of Geography, said: “On the early Earth, CO2 levels were controlled by hydrothermal processes on the seafloor. As Earth cooled, and the continents grew, chemical processes on the continents took over.”
Using computer models, the group has shown that this switch may explain increasing oxygen concentration over Earth’s middle age (the Proterozoic era), which ultimately led to conditions suitable for complex life. According to the authors, the oxygen rise is caused by a gradual increase in marine limiting nutrients, which are a product of chemical weathering of the continents.
Dr Mills added: “The more CO2 that is sequestered by continental weathering, the larger the phosphate source to the oceans. Phosphate availability controls the long term photosynthetic productivity, which leads to oxygen production.”
“This is not the only reason oxygen rose to high levels, but it seems to be an important piece of the puzzle. Whilst the carbon cycle can function without large continents, it seems that their emergence was critical to our own evolution.”
Note : The above story is based on materials provided by University of Exeter.
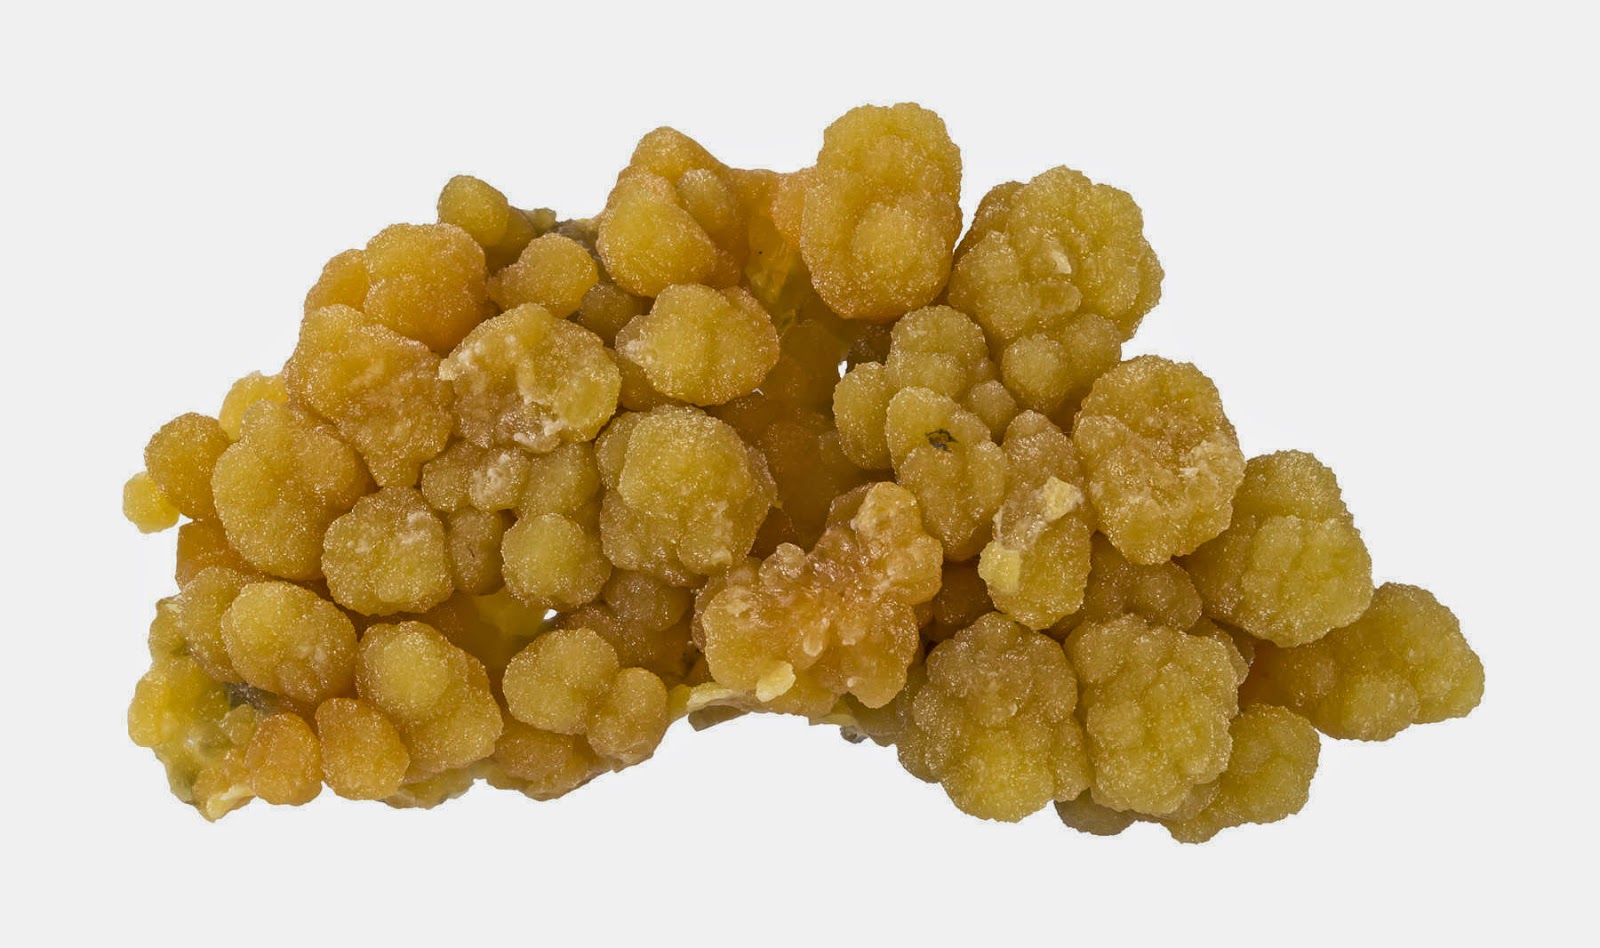
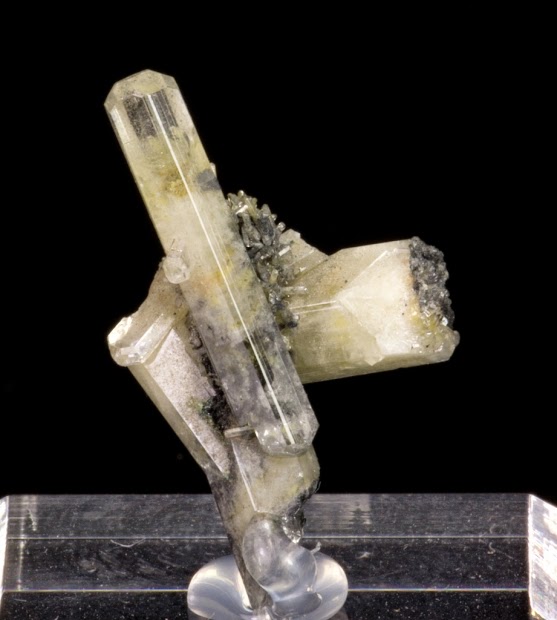
Chemical Formula: K2Ca4Al2Be4Si24O60·H2O Locality: Val Milar, Switzerland. Name Origin: Named after its locality.
Milarite is a fairly rare mineral and yet it is one of the two minerals that gives its name to a somewhat large group of silicates, namely the Milarite – Osumilite Group. The group is composed of similar cyclosilicate minerals that are all very rare and very obscure with the exception of milarite, osumilite and sugilite. The primary structural unit of the minerals in the Milarite – Osumilite Group is a most unusual double ring, Si12O30. Normal rings of cyclosilicates are composed of six silicate tetrahedrons; Si6O18. The double rings of the Milarite – Osumilite Group minerals are made of two normal rings linked together by sharing one oxygen in each of the tetrahedrons. The structure is analogous to the dual wheels of a tractor trailer.
Milarite crystals are generally small, but can make excellent micromounted specimens. They are often colored a muted green or yellow and form good prismatic hexagonal crystals. Milarite forms as a primary mineral in granitic pegmatites and syenites, hydrothermal veins and alpine clefts. It has been cut as a gem, but is too rare, small and its general translucency that makes it only suitable to be cut for collectors of rare gemstones. Milarite is named for its locality of first discovery; Val Giuf (Val Milar), Tavetsch, Grischum, Switzerland. Milarite has been known as giufite and giuffite, but milarite is the only accepted name now. Good mineral specimens are available and can be quite attractive, but mostly under magnification.
History
Discovery date : 1870 Town of Origin : VAL GIUV, TAVETSCH, GRISONS Country of Origin : SUISSE
Optical properties
Optical and misc. Properties : Transparent to translucent Refractive Index: from 1,52 to 1,55
Physical Properties
Cleavage: {0001} Imperfect, {1120} Imperfect Color: Colorless, White, Greenish white, Yellowish white. Density: 2.52 Diaphaneity: Transparent to translucent Fracture: Brittle – Generally displayed by glasses and most non-metallic minerals. Hardness: 6 – Orthoclase Luminescence: Fluorescent, Short UV=bluish white. Luster: Vitreous (Glassy) Streak: white
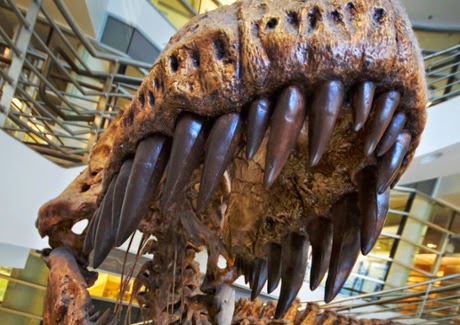
The robust teeth of Tyrannosaurus are near circular in cross-section and better adapted to heavy bites than those of almost all other carnivorous dinosaurs. Photograph: Daniel Parks/Flickr
Much of my research looks at reconstructing the behaviour of non-avian dinosaurs: animals that have been extinct for some 66 million years and are represented only by fossils. This statement alone is often enough for people to either ask how on Earth this is possible, or to state quite baldly that it must all be made up. As with many branches of science, certainly there have been (and occasionally still are) some pretty terrible ideas and hypotheses that have been advocated at various times for dinosaur behaviour, but there is a myriad of sources of information and techniques that can be brought to bear on the problem.
The majority of dinosaur remains are of course bones and teeth, but these have a lot to say. Aside from very obvious things like the teeth of carnivores tending towards being sharp, some major anatomical adaptations are strongly linked with certain behaviours. For example, animals that can run quickly and especially those that are efficient over long distances have a short thigh, but long foot, so we can make some reasonable deductions about how they moved from this. Others are still more extreme and clear cut – those animals that dig show a whole suite of adaptations to the claws, fingers, wrist, elbow, shoulder and pelvis and often too the ribs, and joints in the backbone. So when we see all of these features in the tiny alvarezsaurid dinosaurs, we can be very confident that they could dig.
We can even test these kinds of mechanical ideas with computer simulations. The skull of Tyrannosaurus for example has been shown to be exceptionally good at resisting the forces delivered in biting (more so than other carnivores) and this matches the extra-strong teeth they have, the increased areas for muscle attachment to deliver that bite, and even punctures made in the bones of other dinosaurs when tyrannosaurs bit them. Bringing together multiple lines of evidence like this can therefore build an exceptionally strong and coherent picture of certain behaviours.
Bite marks on bones can provide more detail than just how hard animals were biting, but also whole patterns of feeding. Are the teeth driven into the bone, or do they slide across the surface? Actually tyrannosaurs seem to have done both, biting hard on joints, but scraping teeth across the surface to rip meat off a relatively fresh carcass. Often it is hard to match marks from teeth to individual species, but it is possible in some cases.
Better still are stomach contents. Sometimes dinosaur specimens do preserve with the remains of their meals inside (and the reverse is true, dinosaurs were eaten by other animals too). This is more common for carnivores where bones can survive well and from this we know that many carnivorous dinosaurs seem to have preferentially fed on small or juvenile dinosaurs. Others ate a wide variety of other animals, and the tiny gliding Microraptor seems to have been a generalist with various specimens having consumed a fish, a bird, and the foot of an early mammal. Herbivorous dinosaurs are known to have consumed various leaves, ferns and even pine cones. Continuing down the gut, we also occasionally get coprolites – fossil feces – and naturally this can give a pretty clear idea of what the animals were eating.
On oviraptorosaur dinosaur brooding a nest of eggs. Photograph: Ryan Somma/Flickr
Moving on from feeding, we can also reasonably infer that dinosaurs were reproducing, after all, they were around for quite a while and birds (and bees, and even educated fleas) are still doing it. More than that though, we see eggs laid in patterns in nests, as do some modern birds. We also see dinosaurs preserved brooding on those nests, protecting the eggs and perhaps sheltering and insulating them with feathers too. The dinosaur Oviraptor (the “egg thief”) was so named because it was found in association with eggs thought to belong to another dinosaur, but later discoveries of embryos within these eggs, showed in fact that the parents were protecting their unborn offspring. In other dinosaur nests we see babies considerably older than newly hatched individuals and even traces of food. This implies that the adults were looking after these babies long after they hatched, and that some extended parental care may have been involved.
This is something we would predict from their living relatives. Modern birds are literally living dinosaurs, and the crocodilians are their next nearest evolutionary relatives that are still alive today. Both exhibit parental care in nearly all species, looking after both the eggs and the hatchlings, in some cases for a number of years. That this is near universal behaviour for both, and when there is at least some evidence for this in dinosaurs, does imply that it was an ancestral trait for the collective group and thus most dinosaurs likely gave some care to their offspring pre- and post-hatching.
Other patterns of behaviour can also be detected from where fossils are found. For example, specimens of ankylosaurs (those wonderfully squat and armoured dinosaurs) are regularly found in marine deposits, even well out to sea. They were terrestrial animals, but perhaps spent a lot of their time close to the coast or around estuaries and rivers, meaning that they are washed into the sea more often than many others. On the flip side, the pachycephalosaurs and their giant bony heads seem to have favoured upland environments. Fossils of these animals are very rare and most of their remains are only the “skullcaps” of solid bone, but these are rather beaten up. This is exactly the pattern we see when bodies have been transported a long way by rivers with skeletons being broken up, small bones destroyed and only the most robust parts (here, the top of the skull) surviving and the clear conclusion therefore is that they lived in upland areas.
Put all of these lines of evidence together – eggs, nests, anatomical specialisations, coprolites, mechanical tests, bite marks, stomach contents, preservation types – and we can really start to get to grips with these issues. Add into this other studies – such as from footprints and trackways, reconstructing muscle groups, analysis of seasonal temperatures and climatic changes, scans of brains and bones around the ear to give ideas on senses, stress fractures in bones showing where peak forces were delivered, systematic injuries suggesting combat between horned dinosaurs – and you can see how a clear picture can be put together of the otherwise intangible behaviour of long extinct animals.
There are of course limitations here, and plenty is uncertain or unknown, but this is neither impossible to work out nor a work of fiction, but solid researched based on a wealth of data and careful analysis.
Note : The above story is based on materials provided by Dr Dave Hone for theguardian
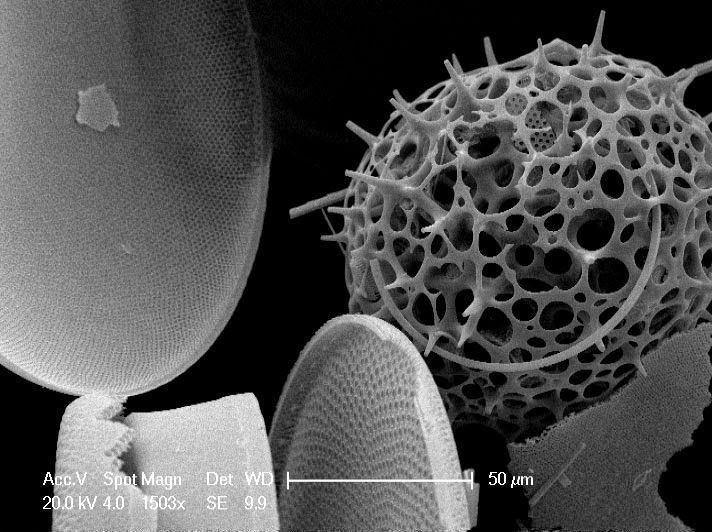
This is a scanning electron microscope image of ocean plankton. Credit: University of Edinburgh
Rising global temperatures could increase the amount of carbon dioxide naturally released by the world’s oceans, fuelling further climate change, a study suggests.
Fresh insight into how the oceans can affect CO2 levels in the atmosphere shows that rising temperatures can indirectly increase the amount of the greenhouse gas emitted by the oceans.
Scientists studied a 26,000-year-old sediment core taken from the Gulf of California to find out how the ocean’s ability to take up atmospheric CO2 has changed over time.
They tracked the abundance of the key elements silicon and iron in the fossils of tiny marine organisms, known as plankton, in the sediment core. Plankton absorb CO2 from the atmosphere at the ocean surface, and can lock away vast quantities of carbon.
Researchers found that those periods when silicon was least abundant in ocean waters corresponded with relatively warm climates, low levels of atmospheric iron, and reduced CO2 uptake by the oceans’ plankton. Scientists had suspected that iron might have a role in enabling plankton to absorb CO2. However, this latest study shows that a lack of iron at the ocean surface can limit the effect of other key elements in helping plankton take up carbon.
This effect is magnified in the southern ocean and equatorial Pacific and coastal areas, which are known to play a crucial role in influencing levels of CO2 in the global atmosphere.
Researchers from the University of Edinburgh say their findings are the first to pinpoint the complex link between iron and other key marine elements involved in regulating atmospheric CO2 by the oceans. Their findings were verified with a global calculation for all oceans. The study, published in Nature Geoscience, was supported by Scottish Alliance for Geoscience Environment Society and the Natural Environment Research Council.
Dr Laetitia Pichevin, of the University of Edinburgh’s School of GeoSciences, who led the study, said: “Iron is known to be a key nutrient for plankton, but we were surprised by the many ways in which iron affects the CO2 given off by the oceans. If warming climates lower iron levels at the sea surface, as occurred in the past, this is bad news for the environment.”
More information:
Silica burial enhanced by iron limitation in oceanic upwelling margins, Nature Geoscience, DOI: 10.1038/ngeo2181
Note : The above story is based on materials provided by University of Edinburgh
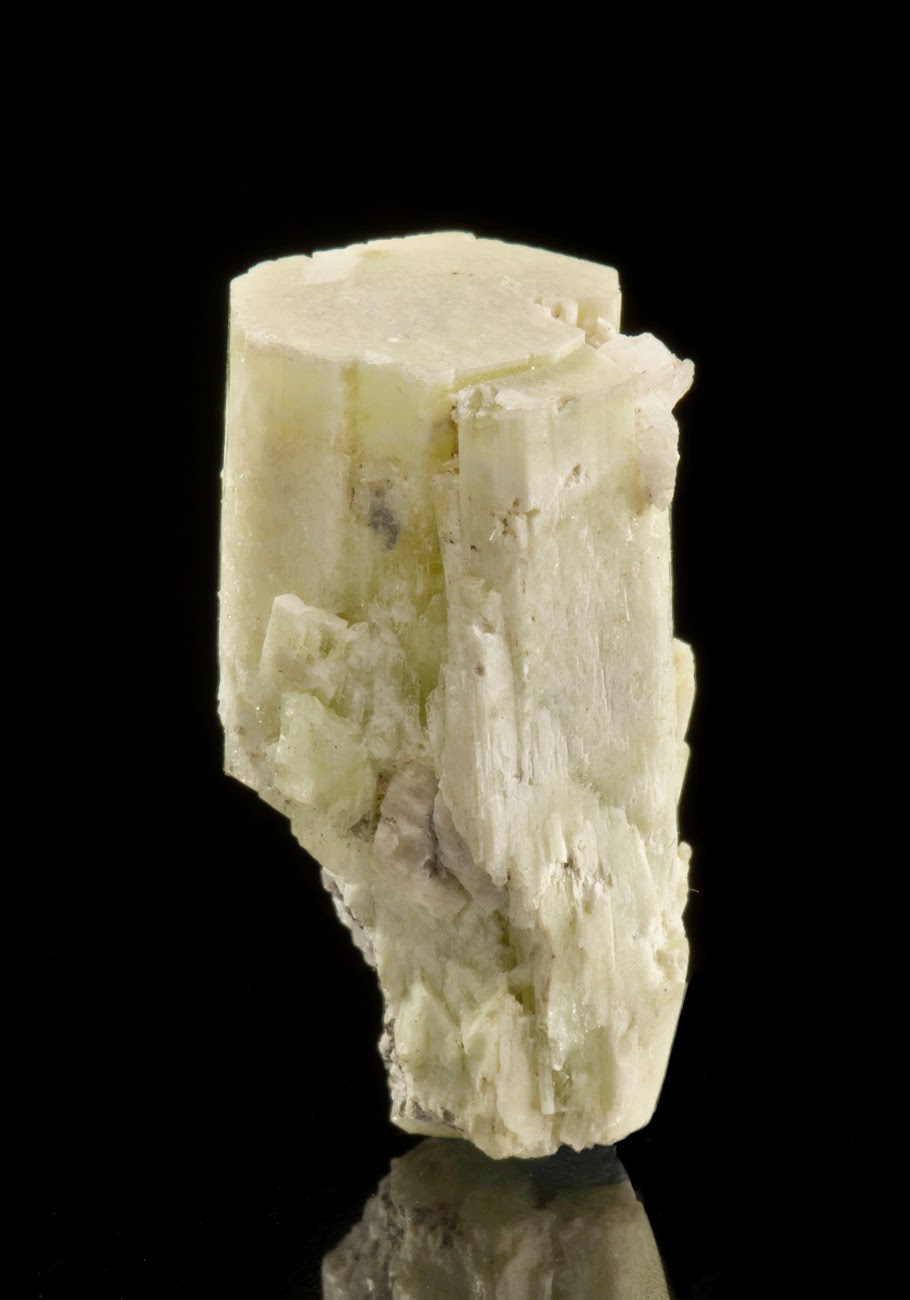
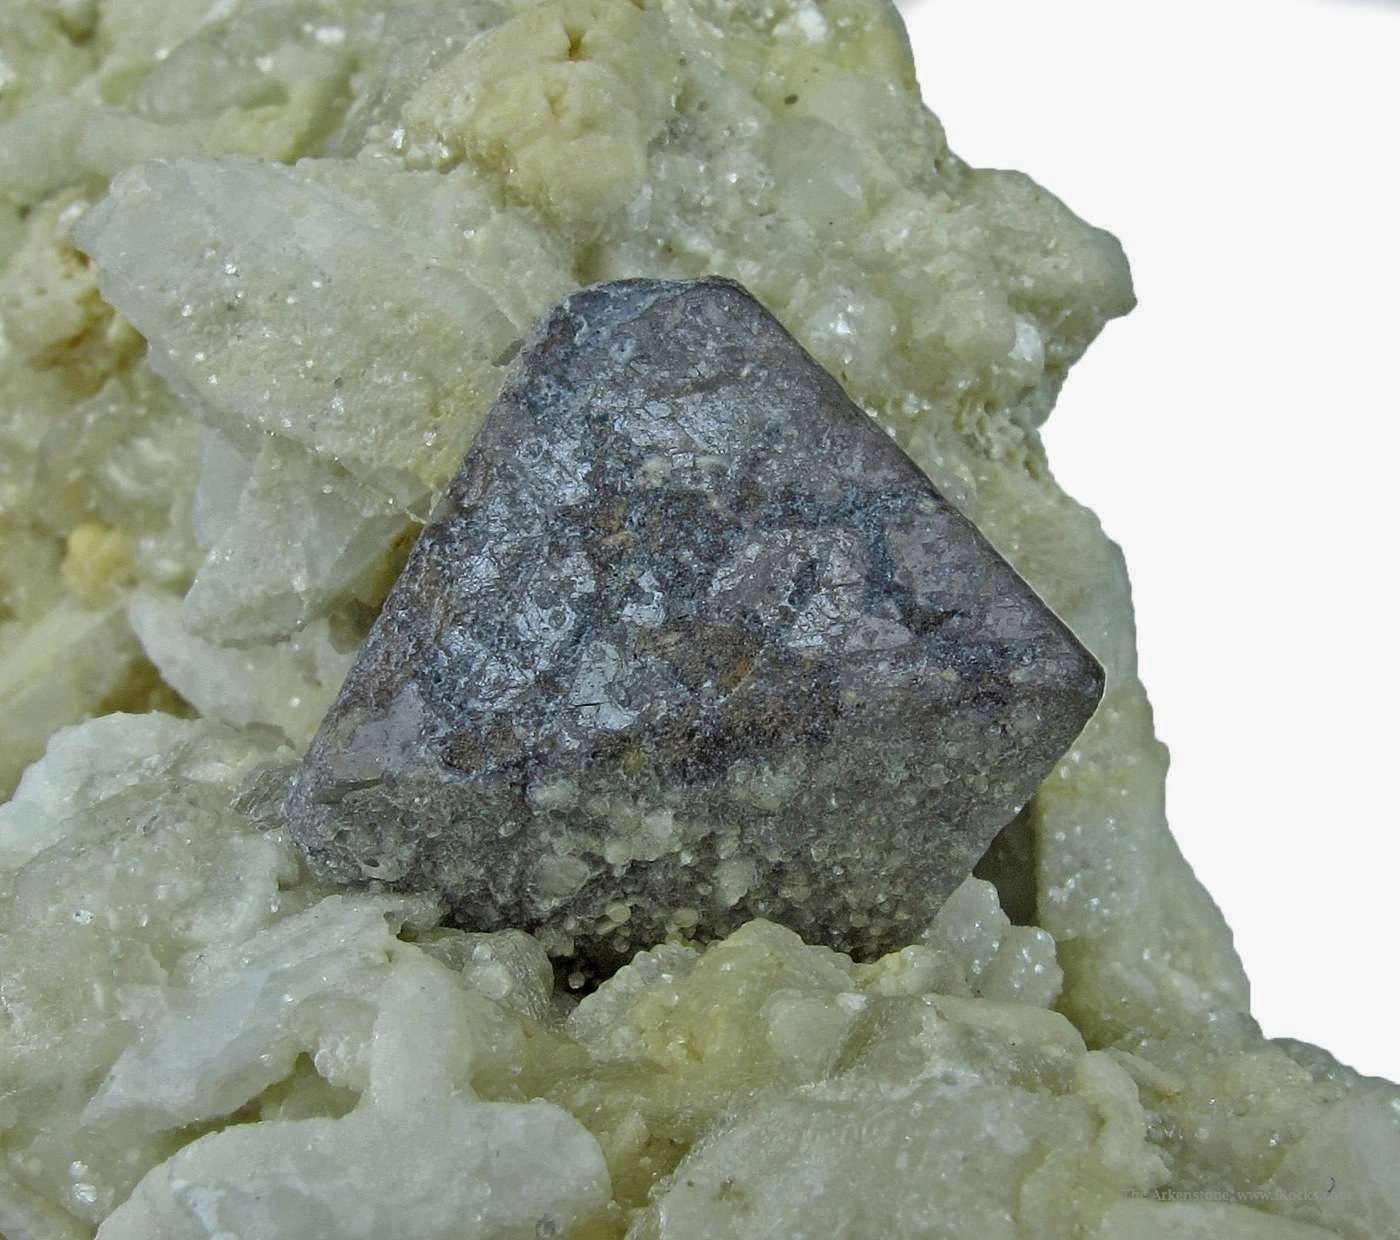
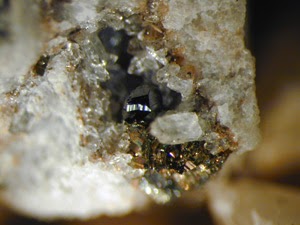
Chemical Formula: (Na,Ca)2Ta2O6(O,OH,F) Locality: Isalnd of Uto, State of Stockholm, Sweden. Name Origin: From the Greek mikros – “small” and lithos – “stone.”
Microlite is a pale-yellow, reddish-brown, or black isometric mineral composed of sodium calcium tantalum oxide with a small amount of fluorine (Na,Ca)2Ta2O6(O,OH,F) . Microlite is a mineral in the pyrochlore group that occurs in pegmatites and constitutes an ore of tantalum. It has a Mohs hardness of 5.5 and a variable specific gravity of 4.2 to 6.4. It occurs as disseminated microscopic subtranslucent to opaque octahedral crystals with a refractive index of 2.0 to 2.2. Microlite is also called djalmaite.
Microlite occurs as a primary mineral in lithium-bearing granite pegmatites, and in miarolitic cavities in granites. Association minerals include: albite, lepidolite, topaz, beryl, tourmaline, spessartine, tantalite and fluorite.
Microlite was first described in 1835 for an occurrence on the Island of Uto, State of Stockholm, Sweden. A type locality is the Clark Ledges pegmatite, Chesterfield, Hampshire County, Massachusetts. The name is from Greek mikros for “small” and lithos for “stone.”
History
Discovery date : 1835 Town of Origin: CHESTERFIELD, HAMPSHIRE CO., MASSACHUSETTS Country of Origin : USA
Optical properties
Optical and misc. Properties: Subtranslucent to opaque Refractive Index: from 1,93 to 2,02
Physical Properties
Cleavage: {111} Indistinct, {111} Indistinct, {111} Indistinct Color: Yellowish brown, Reddish brown, Greenish brown, Green, Gray. Density: 4.2 – 6.4, Average = 5.3 Diaphaneity: Subtranslucent to opaque Fracture: Sub Conchoidal – Fractures developed in brittle materials characterized by semi-curving surfaces. Hardness: 5-5.5 – Apatite-Knife Blade Luminescence: Non-fluorescent. Luster: Vitreous – Resinous Magnetism: Nonmagnetic Streak: light yellow
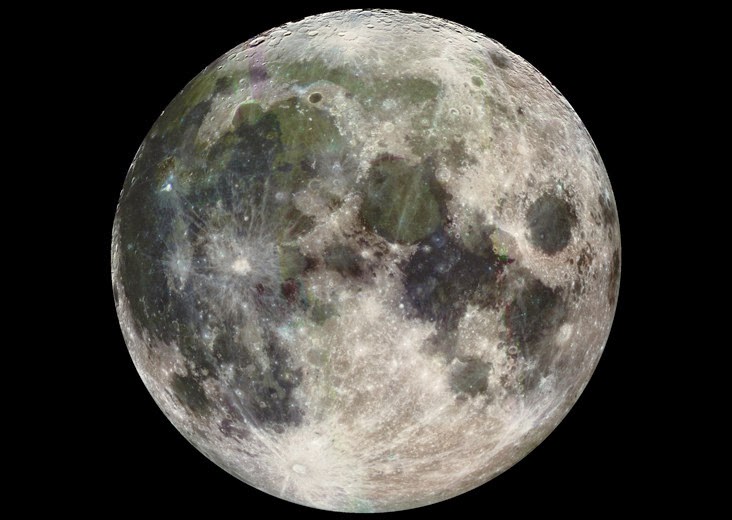
The moon. A new series of measurements of oxygen isotopes provides increasing evidence that the moon formed from the collision of the Earth with another large, planet-sized astronomical body, around 4.5 billion years ago. Credit: NASA/JPL
A new series of measurements of oxygen isotopes provides increasing evidence that the Moon formed from the collision of Earth with another large, planet-sized astronomical body, around 4.5 billion years ago.
This work will be published in Science on 6th June, and will be presented to the Goldschmidt geochemistry conference in California on 11th June.
Most planetary scientists believe that the Moon formed from an impact between Earth and a planet-sized body, which has been given the name Theia. Efforts to confirm that the impact had taken place had centred on measuring the ratios between the isotopes of oxygen, titanium, silicon and others. These ratios are known to vary throughout the solar system, but their close similarity between Earth and Moon conflicted with theoretical models of the collision that indicated that the Moon would form mostly from Theia, and thus would be expected to be compositionally different from Earth.
Now a group of German researchers, led by Dr. Daniel Herwartz, have used more refined techniques to compare the ratios of 17O/16O in lunar samples, with those from Earth. The team initially used lunar samples which had arrived on Earth via meteorites, but as these samples had exchanged their isotopes with water from Earth, fresher samples were sought. These were provided by NASA from the Apollo 11, 12 and 16 missions; they were found to contain significantly higher levels of 17O/16O than their Earthly counterparts.
Dr Herwartz said “The differences are small and difficult to detect, but they are there. This means two things; firstly we can now be reasonably sure that the Giant collision took place. Secondly, it gives us an idea of the geochemistry of Theia. Theia seems to have been similar to what we call E-type chondrites.If this is true, we can now predict the geochemical and isotopic composition of the Moon, because the present Moon is a mixture of Theia and the early Earth. The next goal is to find out how much material of Theia is in the Moon.”
Most models estimate that the Moon it is composed of around 70% to 90% material from Theia, with the remaining 10% to 30% coming from the early Earth. However, some models argue for as little as 8% Theia in the Moon. Dr Herwartz said that the new data indicate that a 50:50 mixture seems possible, but this needs to be confirmed.
The team used an advanced sample preparation technique before measuring the samples via stable isotope ratio mass spectrometry, which showed a 12 parts per million (± 3 ppm) difference in 17O/16O ratio between Earth and Moon.
Note : The above story is based on materials provided by European Association of Geochemistry.
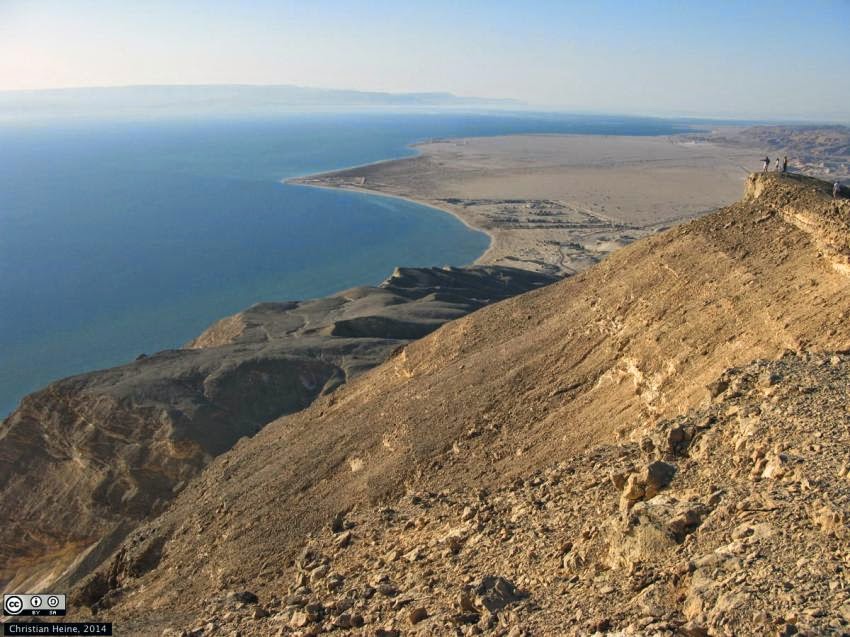
A newborn ocean. Only few tenths of kilometres separate the massive rift shoulders of the Sinai-Peninsula from the African continent on the far side of the Gulf of Suez. 130 Million years ago, the young South Atlantic ocean has likely looked similar. Credit: Christian Heine, University of Sydney, under Creative Commons
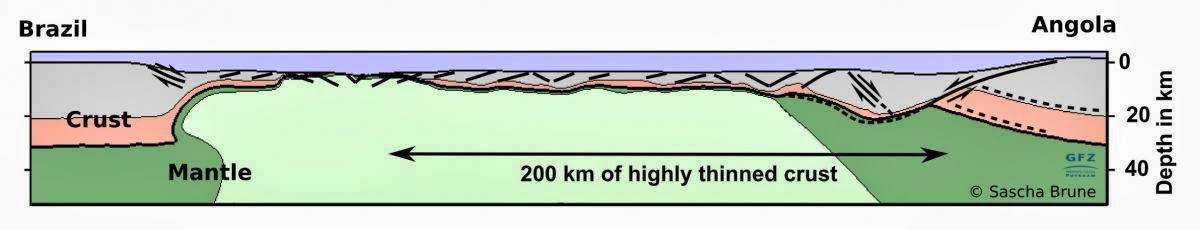
When South America split from Africa 150 to 120 million years ago, the South Atlantic formed and separated Brazil from Angola. The continental margins formed through this separation are surprisingly different. Along offshore Angola 200 km wide, very thin slivers of continental crust have been detected, whereas the Brazilian counterpart margin features an abrupt transition between continental and oceanic crust.
For decades, geoscientists have struggled to explain not only why the amount of thinning and the geometries of opposite rifted continental margin are not symmetric, but also why wide margins are often underlain by highly thinned continental crust. Now geoscientists from the German Research Centre for Geosciences (GFZ), the University of Sydney and the University of London have found an explanation, published in the current issue of Nature Communications. Using high-resolution computer models and geological data from the South Atlantic margins, they discovered that the centre of the rift, where the continental crust gets actively thinned through faulting, does not stay fixed during continental break-up, but migrates laterally.
“We could show that rifts are capable of moving sideways over hundreds of kilometres”, says Dr Sascha Brune of the GFZ. “During rift migration, the crust on one side of the rift is weakened by hot upwelling material in Earth’s mantle, whereas the other side is slightly stronger as the crust there is colder. New faults form only on the warm, weak rift side, while those of the strong side become inactive.” This leads to a sideways motion of the rift system, which is equivalent with conveying crustal material from the South American plate to the African plate. These transferred crustal blocks are strongly extended by the rift and finally constitute the enigmatic thin crustal slivers of the African margin.
Asymmetry of the South Atlantic continental margins. Shown is a model cross section for the South Atlantic, shortly after the separation of Africa and South America 120 million years ago. Credit: Sascha Brune, German Research Centre for Geosciences GFZ
Such a relocation of a rift takes its time: during the formation of the present-day Angolan and Brazilian margins, the rift centre migrated more than 200 km westward. This delayed continental break-up and the generation of oceanic crust by up to 20 million years. The new models reveal that extension velocity plays a crucial role in understanding the widths of South Atlantic margins: faster crustal extension leads to longer rift migration and hence to more pronounced asymmetry of the generated continental margins.
Rifts constitute an important tectonic element of our planet. They are responsible for the shape of today’s continents, and their activity still continues at present.
Illustrating a new aspect of plate tectonic theory, this study shows that during continental break-up, large amounts of material can be conveyed from one side of the plate boundary to the other, a process that has not been yet accounted for. The new models and analyses provide an important stepping-stone toward a comprehensive understanding of rift processes and continental margin formation.
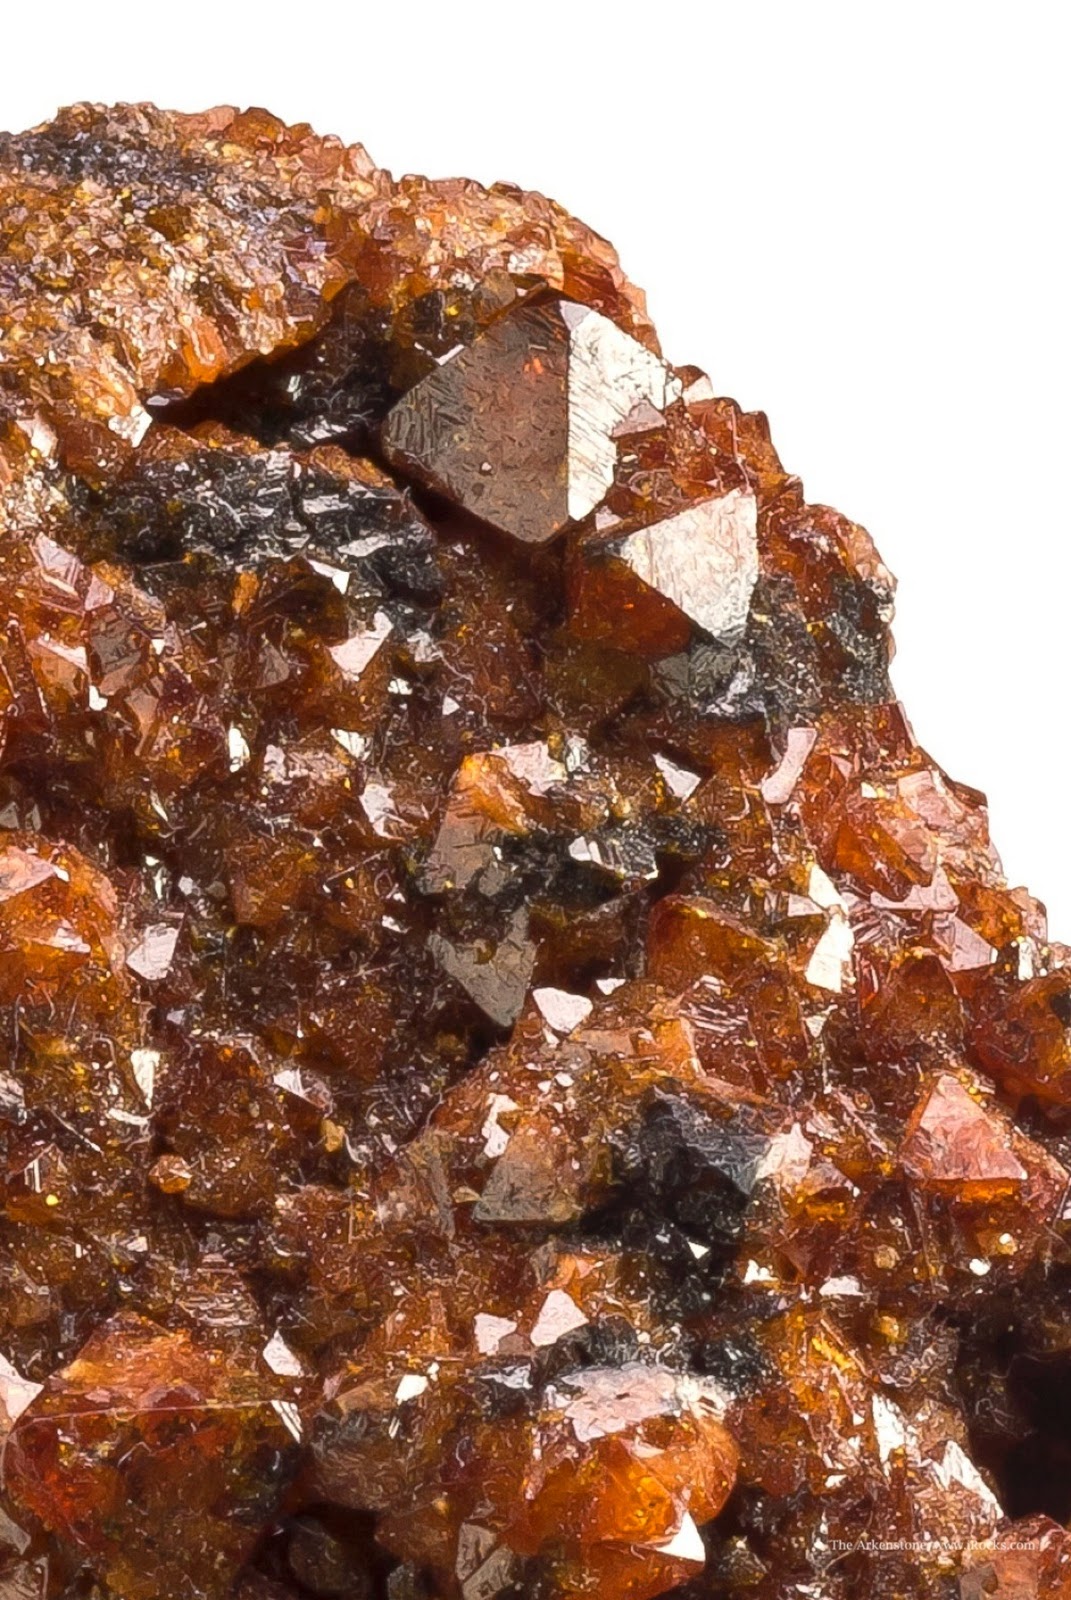
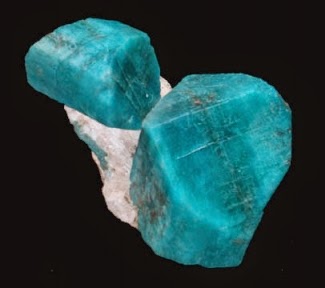
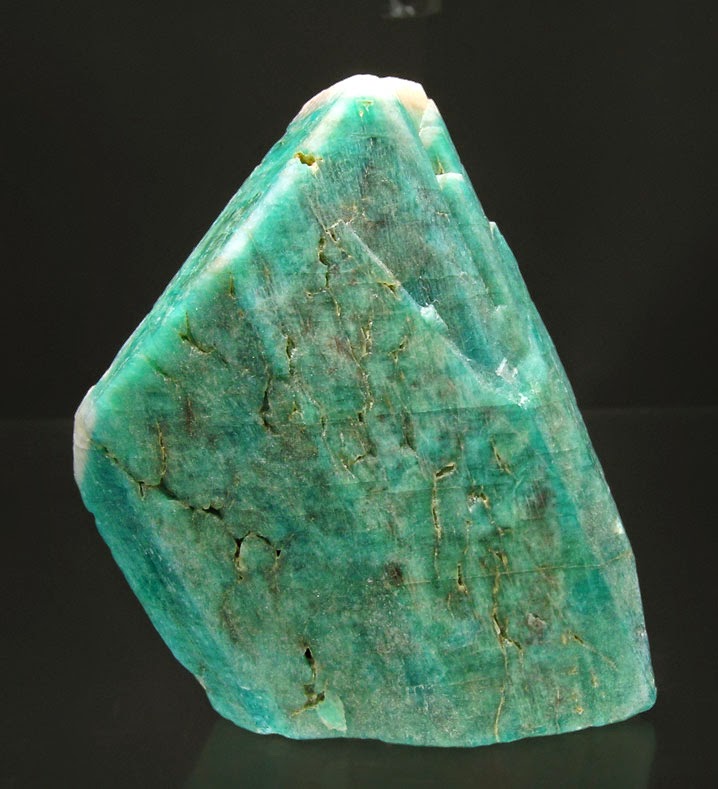
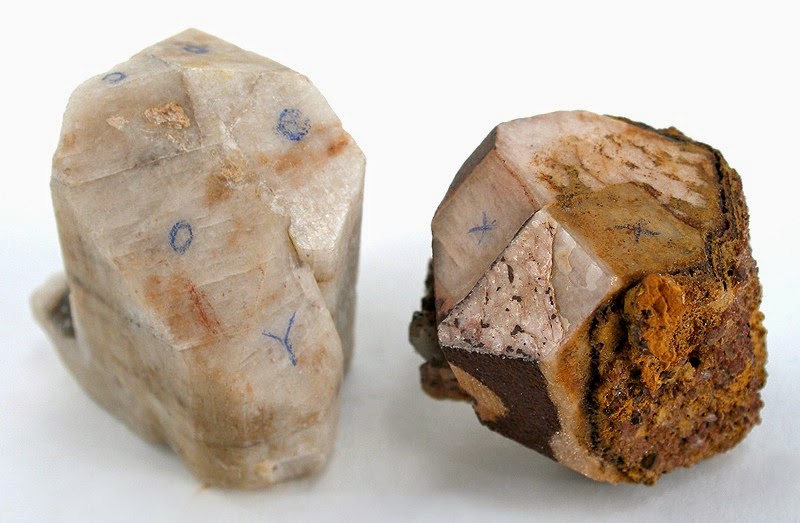
Chemical Formula: KAlSi3O8 Locality: Common world wide occurrences. Name Origin: From the Greek mikron – “little” and klinein – “to stoop.”
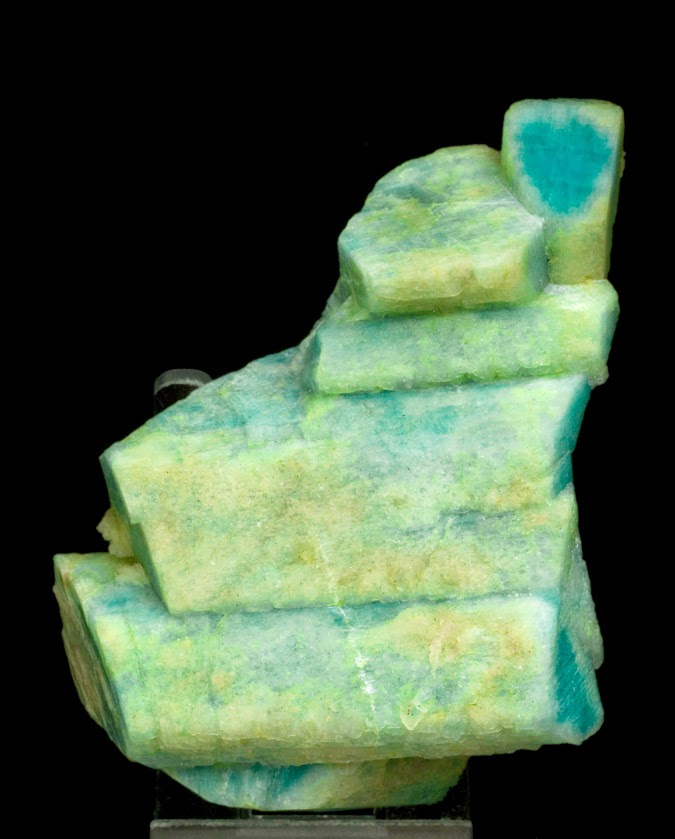
Microcline (KAlSi3O8) is an important igneous rock-forming tectosilicate mineral. It is a potassium-rich alkali feldspar. Microcline typically contains minor amounts of sodium. It is common in granite and pegmatites. Microcline forms during slow cooling of orthoclase; it is more stable at lower temperatures than orthoclase. Sanidine is a polymorph of alkali feldspar stable at yet higher temperature. Microcline may be clear, white, pale-yellow, brick-red, or green; it is generally characterized by cross-hatch twinning that forms as a result of the transformation of monoclinic orthoclase into triclinic microcline.
Microcline may be chemically the same as monoclinic orthoclase, but because it belongs to the triclinic crystal system, the prism angle is slightly less than right angles; hence the name “microcline” from the Greek “small slope.” It is a fully ordered triclinic modification of potassium feldspar and is dimorphous with orthoclase. Microcline is identical to orthoclase in many physical properties; it can be distinguished by x-ray or optical examination; viewed under a polarizing microscope, microcline exhibits a minute multiple twinning which forms a grating-like structure that is unmistakable.
History
Discovery date : 1830 Town of Origin : FREDRIKSVARN Country of Origin : NORVEGE
Optical properties
Optical and misc. Properties : Translucent to transparent Refractive Index : from 1,51 to 1,53 Axial angle 2V : 66-103°
Physical Properties
Cleavage: {001} Perfect, {010} Good Color: Bluish green, Green, Gray, Grayish yellow, Yellowish. Density: 2.56 Diaphaneity: Translucent to transparent Fracture: Uneven – Flat surfaces (not cleavage) fractured in an uneven pattern. Hardness: 6 – Orthoclase Luminescence: Fluorescent, Short UV=cherry red. Luster: Vitreous (Glassy) Streak: white
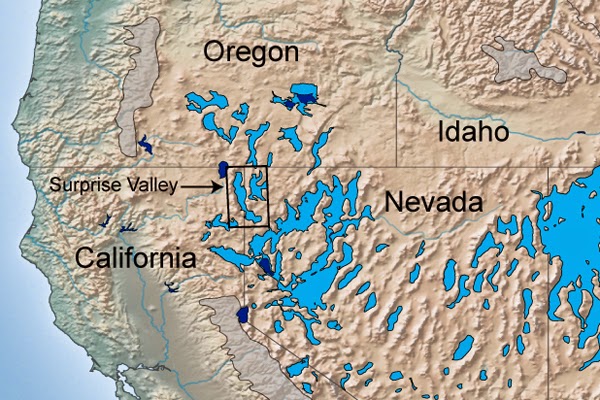
During the Last Glacial Maximum, large lakes (light blue) covered many of the now dry desert basins of Nevada, Oregon and California. Credit: Daniel Ibarra
A new study by Stanford scientists solves a longstanding mystery of how ancient lakes in the western United States grew to such colossal sizes.
The research, published in the journal Geological Society of America Bulletin, found that the lakes were able to grow large – rivaling the Great Lakes – during the peak of the last Ice Age 21,000 years ago, a period known as the “Last Glacial Maximum,” because evaporation rates were significantly lower than today.
“It was previously thought that the lakes grew because there was more rain and snowfall during this period of the Earth’s history,” said Daniel Ibarra, a graduate student in Stanford’s Department of Environmental Earth System Science and the first author of the study.
More quantitative studies of past climate could help refine the computer models used by the Intergovernmental Panel on Climate Change (IPCC) to simulate Earth’s atmospheric conditions under changing atmospheric conditions, said Kate Maher, assistant professor of geological and environmental sciences, who headed the project.
“The IPCC uses climate models to simulate past and future climate, so knowing that some of the models do a better job of simulating past changes gives us more confidence that we understand the physics involved,” Maher said. “That can give us more confidence in the models we use to simulate future climate change.”
During the Last Glacial Maximum (LGM), giant lakes covered large sections of California, Nevada, Oregon and Utah, including where Salt Lake City is today. Earth scientists have long been puzzled by how these ancient lakes, now completely dry, grew so large. The prevailing theory was there was more rain and snowfall during this time period. But recent evidence from paleoecology and climate model simulations indicates that precipitation rates were actually relatively low compared to later periods.
To resolve the discrepancy between computer models and the interpretation of geologic evidence, Ibarra collected more than 80 samples of tufa – a limestone created by the evaporation of mineralized water – from different locations around the edges of Lake Surprise, a moderate-sized fossil lake in Surprise Valley, California.
“The smaller lakes can tell you about the regional climate and can serve as a water gauge for the bigger lakes,” Maher said.
By measuring the decay of radioactive carbon-14 and uranium in tufa samples, the team reconstructed the ancient shorelines of Lake Surprise at different times in the past. Their findings showed that at the height of the LGM, Lake Surprise had a surface area of about 390 square miles, roughly the size of San Francisco Bay.
With support from other laboratories at Stanford, Ibarra also used a mass spectrometer to precisely measure the amounts of two slightly different forms of oxygen in the tufa samples: oxygen-16 and the slightly heavier oxygen-18. Both isotopes of oxygen are present in water, but oxygen-18 water evaporates at a slower rate than oxygen-16 water. By knowing the ratio of oxygen-16 to oxygen-18 in the tufa samples, the scientists were able to calculate Lake Surprise’s water balance through time.
Cooler temperatures
Their analyses revealed that 21,000 years ago, the evaporation rate at Lake Surprise was nearly 40 percent lower than today, with precipitation rates similar to the modern era. These results are consistent with previously run climate simulations that show Earth’s climate was cooler during the LGM.
The cooler global temperatures would have reduced evaporation rates, allowing the lakes to gradually grow over time through inflows from streams and rivers.
“Lake Surprise is located in a closed basin. All streams flow into the lake, but there is no outflow. The only way for water to escape is through evaporation,” Ibarra said.
The team’s dating and isotope measurements also show that precipitation rates in the region increased for a brief period after the LGM. The tufa measurements indicated that Lake Surprise reached its largest size – around 530 square miles – 15,000 years ago.
Thus, the enormous lakes that once dotted the western United States initially grew large during the peak of the LGM due to reduced evaporation, but didn’t reach their maximum sizes until several thousand years later, when rain and snowfall increased.
Knowledge about the past precipitation patterns of the region could be used to test the accuracy of the differing climate models scientists currently use to simulate global climate conditions.
“We can actually rank the models now,” Ibarra said. “Our findings have implications for evaluating the models, and deciding which models successfully reproduced the past precipitation patterns we observe.”
More information:
“Rise and fall of late Pleistocene pluvial lakes in response to reduced evaporation and precipitation: Evidence from Lake Surprise, California,” Geological Society of America Bulletin, B31014.1, first published on June 2, 2014, DOI: 10.1130/B31014.1
Note : The above story is based on materials provided by Stanford University
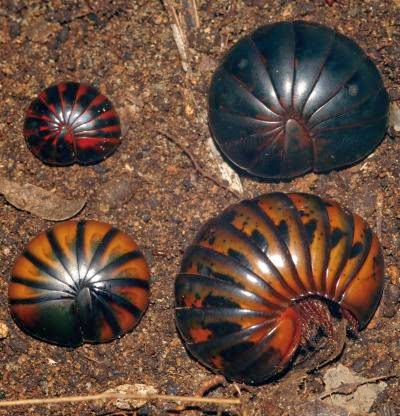
Upper left to Lower right: This image shows different color morphs, genetically found to be identical, of the chirping giant pill-millipede (Sphaeromimus musicus), and a similar-looking species (lower left) of a different genus (Zoosphaerium blandum). Credit: Wesener 2007
An international team of researchers comprised of Thomas Wesener, Museum Koenig, Bonn, Daniel Le, Field Museum, Chicago and Stephanie Loria, American Museum of Natural History, New York, discovered seven new species of chirping giant pill-millipedes on Madagascar. The study was published in the open access journal ZooKeys.
The species discovered all belong to the genus Sphaeromimus, which is Latin for ‘small ball animal’. However, the designation ‘small’ is not always true for the members of the genus as one of the newly discovered species surprises with a size larger than a ping-pong ball. Another special characteristic of the genus is that its species have the largest chirping organs of any millipede, which are most probably used during mating.
Despite sometimes sharing a habitat with Madagascar’s ‘large’ pill-millipedes, which can reach the size of a baseball, the new species are more closely related to millipedes found in India than their Malagasy neighbours. This relationship dates back more than 80 million years to at least as early as the Cretaceous period, when dinosaurs walked the Earth and India and Madagascar were connected.
One of the new species Sphaeromimus andrahomana offers clues to Madagascar’s ecosystems thousands of years ago. Although the species was found in a cave in Madagascar’s southern dry spiny forest region, genetically, it is a rainforest taxon. The lemur skeletons found inside the same cave are also evidence that a rainforest existed in the now desert-like area until 3000-5000 years ago. The species, sheltered by the humid cave, is probably a living witness to this ancient rainforest.
The discovery is particularly exciting as some of species are microendemics, meaning they are only found in one tiny forest fragment, a few hundred meters long and wide.
S. lavasoa, for example, is restricted to the Lavasoa Mountain, which is covered by an isolated, slightly larger than 100 hectare, rainforest remnant, which is famous for the recent discovery of a large scorpion as well as a dwarf lemur species. This discovery further highlights the importance of the area as a Center of Endemism.
Another new species (S. saintelucei) is probably the most endangered millipede on Madagascar. It was found in a fragment of the Sainte Luce littoral rainforest characterized by its laterite soil that is now so small that no lemur or other large vertebrate species can survive in it.
The nearby Sainte Luce forest fragment with sandy ground harbours a different species (S. splendidus) also believed to be a microendemic. “Despite their close proximity, both species are not even closely related. Both the fragments where they were found are currently threatened by a huge, billion-dollar titanium ore strip mining project. Although there are intentions to designate and manage conservation zones, the plan is to protect only one large fragment may result in the extinction of some of the species if additional conservation measures aren’t undertaken.” explains the lead author Dr. Thomas Wesener from the Research Museum Alexander Koenig in Bonn, Germany.
Original source:
Wesener T, Le DM-T, Loria SF (2014) Integrative revision of the giant pill-millipede genus Sphaeromimus from Madagascar, with the description of seven new species (Diplopoda, Sphaerotheriida, Arthrosphaeridae). ZooKeys 414: 67. doi: 10.3897/zookeys.414.7730
Note : The above story is based on materials provided by Pensoft Publishers
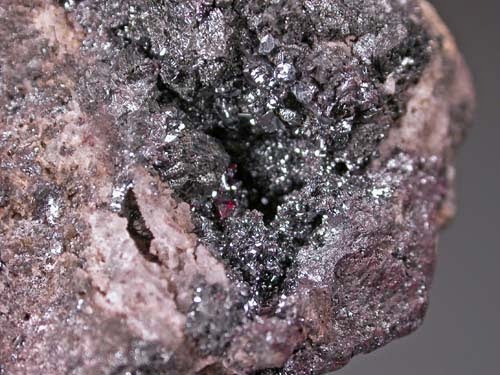
Chemical Formula: AgSbS2 Locality: Braunsdorf, Freiberg, Sachsen (Saxony), Germany. Name Origin: From the Greek, meyon, “smaller” and argyros, “silver.” in allusion to the lessor silver content of the mineral.
Miargyrite is a mineral, a sulfide of silver and antimony with the formula AgSbS2. It is a dimorph of cuboargyrite. Originally discovered in the Freiberg district of Germany in 1824, it has subsequently been found in many places where silver is mined. It usually occurs in low temperature hydrothermal deposits. and forms black metallic crystals which may show a dark red internal reflection. The streak is also red.
Miargyrite is named from the Greek meyon, “smaller” and argyros, “silver,” as its silver content is lower than most silver sulfides.
History
Discovery date : 1829 Town of Origin : BRAUNSDORF, FREIBERG, SAXE Country of Origin : ALLEMAGNE
Optical properties
Optical and misc. Properties : Translucent to Subopaque Reflective Power: 26,3-38,7% (580) Refractive Index : from 2,72 to 2,73
Physical Properties
Cleavage: {010} Imperfect Color: Steel gray, Lead gray, Blackish red, Reddish gray. Density: 5.1 – 5.3, Average = 5.19 Diaphaneity: Translucent to Subopaque Fracture: Brittle – Generally displayed by glasses and most non-metallic minerals. Hardness: 2-2.5 – Gypsum-Finger Nail Luminescence: Non-fluorescent. Luster: Sub Metallic Streak: cherry red
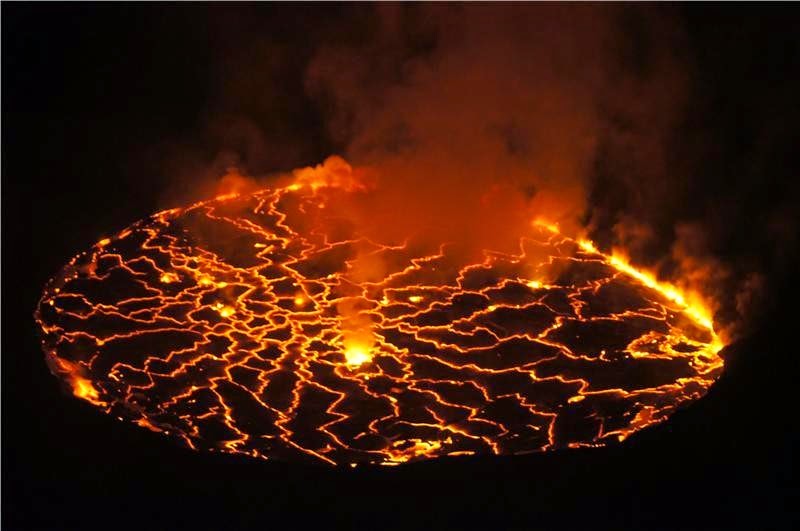
The Nyiragongo lava lake at night. Credit: INVOLCAN
Data from the Meteosat satellite 36,000 km from Earth, has been used to measure the temperature of lava at the Nyiragongo lava lake in the Democratic Republic of Congo. An international team compared data from the Spinning Enhanced Visible and InfraRed Imager (SEVIRI) on board Meteosat with data collected at the lava lake with thermal cameras. Researchers say the technique could be used to help monitor volcanoes in remote places all over the world, and may help with the difficult task of anticipating eruptions.
Data from the Meteosat satellite has been used to measure the temperature of lava at a remote volcano in Africa.
The scientists compared data from the Spinning Enhanced Visible and InfraRed Imager (SEVIRI) on board Meteosat with ground data from a thermal camera, to show the temperature of the lava lake at Nyiragongo, in the Democratic Republic of Congo.
The technique was pioneered in Europe, and the researchers say it could be used to help monitor volcanoes in remote places all over the world.
“I first used the technique during a lava fountain at Mt Etna in August 2011,” says Dr. Gaetana Ganci, who worked on the study with colleagues Letizia Spampinato, Sonia Calvari and Ciro Del Negro from the Istituto Nazionale di Geofisica e Vulcanologia (INGV) in Italy.
“The first time I saw both signals I was really surprised. We found a very similar radiant heat flux curve — that’s the measurement of heat energy being given out — from the ground-based thermal camera placed a few kilometres from Etna and from SEVIRI at 36,000km above the Earth.”
Transferring the technique to Nyiragongo was important — partly because the exposed lava lake can yield data important for modelling shallow volcanic systems in general, but more importantly because advance warning of eruptions is necessary for the rapidly expanding city of Goma nearby.
The research, published in the Journal of Geophysical Research: Solid Earth is the first time in which Nyiragongo’s lake has been studied using ground-based thermal images in addition to satellite data to monitor the volcano’s radiative power record.
Dr. Ganci and her colleagues developed an algorithm they call HOTSAT to detect thermal anomalies in the Earth’s surface temperature linked to volcanoes. They calculate the amount of heat energy being given out in a target area based on analysis of SEVIRI images.
Combining the frequent SEVIRI images with the more detailed but less frequent images from NASA’s Moderate Resolution Imaging Spectroradiometer (MODIS), they showed that temperature anomalies could be observed from space before an eruption is underway. They believe that space-based observations can be a significant help in the difficult task of predicting volcanic eruptions, but that providing advance warning will never be easy.
“Satellite data are a precious means to improve the understanding of volcanic processes. There are cases of thermal anomalies being observed in volcanic areas just before an eruption,” says Ganci. “Combining different kinds of data from the ground and from space would be the optimal condition — including infra-red, radar interferometry, seismic measurements etc. But even in well-monitored volcanoes like Mt. Etna, predicting eruptions is not a trivial thing.”
The team developed HOTSAT with a view to making an automatic system for monitoring volcanic activity. They are now developing a new version of HOTSAT. This should allow the processing of all the volcanic areas that can be monitored by SEVIRI in near-real time.Continuing ground-based observations will be needed for validation.
“For remote volcanoes, such as Nyiragongo, providing reliability to satellite data analysis is even more important than in Europe. Thanks to ground-based measurements made by Pedro Hernández, David Calvo, Nemesio Pérez (ITER, INVOLCAN Spain), Dario Tedesco (University of Naples, Italy) and Mathieu Yalire (Goma Volcanological Observatory), we could make a step in this direction,” says Ganci.
“This study shows the range of science that can be done with Meteosat,” says Dr. Marianne Koenig, EUMETSAT’s atmospheric and imagery applications manager for the Meteosat Second Generation satellites, “And opens up the possibility of monitoring isolated volcanoes.”
Note : The above story is based on materials provided by European Organisation for the Exploitation of Meteorological Satellites (EUMETSAT).
This image depicts ecological reconstructions of Hamipterus. Credit: Chuang Zhao
Researchers have discovered the first three-dimensionally preserved pterosaur eggs in China. The eggs were found among dozens, if not hundreds, of pterosaur fossils, representing a new genus and species (Hamipterus tianshanensis). The discovery, described in the Cell Press journal Current Biology on June 5, reveals that the pterosaurs — flying reptiles with wingspans ranging from 25 cm to 12 m — lived together in gregarious colonies.
Xiaolin Wang of the Chinese Academy of Sciences’ Institute of Vertebrate Paleontology and Paleoanthropology says it was most exciting to find many male and female pterosaurs and their eggs preserved together. “Five eggs are three-dimensionally preserved, and some are really complete,” he says.
The fossil record of the pterosaurs has generally been poor, with little information about their populations, the researchers say. Prior to this latest find, only four isolated and flattened pterosaur eggs were known to science.
The resting place of the pterosaurs now described was first uncovered in 2005 in the Turpan-Hami Basin, south of the Tian Shan Mountains in Xinjiang, northwestern China. The fossil-rich area may harbor thousands of bones, including three-dimensional male and female skulls and the first three-dimensional eggs. Wang says that sediments in the area suggest that the pterosaurs died in a large storm about 120 million years ago in the Early Cretaceous period.
The researchers examined the largely intact pterosaur egg specimens to find that they were pliable, with a thin, calcareous eggshell outside and a soft, thick membrane inside, similar to the eggs of some modern-day snakes. The researchers’ observations of 40 male and female individuals suggest differences between the sexes in the size, shape, and robustness of their head crests.
The combination of many pterosaurs and eggs strongly indicates the presence of a nesting site nearby and indicates that this species developed gregarious behavior, the researchers say. Hamipterus most likely buried their eggs in sand along the shore of an ancient lake to prevent them from drying out. While the new fossils shed light on the reproductive strategy, development, and behavior of pterosaurs, there is still plenty left to learn about them.
“Sites like the one reported here provide further evidence regarding the behavior and biology of this amazing group of flying reptiles that has no parallel in modern time,” the researchers write.
Note : The above story is based on materials provided by Cell Press.