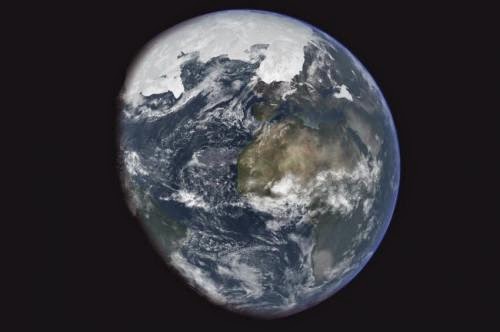
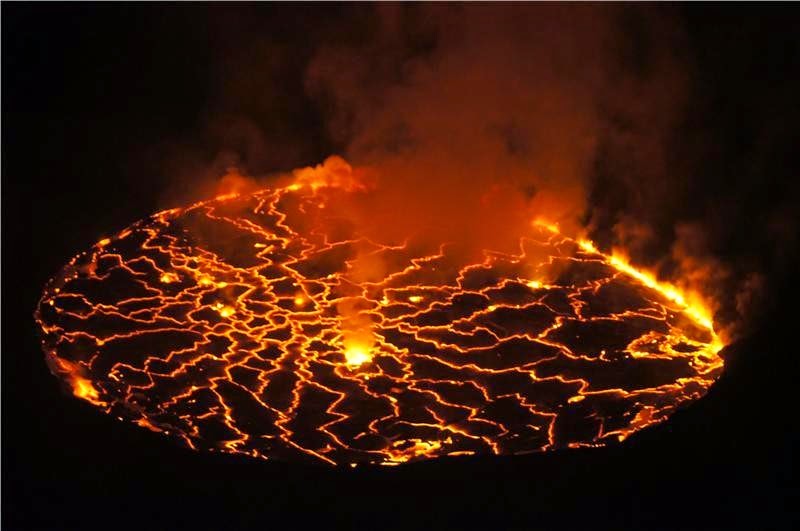
back to top
27.8 C
New York
Sunday, March 9, 2025
Home Blog Page 285

Mesolite

Mesolite Kannad , Aurangabad, Maharashtra, India Size: 8.2x6x5.3 cm Weight: 178 g © SpiriferMinerals

Chemical Formula: Na2Ca2Si9Al6O30·8H2O
Locality: Cyclopean Islands northeast of Catania, Sicily.
Name Origin: From the Greek mesos – “middle.”
Mesolite is a tectosilicate mineral with formula Na2Ca2Si9Al6O30·8H2O. It is a member of the zeolite group and is closely related to natrolite which it also resembles in appearance.

Mesolite crystallizes in the orthorhombic system and typically forms fibrous, acicular prismatic crystals or masses. Radiating sprays of needlelike crystals are not uncommon. It is vitreous in luster and clear to white in color. It has a Mohs hardness of 5 to 5.5 and a low specific gravity of 2.2 to 2.4. The refractive indices are nα=1.505 nβ=1.505 nγ=1.506.

Occurrence

It was first described in 1816 for an occurrence in the Cyclopean Islands near Catania, Sicily.From the Greek mesos, “middle”, as its composition lies between natrolite and scolecite.Like other zeolites, mesolite occurs as void fillings in amygdaloidal basalt also in andesites and hydrothermal veins.

History

Discovery date: 1816
Town of Origin : LNS
Country of Origin : ISLANDE; ILES FAROE

Optical properties

Optical and misc. Properties: Transparent to translucent
Refractive Index : 1,50
Axial angle 2V : ~80°

Physical Properties

Cleavage: {101} Perfect, {001} Perfect
Color:     White, Gray, Pale yellow.
Density: 2.2 – 2.4, Average = 2.29
Diaphaneity: Transparent to translucent
Fracture: Uneven – Flat surfaces (not cleavage) fractured in an uneven pattern.
Hardness: 5 – Apatite
Luminescence: Non-fluorescent.
Luster: Vitreous – Silky
Streak: white

Photos :

Mesolite Ritter Hot Springs, Grant Co., Oregon, USA Size: 5.5 x 4.0 x 3.0 cm (small cabinet) © danweinrich
Mesolite and chabazite Rupe di Aci Castello – Aci Castello – Etna Volcanic Complex – Catania prov. – Sicily – Italy Specimen weight:145 gr. Crystal size:mm. 7 Overall size: 97mm x 45 mm x 37 mm © minservice

Volcanic ash can threaten air traffic

Santiaguito volcano, Guatemala. Credit: David Damby

The presence of volcanic ash in the upper atmosphere presents multiple threats to aviation. It not only reduces visibility and abrades the exposed areas of the aircraft, the fine particles can also endanger the operation of aircraft engines. Recent experiments undertaken by volcanologists, led by Professor Donald Dingwell, Director of the Department of Earth and Environmental Science at LMU Munich, have shown that reheated ash becomes molten and begins to flow at temperatures around 1050°C.
The resulting viscous droplets can adhere to surfaces, and could thus damage jet-engine turbines more severely than is generally assumed. The new work is described in two papers that appear in the Journal of Applied Volcanology and Geophysical Research Letters.

The studies were carried out on ash samples obtained from two sources: Eyjafjallajökull volcano, in Iceland, and Santiaguito, in Guatemala. With the aid of a special microscope equipped with a heating stage, the researchers observed the change in morphology of ash pellets when subjected to a stepwise increase in temperature over the range 50 to 1600°C. This range encompasses the prevailing temperatures in the different parts of the turbines used in jet engines.

“At high temperatures, volcanic ash particles behave like sticky droplets of grease, which could potentially coat vital components of the engines,” says Dr. Wenjia Song. This could lead to alterations in the airflow within the turbines and compromise the cooling of the engines.

The ash particles used in the experiments began to soften at around 600 degrees, and fused to form porous agglomerates at 1050°C. “Our studies show that volcanic ash melts and can stick to surfaces at lower temperatures than anticipated. This means that they are potentially more hazardous to air traffic than currently believed,” says Dr. Ulrich Kueppers.

The researchers compared this behavior to that of the quartz sand conventionally used by engine manufacturers to test the durability of turbines. This material turned out to behave differently in the same range of temperature than the ash particles. “Crystalline sand is not an appropriate material with which to simulate the effects of volcanic ash on aircraft engines,” Kueppers concludes. For this reason, the authors of the new studies argue that the threat to jet-engine turbines posed by volcanic ash needs further assessment. “Moreover, such tests should evaluate the effects of varying ash particle concentrations both by weight and by number,” says Kueppers.

More information:
Song, W., K.-U. Hess, D. E. Damby, F. B. Wadsworth, Y. Lavallée, C. Cimarelli, and D. B. Dingwell (2014), Fusion characteristics of volcanic ash relevant to aviation hazards, Geophys. Res. Lett., 41, 2326–2333, DOI: 10.1002/2013GL059182.

Note : The above story is based on materials provided by Ludwig Maximilian University of Munich

Peace River

Map of the Peace River watershed in western Canada

The Peace River is a river in Canada that originates in the Rocky Mountains of northern British Columbia and flows to the northeast through northern Alberta. The Peace River flows into the Slave River, a tributary of the Mackenzie River. The Mackenzie is the 12th longest river in the world, preceded by the Mekong and followed by the Niger River. The Finlay River, the main headwater of the Peace River, is regarded as the ultimate source of the Mackenzie River.

History

The regions along the river are the traditional home of the Danezaa people, called the Beaver by the Europeans. The fur trader Peter Pond is believed to have visited the river in 1785. In 1788 Charles Boyer of the North West Company established a fur trading post at the river’s junction with the Boyer River.

In 1792 and 1793, the explorer Alexander Mackenzie travelled up the river to the Continental Divide. Mackenzie referred to the river as Unjegah, from a native word meaning “large river”.

The decades of hostilities between the Danezaa and the Cree, (in which the Cree dominated the Danezaa), ended in 1781 when a smallpox epidemic decimated the Cree. The Treaty of the Peace was celebrated by the smoking of a peace pipe. The treaty made the Peace River a border, with the Danezaa to the North and the Cree to the South.

In 1794, a fur trading post was built on the Peace River at Fort St. John; it was the first non-native settlement on the British Columbia mainland.

Post-Settlement

The rich soils of the Peace River valley in Alberta have been producing wheat crops since the late 19th century. The Peace River region is also an important centre of oil and natural gas production. There are also pulp and paper plants along the river in British Columbia.

The Peace River has two navigable sections, separated by the Vermilion Chutes, near Fort Vermilion. The first steam-powered vessel to navigate the Peace River was the Grahame, a Hudson’s Bay Company vessel built at Fort Chipewyan, on Lake Athabasca. Brothers of the Oblate Order of Mary Immaculate, built the St. Charles, to navigate the upper reaches of the River, from Fort Vermilion to Hudson’s Hope. Approximately a dozen vessels were to navigate the river. Most of the early vessels were wood-burning steamships, fueled by wood cut from the river’s shore. The last cargo vessel was the Watson’s Lake, retired in 1952.

Geography

Course

This river is 1,923 km long (from the head of Finlay River to Lake Athabasca). It drains an area of approximately 302,500 km2. At Peace Point, where it drains in the Slave River, it has an annual discharge of 2161 m3/s or 68,200,000 dam3/a.

A large man-made lake, Williston Lake, has been formed on the upper river by the construction of the W. A. C. Bennett Dam for hydroelectric power generation. The river then flows into Dinosaur Lake, which serves as a reservoir for the Peace Canyon Dam. After the dams, the river flows east into Alberta and then continues north and east into the Peace-Athabasca Delta in Wood Buffalo National Park, at the western end of Lake Athabasca. Water from the delta flows into the Slave River east of Peace Point and reaches the Arctic Ocean via the Great Slave Lake and Mackenzie River.

Note : The above story is based on materials provided by Wikipedia

Merwinite

Merwinite Location: Crestmore Quarry, Riverside County, California, USA. Copyright: © Jeff Weissman / Photographic Guide to Mineral Species

Chemical Formula: Ca3Mg(SiO4)2
Locality: Crestmore quarry, 5 miles NW of Riverside, Riverside Co., California.
Name Origin: Herbert Eugene Merwin (1878-1963), American mineralogist and petrologist, Carnegie Institute, Washington, D.C., USA.

History

Discovery date : 1921
Town of Origin : CARRIERE WET WEATHER, CRESTMORE, RIVERSIDE, CALIFORNIE
Country of Origin : USA

Optical properties

Optical and misc. Properties: Transparent to translucent
Refractive Index: from 1,70 to 1,72
Axial angle 2V : 66-76°

Physical Properties

Cleavage: {010} Perfect
Color:     Colorless, Gray, Pale green.
Density: 3.15
Diaphaneity: Transparent to translucent
Fracture: Brittle – Generally displayed by glasses and most non-metallic minerals.
Hardness: 6 – Orthoclase
Luminescence: Non-fluorescent.
Luster: Vitreous (Glassy)
Magnetism: Nonmagnetic
Streak: white

Photos :

Mineral: Merwinite in Monticellite-Spurrite Locality: Crestmore Quarry, Riverside County, California (Type Locality for Merwinite) Overall Size: 6x4x3 cm Crystals: 1-3 mm © JohnBetts-FineMinerals
Mineral: Merwinite and Plombièrite Locality: Crestmore Quarry, Riverside County, California (Type Locality for Merwinite) Overall Size: 9.5×8.5×4 cm Crystals: 1-3 mm © JohnBetts-FineMinerals

Modern Ocean Acidification Is Outpacing Ancient Upheaval, Study Suggests

Ocean acidification in the modern ocean may already be affecting some marine life, as shown by the partly dissolved shell of this planktic snail, or pteropod, caught off the Pacific Northwest. Credit: Nina Bednaršedk/NOAA

Some 56 million years ago, a massive pulse of carbon dioxide into the atmosphere sent global temperatures soaring. In the oceans, carbonate sediments dissolved, some organisms went extinct and others evolved.

Scientists have long suspected that ocean acidification caused the crisis — similar to today, as humanmade CO2 combines with seawater to change its chemistry. Now, for the first time, scientists have quantified the extent of surface acidification from those ancient days, and the news is not good: the oceans are on track to acidify at least as much as they did then, only at a much faster rate.

In a study published in the latest issue of Paleoceanography, the scientists estimate that ocean acidity increased by about 100 percent in a few thousand years or more, and stayed that way for the next 70,000 years. In this radically changed environment, some creatures died out while others adapted and evolved. The study is the first to use the chemical composition of fossils to reconstruct surface ocean acidity at the Paleocene-Eocene Thermal Maximum (PETM), a period of intense warming on land and throughout the oceans due to high CO2.

“This could be the closest geological analog to modern ocean acidification,” said study coauthor Bärbel Hönisch, a paleoceanographer at Columbia University’s Lamont-Doherty Earth Observatory. “As massive as it was, it still happened about 10 times more slowly than what we are doing today.”

The oceans have absorbed about a third of the carbon humans have pumped into the air since industrialization, helping to keep earth’s thermostat lower than it would be otherwise. But that uptake of carbon has come at a price. Chemical reactions caused by that excess CO2 have made seawater grow more acidic, depleting it of the carbonate ions that corals, mollusks and calcifying plankton need to build their shells and skeletons.

In the last 150 years or so, the pH of the oceans has dropped substantially, from 8.2 to 8.1–equivalent to a 25 percent increase in acidity. By the end of the century, ocean pH is projected to fall another 0.3 pH units, to 7.8. While the researchers found a comparable pH drop during the PETM–0.3 units–the shift happened over a few thousand years.

“We are dumping carbon in the atmosphere and ocean at a much higher rate today — within centuries,” said study coauthor Richard Zeebe, a paleoceanographer at the University of Hawaii. “If we continue on the emissions path we are on right now, acidification of the surface ocean will be way more dramatic than during the PETM.”

The study confirms that the acidified conditions lasted for 70,000 years or more, consistent with previous model-based estimates. “It didn’t bounce back right away,” said Timothy Bralower, a researcher at Penn State who was not involved in the study. “It took tens of thousands of years to recover.”

From seafloor sediments drilled off Japan, the researchers analyzed the shells of plankton that lived at the surface of the ocean during the PETM. Two different methods for measuring ocean chemistry at the time — the ratio of boron isotopes in their shells, and the amount of boron –arrived at similar estimates of acidification. “It’s really showing us clear evidence of a change in pH for the first time,” said Bralower.

What caused the burst of carbon at the PETM is still unclear. One popular explanation is that an overall warming trend may have sent a pulse of methane from the seafloor into the air, setting off events that released more earth-warming gases into the air and oceans. Up to half of the tiny animals that live in mud on the seafloor — benthic foraminifera — died out during the PETM, possibly along with life further up the food chain.

Other species thrived in this changed environment and new ones evolved. In the oceans, dinoflagellates extended their range from the tropics to the Arctic, while on land, hoofed animals and primates appeared for the first time. Eventually, the oceans and atmosphere recovered as elements from eroded rocks washed into the sea and neutralized the acid.

Today, signs are already emerging that some marine life may be in trouble. In a recent study led by Nina Bednaršedk at the U.S. National Oceanic and Atmospheric Administration, more than half of the tiny planktic snails, or pteropods, that she and her team studied off the coast of Washington, Oregon and California showed badly dissolved shells. Ocean acidification has been linked to the widespread death of baby oysters off Washington and Oregon since 2005, and may also pose a threat to coral reefs, which are under additional pressure from pollution and warming ocean temperatures.

“Seawater carbonate chemistry is complex but the mechanism underlying ocean acidification is very simple,” said study lead author Donald Penman, a graduate student at University of California at Santa Cruz. “We can make accurate predictions about how carbonate chemistry will respond to increasing carbon dioxide levels. The real unknown is how individual organisms will respond and how that cascades through ecosystems.”

Other authors of the study, which was funded by the U.S. National Science Foundation: Ellen Thomas, Yale University; and James Zachos, UC Santa Cruz.

Note : The above story is based on materials provided by The Earth Institute at Columbia University.

Ancient reefs preserved tropical marine biodiversity

View of reef biodiversity in the Indo-Pacific. Credit: Copyright David R. Bellwood

Habitat refugia in which coral reefs have remained stable over time played a key role in preserving tropical marine fish biodiversity, a study highlights. Researchers at the Laboratoire Ecologie des Systèmes Marins Côtiers (CNRS/IRD/Universités Montpellier 1 and 2/IFREMER) and the Laboratoire CoRéUs 2 (IRD) have shown that the current distribution of tropical marine biodiversity is mainly due to the persistence of such refugia during glacial periods in the Quaternary.
This imprint left by history thus has a greater impact on tropical fish biodiversity than contemporary environmental factors such as water temperature and reef area. The study, carried out in collaboration with several international teams, demonstrates the need to protect certain irreplaceable habitats that allow species to persist during periods of climate change.

Scientists have long been intrigued by the marine biodiversity peak located around Indonesia and the Philippines, in the so-called Coral Triangle, which hosts approximately three thousand coral reef fish species, i.e. ten times more than in the eastern Pacific and Atlantic at the same latitude and in similar habitats. This biodiversity gradient is still poorly understood. Although many hypotheses have been put forward, most of them focus on the impact of current variables such as reef area and water temperature.

Coral reef habitats develop under highly specific temperature and light conditions. On the basis of reconstructed Quaternary sea temperatures, the authors of the study were able to map the reefs and observe their evolution over 2.6 million years. By comparing the contemporary global distribution of tropical marine fish1 with that of the paleo-reefs, the researchers were for the first time able to test the key role of habitats that persisted over many glacial periods and thus served as biodiversity refugia.

The researchers showed that the degree of isolation of contemporary reefs from Quaternary refugia is the most significant factor explaining the distribution of tropical marine fish observed today. The closer a reef is to one of these regions that are stable over time, the greater its biodiversity today. These findings point to the persistence of species in these regions, massive extinction rates outside them, and the ability of habitat refugia to act as sources for the colonization of new coral reefs that appeared in warmer periods.

If fish did leave refugia to occupy new regions, contemporary biodiversity should also depend on the recolonization ability of each species. To test this hypothesis, the researchers investigated three families of fish that are characteristic of coral reef habitats and have different dispersal capacities. Damselfish are less effective colonizers than butterflyfish and wrasse. As a result, with increasing distance from refugia, species diversity in damselfish falls significantly faster than for the other two families. The very old history of reefs therefore has a crucial effect not only on contemporary biodiversity distribution but also on the species and phylogenetic lineage2 composition of tropical fish communities.

By studying the ages of the various species in these three families of fish, the researchers also observed that both the oldest species and the most recent ones occur only in coral habitats near refugia. These reefs that have persisted over time have thus played a dual role as museum and cradle: they have preserved old species and led to the emergence of new ones (speciation). Quaternary climate fluctuations have therefore left a lasting imprint on the global distribution of coral reef biodiversity. This message from the past highlights the need to protect habitat refugia, since it is these stable regions, associated with corridors favorable to recolonization, that ensure the large-scale preservation of biodiversity. In today’s context of global change leading to extreme climate events impacting habitats, this message is more important than ever.

(1) Distribution established thanks to the GASPAR project headed by Michel Kulbicki and funded by the Fondation pour la Recherche sur la Biodiversité (FRB) via the Centre de Synthèse et d’Analyse sur la Biodiversité (CESAB).

(2) Species belong to lineages based on their degree of kinship. Such lineages make it possible to understand the evolutionary history of species.

Note : The above story is based on materials provided by CNRS.

Mendipite

Mendipite Merehead quarry, Mendip Hills, Somerset, England Copyright © Dakota Matrix Minerals

Chemical Formula: Pb3Cl2O2
Locality: Mendip Hills, Somersetshire, England.
Name Origin: Named after its locality.

Mendipite is a rare mineral that was named in 1939 for the locality where it is found, the Mendip Hills in Somerset, England. It is an oxide of lead, with chlorine, formula Pb3Cl2O2.

History

Discovery date : 1839
Town of Origin : CHURCHILL, MENDIP HILLS, SOMERSETSHIRE
Country of Origin : ANGLETERRE

Optical properties

Optical and misc. Properties : Translucent
Refractive Index: from 2,24 to 2,31
Axial angle 2V : 90°

Physical Properties

Cleavage: {010} Distinct, {100} Distinct
Color: Colorless, White, Gray, Yellowish, Bluish.
Density: 7 – 7.2, Average = 7.1
Diaphaneity: Translucent
Fracture: Conchoidal – Uneven – Uneven fracture producing small, conchoidal fragments.
Hardness: 2.5-3 – Finger Nail-Calcite
Luster: Adamantine – Pearly
Streak: white

Photos :

Mendipite Mendip Hills, Somerset, England (TYPE LOCALITY) Miniature, 5.1 x 4.0 x 2.5 © irocks
Chloroxiphite with Diaboleite in Mendipite Higher Pitts Mine, Priddy, near the Mendip Hills, Somerset, England Miniature, 4.7 x 2.8 x 1.9 cm © irocks

Researchers look to the Southern Ocean for an explanation of the ‘Last Glacial Maximum’

An artist’s rendering of ice age Earth at glacial maximum. Credit: Ittiz/Wikimedia Commons

The paleoclimate record for the last ice age—a time 21,000 years ago called the “Last Glacial Maximum” (LGM)—tells of a cold Earth whose northern continents were covered by vast ice sheets. Chemical traces from plankton fossils in deep-sea sediments reveal rearranged ocean water masses, as well as extended sea ice coverage off Antarctica. Air bubbles in ice cores show that carbon dioxide in the atmosphere was far below levels seen before the Industrial Revolution.
While ice ages are set into motion by Earth’s slow wobbles in its transit around the sun, researchers agree that the solar-energy decrease alone wasn’t enough to cause this glacial state. Paleoclimatologists have been trying to explain the actual mechanism behind these changes for 200 years.

“We have all these scattered pieces of information about changes in the ocean, atmosphere, and ice cover,” says Raffaele Ferrari, the Breene M. Kerr Professor of Physical Oceanography in MIT’s Department of Earth, Atmospheric and Planetary Sciences, “and what we really want to see is how they all fit together.”

Researchers have always suspected that the answer must lie somewhere in the oceans. Powerful regulators of Earth’s climate, the oceans store vast amounts of organic carbon for thousands of years, keeping it from escaping into the atmosphere as CO2. Seawater also takes up CO2 from the atmosphere via photosynthesizing microbes at the surface, and via circulation patterns.

In a new application of ocean physics, Ferrari, along with Malte Jansen PhD ’12 of Princeton University and others at the California Institute of Technology, have found a new approach to the puzzle, which they detail in this week’s Proceedings of the National Academy of Sciences.

Lung of the ocean

The researchers focused on the Southern Ocean, which encircles Antarctica—a critical part of the carbon cycle because it provides a connection between the atmosphere and the deep ocean abyss. Ruffled by the winds whipping around Antarctica, the Southern Ocean is one of the only places where the deepest carbon-rich waters ever rise to the surface, to “breathe” CO2 in and out.

The modern-day Southern Ocean has a lot of room to breathe: Deeper, carbon-rich waters are constantly mixing into the waters above, a process enhanced by turbulence as water runs over jagged, deep-ocean ridges.

But during the LGM, permanent sea ice covered much more of the Southern Ocean’s surface. Ferrari and colleagues decided to explore how that extended sea ice would have affected the Southern Ocean’s ability to exchange CO2 with the atmosphere.

Shock to the system

This question demanded the use of the field’s accumulated knowledge of ocean physics. Using a mathematical equation that describes the wind-driven ocean circulation patterns around Antarctica, the researchers calculated the amount of water that was trapped under the sea ice by currents in the LGM. They found that the shock to the entire Earth from this added ice cover was massive: The ice covered the only spot where the deep ocean ever got to breathe. Since the sea ice capped these deep waters, the Southern Ocean’s CO2 was never exhaled to the atmosphere.

The researchers then saw a link between the sea ice change and the massive rearrangement of ocean waters that is evident in the paleoclimate record. Under the expanded sea ice, a greater amount of upwelled deep water sank back downward. Southern Ocean abyssal water eventually filled a greater volume of the entire midlevel and lower ocean—lifting the interface between upper and lower waters to a shallower depth, such that the deep, carbon-rich waters lost contact with the upper ocean. Breathing less, the ocean could store a lot more carbon.

A Southern Ocean suffocated by sea ice, the researchers say, helps explain the big drop in atmospheric CO2 during the LGM.

Dependent relationship

The study suggests a dynamic link between sea-ice expansion and the increase of ocean water insulated from the atmosphere, which the field has long treated as independent events. This insight takes on extra relevance in light of the fact that paleoclimatologists need to explain not just the very low levels of atmospheric CO2 during the last ice age, but also the fact that this happened during each of the last four glacial periods, as the paleoclimate record reveals.

Ferrari says that it never made sense to argue that independent changes drew down CO2 by the exact same amount in every ice age. “To me, that means that all the events that co-occurred must be incredibly tightly linked, without much freedom to drift beyond a narrow margin,” he says. “If there is a causality effect among the events at the start of an ice age, then they could happen in the same ratio.”

“This study is an elegant, straightforward explanation that pulls all these pieces together into one place like no one has managed to do before,” says Daniel Sigman, a professor of geological and geophysical sciences at Princeton, who was not involved in the study.
Sigman, who tries to understand carbon fluxes in the last ice age, says that this new framework narrows his focus to a smaller range of possibilities. “What it really does is tune me in to the sea ice and biochemical conditions that I need to see at the Southern Ocean’s surface for the full CO2 drop to be realized.”

More information:
“Antarctic sea ice control on ocean circulation in present and glacial climates,” by Raffaele Ferrari et al. www.pnas.org/cgi/doi/10.1073/pnas.1323922111

Note : The above story is based on materials provided by Massachusetts Institute of Technology

New Ichthyosaur Graveyard Found

Section of ichthyosaur-bearing sediment unit at Tyndall ice field: http://dx.doi.org/10.1130/B30964.1.

Boulder, Colo., USA – In a new study published in the Geological Society of America Bulletin, geoscientists Wolfgang Stinnesbeck of the University of Heidelberg and colleagues document the discovery of forty-six ophthalmosaurid ichthyosaurs (marine reptiles). These specimens were discovered in the vicinity of the Tyndall Glacier in the Torres del Paine National Park of southern Chile. Among them are numerous articulated and virtually complete skeletons of adults, pregnant females, and juveniles.
Preservation is excellent and occasionally includes soft tissue and embryos. The skeletons are associated with ammonites, belemnites, inoceramid bivalves, and fishes as well as numerous plant remains. The enormous concentration of ichthyosaurs is unique for Chile and South America and places the Tyndall locality among the prime fossil Lagerstätten for Early Cretaceous marine reptiles worldwide.

Four different species have been identified. Both concentration and diversity of ichthyosaurs are unique for South America and place the Tyndall locality among the prime fossil Lagerstätten marine reptiles worldwide. The deposit is Early Cretaceous in age (about 146 million years ago) and forms part of a deep water sequence located in the Rocas Verdes Basin, a straight separating Antarctica and South America from Late Jurassic to late Early Cretaceous times.

The Tyndall ichthyosaurs were gregarious and likely hunted in packs in a submarine canyon near the east coast of this sea. Their potential prey, belemnites and small fishes, were abundant due to plankton blooms caused by cold water upwelling. Occasionally, high energy turbiditic mudflows sucked down everything in their reach, including ichthyosaurs. Inside the suspension flows, the air-breathing reptiles lost orientation and finally drowned. They were instantly buried in the abyss at the bottom of the canyon.

More Information :
W. Stinnesbeck et al., Institut für Geowissenschaften, Ruprecht-Karls-Universität Heidelberg, Im Neuenheimer Feld 234-236, 69221 Heidelberg, Germany. Published online 22 May 2014; http://dx.doi.org/10.1130/B30964.1

Note : The above story is based on materials provided by Kea Giles ,GSA Communications

Mellite

Mellite Csordakúti Mine, Fejer County, Hungary Small Cabinet, 6.4 x 4.7 x 4.1 cm © irocks

Chemical Formula: Al2[C6(COO)6]·16H2O
Locality: Arten, Thüringen, Germany
Name Origin: From the Latin mel – “honey.”
Mellite, also called honeystone, is an unusual mineral being also an organic chemical. Chemically identified as an aluminium salt of mellitic acid; that is, aluminium benzene hexacarboxylate hydrate, with the chemical formula Al2[C6(COO)6]·16H2O.

It is a translucent honey-coloured crystal which can be polished and faceted to form striking gemstones. It crystallizes in the tetragonal system and occurs both in good crystals and as formless masses. It is soft with a Mohs hardness of 2 to 2.5 and has a low specific gravity of 1.6.

It was discovered originally in 1789 at Artern in Thuringia in Germany it has subsequently also been found in Russia, Austria, the Czech Republic, and Hungary. It was named from the Greek μέλ˘ι, “melis” for honey, in allusion to its color.

It is found associated with lignite and is assumed to be formed from plant material with aluminium derived from clay.

History

Discovery date : 1793
Town of Origin : ARTEN, THURINGE
Country of Origin : ALLEMAGNE

Optical properties

Optical and misc. Properties :   Transparent to Translucent
Refractive Index : from 1,51 to 1,53

Physical Properties

Cleavage: {011} Imperfect
Color:     Brown, Brownish white, Colorless, Yellow, Golden brown.
Density: 1.55 – 1.65, Average = 1.6
Diaphaneity: Transparent to Translucent
Fracture: Conchoidal – Fractures developed in brittle materials characterized by smoothly curving surfaces, (e.g. quartz).
Hardness: 2-2.5 – Gypsum-Finger Nail
Luminescence: Fluorescent and Phosphorescent, Short UV=blue, Long UV=blue.
Luster: Vitreous (Glassy)
Streak: white

Photos :

Mellit Csordakut Mine, Bicske-Csordakut, Bicske-Zsambeki Basin, Fejer County, Hungary Miniature, 3.5 x 2.5 x 1.8 cm © irocks
Mellite Cxzordakut, Tatabanya, Hungary Miniature, 4.7 x 4.5 x 4.2 cm © irocks

Super-eruptions – not quite so super?

Grand Prismatic Spring, Yellowstone National Park, Wyoming.

It turns out that one of the deadliest hazards the Earth can throw at us may happen more often than we thought. Darren Mark and Ben Ellis report on how their work in Yellowstone could radically change our understanding of these events, with implications not just for those living nearby but also for the global climate.

The largest explosive volcanic events, known as ‘super-eruptions’, are one of the greatest geological threats to mankind. Globally, millions of people live in regions that could be devastated by the eruption of a super-volcano – for example, Yellowstone in North America, Campi Flegrei in southern Italy, and Toba in Indonesia. These eruptions can produce hundreds or even thousands of cubic kilometres of magma over days or weeks.

Yet their most widespread effects don’t come from locally-devastating pyroclastic flows of superheated gas and rock, but from ash clouds that can circle the globe. Sulphur injected into the stratosphere oxidises to form small droplets of sulphuric acid. These stop sunlight reaching the planet’s surface, cooling the climate.

For example, the most recent super-eruption of the Quaternary Period – the one we are in at present – was the eruption of the Young Toba Tuff (YTT), which occurred around 75,000 years ago in what is now Indonesia. It has been suggested as one of the most significant events in the course of human evolution, leading to cataclysmic changes in terrestrial ecosystems and nearly wiping our species out. Yet not all scientists agree. To prove or disprove the theory, we need to know the exact order of events around the super-eruption, as well as precisely how – and how quickly – ecosystems responded.

We can test these relationships with high-precision geochronology. The ash ejected during super-eruptions comprises silica-glass shards and mineral crystals from the fragmented magma, as well as pieces of the volcano itself. We can harvest the different mineral crystals that were growing in the magma before the eruption from the volcanic deposits, and date some of them to reveal the age of the eruption.

High-precision dating techniques are now transforming our view of super-eruptions. These rely on accurately measuring the relative amounts of two different forms of the same element – known as isotopes – in a sample of rock. Some isotopes decay into others at a constant rate, so if we know how much of each was there at the start and can measure what is there now, we can learn how long ago the rocks were created.

These methods are getting more precise all the time. This improvement comes from new technological developments in mass spectrometry, the technique we use to measure minerals’ isotopic composition; from refinements to the known rates at which different isotopes decay; and from other changes in our approaches to dating of rocks and minerals. This isn’t just a matter of adding another decimal place to a number; it lets us dissect the geological record at the highest level of detail, and accurately sequence the Earth’s history.

Little and often?

With these new tools at our disposal, we wanted to test our understanding of super-eruptions by studying one of the largest examples of recent geological times – Yellowstone, a volcano synonymous with the term. The Yellowstone Caldera is well known for three huge eruptions, at around 2.1, 1.3 and 0.6 million years ago.

These episodes were punctuated by long periods of relative peace, during which lava flowed out episodically rather than being hurled explosively into the air. The largest and oldest of the three major explosive events was the Huckleberry Ridge Tuff (HRT), which erupted a volume of rock approximately 2,500 times larger than the recent Eyjafjallajökull eruption in Iceland – a relatively small event that nevertheless caused chaos in the skies across the Atlantic and Europe.

The HRT has three component parts, known as members A, B and C. They contain a superficially similar mixture of minerals, but they have some subtle yet important differences. Initial mapping in the late 1960s discriminated between the three members on the basis of differences in texture, such as the size and proportions of the crystals, proposing that each erupted from a different place. Having reviewed this literature in detail, we were intrigued by this idea. We wondered – was it possible that each member also erupted at a different time?

We started out by analysing the chemical and isotopic composition of hundreds of crystals of sanidine, quartz, augite and fayalitic olivine from the HRT deposits. Data showed that whereas members A and B were similar, member C was chemically different, suggesting it crystallised under different conditions.

These results added fuel to our fire, and we began a campaign to date each member as precisely as possible. We harvested potassium feldspar from each member, and analysed single crystals using a method known as argon-argon dating at the NERC Argon Isotope Facility. This technique relies on the known decay rate of a naturally occurring isotope of potassium; we measure the relative quantities of this isotope and its decay product to calculate exactly how long ago it was erupted.

Our results showed members A and B emerged at the same time, but member C appeared at least 6,000 years later. Member C accounts for around 12 per cent of the HRT’s total volume, and although the eruption of Members A and B is still big enough to count as a super-eruption (estimated at around 2200km3 of rock), the volume of Member C alone, an estimated 290km3, is around 300 times larger than all the material ejected by the 1980 eruption of Mount St Helens.

The study raises the possibility that many ancient ‘super-eruptions’ may actually have been many separate events that happened across timescales that are short in geological terms, although still very long by everyday standards.

If this is right, it is a paradigm-shifting hypothesis. It implies that although each volcanic event was smaller than we have thought until now, super-eruptions may have happened more often. As well as the hazard potential of more frequent super-eruptions, we have little idea what impact several large eruptions occurring over a short period would have on the global climate, yet this is an extremely important question.

Our research is now focusing on the younger Yellowstone super-eruptions, assessing the super-eruption deposits of Toba, and reexamining Campi Flegrei and Mount Vesuvius, infamous for the destruction of Pompeii in 79AD.

We have found multiple layers of volcanic ash that can be correlated to the YTT, but that are separated by varying amounts of sediment in deep ocean cores. This suggests there may have been multiple eruptions of Toba around 75,000 years ago. Pilot data from all study sites show similarities with our results from Yellowstone, suggesting these other super-eruption deposits are also made up of smaller eruptions over time.

As a result, the most important question we have to resolve is ‘how long does it take to generate voluminous super-eruption-sized batches of magma?’ This may be the primary control on how quickly one super-volcano eruption can follow another.

With the potential possibility that some super-eruptions could be resolved into smaller, discrete events we wonder whether in times to come, super-eruptions will not be quite so super?

Note : The above story is based on materials provided by Dr Darren Mark is a post-doctoral research fellow and manager of the NERC Argon Isotope Facility, based at the Scottish Universities Environmental Research Centre. Dr Ben Ellis is a post-doctoral researcher at ETH Zurich.

New species from the past

This is a female Aradus macrosomus, the new species of flat bug discovered in Baltic amber. Credit: Stefan Heim

Baltic amber deposits reveal a new species of flat bug from the genus Aradus
A piece of Eocene Baltic Amber of about 45 million years age contains a well preserved extinct flat bug, which turned out to be a new species to science. This exciting discovery is one of the many secrets that deposits of Baltic amber have revealed in the last years and are yet to come in the future. The study describing the new species was published in the open access journal Deutsche Entomologische Zeitschrift.

The new species Aradus macrosomus is a rather large representative of the genus, differing by its size and particular structures from its congeners. The name of the new species is chosen to reflect its unusual size and derives from the Greek words “macros” – large and “soma” – body.

Baltic Amber, a fossilized tree resin found on or near the shores of the eastern Baltic Sea, represents the largest deposit of amber in the world. It is exceptionally rich in well-preserved inclusions of botanical and zoological objects, particularly arthropods.

To date 14 species of the genus Aradus have been described from Baltic amber inclusions. Extant species of flat bugs commonly live on and under the bark of dead trees, which could be an explanation why so many species are well preserved in amber deposits.

Original Source:
Heiss E (2014) Revision of the flat bug family Aradidae from Baltic Amber IX. Aradus macrosomus sp. n. (Hemiptera: Heteroptera). Deutsche Entomologische Zeitschrift 61(1): 27-29. doi: 10.3897/dez.61.7155

Note : The above story is based on materials provided by Pensoft Publishers

Melanophlogite

Melanophlogite Locality: Giona Mine, Milena, Caltanissetta Province, Sicily, Italy Photo Copyright © Christian Rewitzer 2008

Chemical Formula: 46SiO2·6(N2,CO2)·2(CH4,N2)
Locality: In Italy, at Solfatara Giona, Racalmuto, and at Caltanissetta, Sicily.
Name Origin: From the Greek for “black” and “to be burned” in allusion to the fact that some specimens blacken on heating. Low temperature form.

Melanophlogite (MEP) is a rare silicate mineral and a polymorph of silica (SiO2). It has a zeolite-like porous structure which results in relatively low and not well-defined values of its density and refractive index. Melanophlogite often overgrows crystals of sulfur or calcite and typically contains a few percent of organic and sulfur compounds. Darkening of organics in melanophlogite upon heating is a possible origin of its name, which comes from the Greek for “black” and “to be burned”.

Occurrence

Melanophlogite is a rare mineral which usually forms round drops (see infobox) or complex intertwinned overgrowth structures over sulfur or calcite crystals. Rarely, it occurs as individual cubic crystallites a few millimeters in size. It is found in Parma, Torino, Caltanissetta and Livorno provinces of Italy; also in several mines of California in the US, in Crimea (Ukraine) and Pardubice Region (Czech Republic).

History

Discovery date : 1876
Town of Origin : SOLFATARE GIONA, RACALMUTO, SICILE
Country of Origin : ITALIE

Optical properties

Optical and misc. Properties : Transparent to Translucent
Refractive Index : from 1,42 to 1,45

Physical Properties

Cleavage: None
Color:     Brown, Colorless, Light yellow, Dark reddish brown.
Density: 1.99 – 2.11, Average = 2.04
Diaphaneity: Transparent to Translucent
Fracture: Brittle – Generally displayed by glasses and most non-metallic minerals.
Hardness: 6.5-7 – Pyrite-Quartz
Luminescence: Fluorescent, Short UV=weak gray-white, Long UV=gray-white.
Luster: Vitreous (Glassy)
Streak: white

Photos :

Melanophlogite Fortullino, Rosignano Marittima, Livorno Province, Tuscany, Italy Specimen weight:82 gr. Crystal size:balls dia 0,5 cm Overall size:7 x 5,5 x 3,5 cm © minservice
Melanophlogite Location: Racalmuto, Sicily, Italy. Copyright: © Lou Perloff / Photo Atlas of Minerals

Under the sea

Image of the seafloor.

Dean Wilson recently returned from a research cruise off Japan, carrying out deep-sea drilling to gather rock samples and sensor data on the geology beneath the seabed. The results will give us a better understanding of the risk of earthquakes and tsunamis. He describes life aboard the good ship Chikyu.

Ahead of my first trip to Japan, my head was full of childhood images of futuristic robots and high-speed trains. Tokyo didn’t disappoint. In the two days I had on dry land, I experienced delicious food, friendly people and the crazy juxtaposition of tranquil shrines in the midst of a busy city. It was a whirlwind experience.

The next morning, I found myself on a small passenger helicopter with a handful of other scientists heading out over the Philippine Sea, to a drop in the ocean about 100km south of Japan. Thirty minutes later I caught my first glimpse of the deep-sea drilling vessel Chikyu, essentially a mobile drilling platform.

It casts an unmistakable silhouette against the enormous expanse of the ocean. The growing image of the giant ship was stupendous. With its 70m derrick (drilling rig) standing proudly to attention in the centre of the vessel, it looked like a giant Tetris block sent down from the heavens! The Chikyu would be my home, office and lab for the next seven weeks. Suddenly a wave of emotions washed over me: I was excited, nervous and a little hysterical – what was I doing here?

About ten months earlier, I applied to sail on the Integrated Ocean Drilling Program’s (IODP) Expedition 338, a sea-going science mission to understand what causes large earthquakes and the generation of tsunami waves. Here’s what I thought when reading the advert: ‘WANTED: team of specialist scientists needed for intrepid exploration of the Earth below the sea. Seven weeks of hard but rewarding work out on the ocean waves. Beards optional!’

As a full-time researcher in marine geophysics, I spend most of my days sitting at a computer, so I really relish the opportunity to escape from the office and get some first-hand experience of collecting the data that is so crucial to my work.

Expedition 338 is part of a larger project aimed at learning more about how and why earthquakes and tsunamis occur. The IODP explores the geology below the seafloor to study Earth processes that evolve over time, ultimately causing violent, unpredictable natural disasters. The Nankai Trough Seismogenic Zone Experiment (NanTroSEIZE) is a complex ocean drilling project that is being conducted over several years (2007 to present) with multiple expeditions and scientists from all over the world.

NanTroSEIZE is the first attempt to drill, sample, and instrument the earthquake-causing or ‘seismogenic’ portion of the Earth’s crust, where violent, large-scale quakes have occurred repeatedly throughout history. The Nankai Trough is one of the most seismically active zones on the planet, and our sensors and sample data are expected to yield insights into the processes responsible for earthquakes and tsunamis, with implications for disaster planning and early warning systems.

Ice cream, ping-pong and borehole geophysics

Daily life onboard Chikyu was easy going. Meals are provided every six hours, washing is done within four and cabins are cleaned regularly. Everything is run to ensure that the ship’s crew, drilling engineers and scientists can work around the clock. The scientists have a daily meeting, with an operation and logistics update, science presentations, as well as morale-boosting items like choosing logo designs and planning the Christmas party – strictly no alcohol allowed though.

After several weeks, ‘Chikyu Time’ sets in, where days feel like weeks and every day is Groundhog Day. There are, however, plenty of things to break up the routine – ice cream twice a week, ping-pong tournaments, film screenings and even a sauna and hot tub.

Chikyu is an amazing machine. Using its six computer-controlled thrusters, the 210m, 57,000-tonne vessel can stay in exactly the same position for months at a time in all but the most challenging conditions. (For comparison, the Eiffel Tower weighs about 10,000 tonnes.) It can drill a staggering 7km below the seafloor, in water up to 2.5km deep. If the drill pipe that extends from the ship to the seafloor were as thick as a straw, it would be 100m long.

During Expedition 338, we drilled 12 holes into different parts of the seabed. They reached up to 2km below the seabed, and targeted different features identified from seafloor maps and images of the subsurface. At some holes we recovered rock samples (cores), while at others we measured geophysical properties, including electrical conductivity and acoustic velocity, from within the borehole while drilling. The holes were 30cm across – the size of a regular pizza – and we recovered the cores from inside the hollow drill barrel, known as the string, using a method akin to coring an apple.

In the end the recovered core is pulled up inside a core liner that’s about the same size as a household drainpipe. After this, the cores get split in two lengthways. One half is described and measured on board, with samples taken for later work, while the second half is archived. This involved categorising the sediments and rocks based on their mineralogy, elemental composition and grain size to understand where they came from – for example, from submarine river deposits or volcanic ash layers. Fossils and magnetic minerals can be used to understand the age of the material, and structures within it are analysed to understand how the rocks have been deformed since they were deposited.

My job was to interpret the geophysical data that were collected whilst drilling holes where no core samples were taken. This involved spending lots of time analysing curves and images for patterns and relating this information to what we already knew about the subsurface geology from the cores recovered at nearby holes. Once I’d analysed the data, key observations were compiled into reports that will eventually be used as an expedition reference volume for the whole scientific community.

Chikyu was also recently involved in IODP’s Japan Trench Fast Drilling Project (JFAST), to understand the very large fault slip that occurred in the shallow subseafloor during the 2011 Tohoku earthquake. (A fault slip is when two sections of the earth’s crust that were previously locked together by friction suddenly slide over each other.) This large slip of 30 to 50 metres was the main source of the devastating tsunami that caused so much damage and loss of life along the northeast coast of Honshu.

Understanding the Tohoku earthquake and tsunami has obvious benefits in evaluating the hazards at other subduction zones around the world. At these zones, the vast tectonic plates of the Earth’s crust are gradually sliding past each other, one beneath the other along the largest faults on Earth. Friction between the plates makes them grip together, building up energy, until they suddenly slip, releasing the stored energy in an earthquake. Obtaining a piece of the fault that moved tens of metres during the earthquake will provide meaningful new geological information. Scientists have never seen samples of a fault that has moved so far during a recent subduction zone earthquake.

Although Expedition 338 ended in January, there is still a great deal of work to be done. Our tasks include reports, meetings, post-cruise research, scientific publications and wider public outreach activities. Expeditions are expensive, but the rare data and samples we collected will be worked on for many years to come. When new techniques are developed or new theories need to be tested, the researchers of the future will be able to build on the work we did on the cruise to better understand the secrets of the Earth.

Note : The above story is based on materials provided by Dr Dean J Wilson is a marine geophysicist at the University of Southampton.

Solving the puzzle of ice age climates

Earth from near space (stock image). Credit: © dell / Fotolia

The paleoclimate record for the last ice age — a time 21,000 years ago called the “Last Glacial Maximum” (LGM) — tells of a cold Earth whose northern continents were covered by vast ice sheets. Chemical traces from plankton fossils in deep-sea sediments reveal rearranged ocean water masses, as well as extended sea ice coverage off Antarctica. Air bubbles in ice cores show that carbon dioxide in the atmosphere was far below levels seen before the Industrial Revolution.
While ice ages are set into motion by Earth’s slow wobbles in its transit around the sun, researchers agree that the solar-energy decrease alone wasn’t enough to cause this glacial state. Paleoclimatologists have been trying to explain the actual mechanism behind these changes for 200 years.

“We have all these scattered pieces of information about changes in the ocean, atmosphere, and ice cover,” says Raffaele Ferrari, the Breene M. Kerr Professor of Physical Oceanography in MIT’s Department of Earth, Atmospheric and Planetary Sciences, “and what we really want to see is how they all fit together.”

Researchers have always suspected that the answer must lie somewhere in the oceans. Powerful regulators of Earth’s climate, the oceans store vast amounts of organic carbon for thousands of years, keeping it from escaping into the atmosphere as CO2. Seawater also takes up CO2 from the atmosphere via photosynthesizing microbes at the surface, and via circulation patterns.

In a new application of ocean physics, Ferrari, along with Malte Jansen PhD ’12 of Princeton University and others at the California Institute of Technology, have found a new approach to the puzzle, which they detail in this week’s Proceedings of the National Academy of Sciences.

Lung of the ocean

The researchers focused on the Southern Ocean, which encircles Antarctica — a critical part of the carbon cycle because it provides a connection between the atmosphere and the deep ocean abyss. Ruffled by the winds whipping around Antarctica, the Southern Ocean is one of the only places where the deepest carbon-rich waters ever rise to the surface, to “breathe” CO2 in and out.

The modern-day Southern Ocean has a lot of room to breathe: Deeper, carbon-rich waters are constantly mixing into the waters above, a process enhanced by turbulence as water runs over jagged, deep-ocean ridges.

But during the LGM, permanent sea ice covered much more of the Southern Ocean’s surface. Ferrari and colleagues decided to explore how that extended sea ice would have affected the Southern Ocean’s ability to exchange CO2 with the atmosphere.

Shock to the system

This question demanded the use of the field’s accumulated knowledge of ocean physics. Using a mathematical equation that describes the wind-driven ocean circulation patterns around Antarctica, the researchers calculated the amount of water that was trapped under the sea ice by currents in the LGM. They found that the shock to the entire Earth from this added ice cover was massive: The ice covered the only spot where the deep ocean ever got to breathe. Since the sea ice capped these deep waters, the Southern Ocean’s CO2 was never exhaled to the atmosphere.

The researchers then saw a link between the sea ice change and the massive rearrangement of ocean waters that is evident in the paleoclimate record. Under the expanded sea ice, a greater amount of upwelled deep water sank back downward. Southern Ocean abyssal water eventually filled a greater volume of the entire midlevel and lower ocean — lifting the interface between upper and lower waters to a shallower depth, such that the deep, carbon-rich waters lost contact with the upper ocean. Breathing less, the ocean could store a lot more carbon.

A Southern Ocean suffocated by sea ice, the researchers say, helps explain the big drop in atmospheric CO2 during the LGM.

Dependent relationship

The study suggests a dynamic link between sea-ice expansion and the increase of ocean water insulated from the atmosphere, which the field has long treated as independent events. This insight takes on extra relevance in light of the fact that paleoclimatologists need to explain not just the very low levels of atmospheric CO2 during the last ice age, but also the fact that this happened during each of the last four glacial periods, as the paleoclimate record reveals.

Ferrari says that it never made sense to argue that independent changes drew down CO2 by the exact same amount in every ice age. “To me, that means that all the events that co-occurred must be incredibly tightly linked, without much freedom to drift beyond a narrow margin,” he says. “If there is a causality effect among the events at the start of an ice age, then they could happen in the same ratio.”

Note : The above story is based on materials provided by Massachusetts Institute of Technology.

Meionite

Vesuvianite and Meionite San Vito quarry, Ercolano, Monte Somma, Somma-Vesuvius Complex, Naples Province, Campania, Italy Specimen weight:274 gr. Crystal size:to 0.8 cm Overall size: 100mm x 64 mm x 50 mm © minservice

Chemical Formula: Ca4Al6Si6O24CO3
Locality: Mte. Somma, Vesuvius, Italy.
Name Origin: From the Greek for “less”, referring to its less acute pyramidal form compared with vesuvianite.
Meionite is a tectosilicate belonging to the scapolite group with the formula Ca4Al6Si6O24CO3. Some samples may also contain a sulfate group. It was first discovered in 1801 on Mt Somma, Vesuvius, Italy.

History

Discovery date : 1801
Town of Origin : MONTE SOMMA, MT. VESUVE (VOLCAN), NAPLES, CAMPANIE
Country of Origin: ITALIE

Optical properties

Optical and misc. Properties: Transparent to subtranslucent
Refractive Index : from 1,55 to 1,60

Physical Properties

Cleavage: {???} Distinct, {???} Indistinct
Color:     Bluish, Brownish, Colorless, Violet, Greenish.
Density: 2.66 – 2.73, Average = 2.69
Diaphaneity: Transparent to subtranslucent
Fracture: Sub Conchoidal – Fractures developed in brittle materials characterized by semi-curving surfaces.
Hardness: 5-6 – Between Apatite and Orthoclase
Luminescence: Fluorescent, Short UV=yellow-white, Long UV=red.
Luster: Vitreous – Resinous
Streak: colorless

Photos :

Meionite Monte Somma, Somma-Vesuvius Complex, Naples Province, Campania, Italy Specimen weight:52 gr. Crystal size:0,6 cm Overall size:5,5 x 3,5 x 3 cm © minservice
Meionite var. Mizzonite Pianura, Campagna, Italy (TYPE LOCALITY) Small Cabinet, 6.6 x 5.8 x 2.0 cm © irocks

Water in moon rocks provides clues and questions about lunar history

This shows secondary electron image of pits left by ion microprobe analyses of a heterogeneous apatite grain in Apollo sample 14321, 1047. Water has now been detected in apatite in many different lunar rock types. Credit: Katharine L. Robinson, University of Hawaii, HIGP

A recent review of hundreds of chemical analyses of Moon rocks indicates that the amount of water in the Moon’s interior varies regionally – revealing clues about how water originated and was redistributed in the Moon. These discoveries provide a new tool to unravel the processes involved in the formation of the Moon, how the lunar crust cooled, and its impact history.
This is not liquid water, but water trapped in volcanic glasses or chemically bound in mineral grains inside lunar rocks. Rocks originating from some areas in the lunar interior contain much more water than rocks from other places. The hydrogen isotopic composition of lunar water also varies from region to region, much more dramatically than in Earth.

The present consensus is that the Moon formed as the result of a giant impact of an approximately Mars-sized planetesimal with the proto-Earth. The water in the Moon is a tracer of the processes that operated in the hot, partly silicate gas, partly magma disk surrounding Earth after that impact.

The source of the Moon’s water has important implications for determining the source of Earth’s water, which is vital to life. There are two options: either, water was inherited by the Moon from the Earth during the Moon-forming impact, or it was added to the Moon later by comets or asteroids. It might also be a combination of these two processes.

“Basically, whatever happened to the Moon also happened to the Earth,” said Katharine Robinson, lead author of the study and Graduate Assistant at the University of Hawai’i – Mānoa (UHM) School of Ocean and Earth Science and Technology.

Robinson and Researcher G. Jeffrey Taylor, both at the UHM Hawai’i Institute of Geophysics and Planetology, compiled water measurements from lunar samples performed by colleagues from around the world, as well as their own. Specifically, they measured hydrogen and its isotope, deuterium (hydrogen with an extra neutron in its nucleus) with ion microprobes, which use a focused beam of ions to sputter ions from a small rock sample into a mass spectrometer. The ratio of hydrogen to deuterium can indicate the source of the water or trace magmatic processes in the lunar interior.

When water was first discovered in lunar samples in 2008, it was very surprising because from the time Apollo astronauts brought lunar samples, scientists thought that the Moon contained virtually no water.

“This was consistent with the idea that blossomed during the Origin of the Moon conference in Kona in 1984 — that the Moon formed by a giant impact with the still-growing Earth, leading to extensive loss of volatile chemicals. Our work is surprising because it shows that lunar formation and accretion were more complex than previously thought,” said Robinson.

The study of water in the Moon is still quite new, and many rocks have not yet been studied for water. The HIGP researchers have a new set of Apollo samples from NASA that they will be studying in the next few months, looking for additional clues about the early life of Earth and the Moon.

Note : The above story is based on materials provided by University of Hawaii ‑ SOEST

What Caused a 1300-Year Deep Freeze?

Bill Whittaker/Iowa Office of the State Archaeologist/Creative Commons

Things were looking up for Earth about 12,800 years ago. The last Ice Age was coming to an end, mammoths and other large mammals romped around North America, and humans were beginning to settle down and cultivate wild plants. Then, suddenly, the planet plunged into a deep freeze, returning to near-glacial temperatures for more than a millennium before getting warm again. The mammoths disappeared at about the same time, as did a major Native American culture that thrived on hunting them. A persistent band of researchers has blamed this apparent disaster on the impact of a comet or asteroid, but a new study concludes that the real explanation for the chill, at least, may lie strictly with Earth-bound events.
The study “pulls the rug out from under the contrived impact hypothesis quite nicely,” says Christian Koeberl, a geochemist at the University of Vienna. Most evidence for the extraterrestrial impact hypothesis, he says, was conjured up “out of thin air.”

The 1300-year big chill is known as the Younger Dryas, so called because of the sudden worldwide appearance of the cold-weather flowering plant Dryas octopetala. A number of causes have been suggested, including changes in ocean currents due to melting glaciers and volcanic activity. In 2007, a diverse group of 26 researchers, led by nuclear chemist Richard Firestone of the Lawrence Berkeley National Laboratory in California, formally proposed what is known as the Younger Dryas impact hypothesis, in which one or more extraterrestrial bodies blew up over North America, leading to widespread wildfires and strewing sun-blocking dust and debris across the globe.

In a series of papers, Firestone and his colleagues claimed various kinds of evidence for the hypothesis, including deposits of the element iridium (rare on Earth but abundant in meteorites), microscopic diamonds (called nanodiamonds), and magnetic particles in deposits at sites supposedly dated to about 12,800 years ago. The notion was popularized in television documentaries and other coverage on the National Geographic Channel, History Channel, and the PBS program NOVA. These claims were sharply contested by some specialists in the relevant fields, however, who either did not detect such evidence or argued that the deposits had other causes than a cosmic impact. For example, some say that nanodiamonds are common in ordinary geological formations, and that magnetic particles could come from ordinary fires.

Now comes what some researchers consider the strongest attack yet on the Younger Dryas impact hypothesis. In a paper published online this week in the Proceedings of the National Academy of Sciences, a team led by David Meltzer, an archaeologist at Southern Methodist University, Dallas, in Texas, looks at the dating of 29 different sites in the Americas, Europe, and the Middle East in which impact advocates have reported evidence for a cosmic collision. They include sites in which sophisticated stone projectiles called Clovis points, used by some of the earliest Americans to hunt mammals beginning about 13,000 years ago, have been found, such as Chobot in Alberta, Canada, Murray Springs in Arizona, and Paw Paw Cove in Maryland; the site of Abu Hureyra in Syria, where evidence of plant-cultivating hunter-gatherers occurs; and sites in Greenland, Germany, Belgium, and the Netherlands where other evidence for an impact has been claimed. The team argues that when the quality and accuracy of the dating—which was based on radiocarbon and other techniques—is examined closely, only three of the 29 sites actually fall within the time frame of the Younger Dryas onset, about 12,800 years ago; the rest were probably either earlier or later by hundreds (and in one case, thousands) of years.

“The supposed Younger Dryas impact fails on both theoretical and empirical grounds,” says Meltzer, who adds that the popular appeal of the hypothesis is probably due to the way that it provides “simple explanations for complex problems.” Thus, “giant chunks of space debris clobbering the planet and wiping out life on Earth has undeniably broad appeal,” Meltzer says, whereas “no one in Hollywood makes movies” about more nuanced explanations, such as Clovis points disappearing because early Americans turned to other forms of stone tool technology as the large mammals they were hunting went extinct as a result of the changing climate or hunting pressure.

Maarten Blaauw, a paleoecologist at Queen’s University Belfast in the United Kingdom, finds the new work convincing. “It is vital to get the ages right,” he says, which “appears to have been lacking in the case of the [impact] papers” that Meltzer and his colleagues reanalyzed. “This paper should be read widely, and its lessons learned by the paleo community and by archaeologists.”

But impact proponents appear unmoved by the new study. “We still stand fully behind the [impact hypothesis], which is based on more than a confluence of dates,” Firestone says. “Radiocarbon dating is a perilous process,” he contends, adding that the presence of Clovis artifacts and mammoth bones just under the claimed iridium, nanodiamond, and magnetic sphere deposits is a more reliable indicator that an extraterrestrial event was responsible for their disappearance.

Note : The above story is based on materials provided by Michael Balter forAmerican Association for the Advancement of Science.

Mcgovernite

McGovernite, Willemite, Franklinite, Calcite Locality: Sterling Mine, Ogdensburg, Sterling Hill, Sussex County, New Jersey (Type Locality for McGovernite and Franklinite) Overall Size:    25x21x16 mm Crystals: 1-3 mm © JohnBetts-FineMinerals

Chemical Formula: Mn19Zn3(AsO4)3(AsO3)(SiO4)3(OH)21
Locality: Sterling Hill, Franklin, Sussex Co., New Jersey, USA.
Name Origin: Named for J. J. McGovern (1915-), Franklin miner and mineral collector.

History

Discovery date : 1927
Town of Origin : MINE STERLING HILL, OGDENSBURG, SUSSEX CO., NEW JERSEY
Country of Origin : USA

Optical properties

Optical and misc. Properties : Translucent
Refractive Index : from 1,75 to 1,76

Physical Properties

Cleavage: {001} Perfect
Color:     Bronze brown, Light brown, Dark reddish brown, Reddish brown.
Density: 3.72
Diaphaneity: Translucent
Fracture: Brittle – Generally displayed by glasses and most non-metallic minerals.
Luminescence: Non-fluorescent.
Luster: Vitreous – Pearly
Streak: brown

Photos :

McGovernite, Willemite, Franklinite, Calcite Locality: Sterling Mine, Ogdensburg, Sterling Hill, Sussex County, New Jersey (Type Locality for McGovernite and Franklinite) Overall Size:    25x21x16 mm Crystals: 1-3 mm © JohnBetts-FineMinerals

Researchers Use Noble Gas Krypton to Precisely Date Antarctic Ice

Top: satellite imagery of Taylor Glacier. Kr-81 sampling locations are indicated as blue dots. Bottom: location of Taylor Glacier on map of Antarctica. Image credit: Christo Buizert et al.

The new technique is much like the more-heralded carbon-14 dating technique that measures the decay of a radioactive isotope and compares it to a stable isotope.

Unlike carbon-14, however, krypton does not interact chemically and is much more stable with a half-life of around 230,000 years.
Carbon dating doesn’t work well on ice because carbon-14 is produced in the ice itself by cosmic rays and only goes back some 50,000 years.

Krypton is produced by cosmic rays bombarding our planet and then stored in air bubbles trapped within ice. It has a radioactive isotope, krypton-81, that decays very slowly, and a stable isotope (krypton-83) that does not decay.


Comparing the proportion of stable-to-radioactive isotopes provides the age of the ice.

In their study, reported in the Proceedings of the National Academy of Sciences, Dr Buizert with colleagues put four 350-kg samples of ice into a container and melted it to release the air from the bubbles. The krypton was isolated from the air and sent for krypton-81 counting.

They determined from the isotope ratio that the Taylor Glacier samples were 120,000 years old, and validated the estimate by comparing the results to well-dated ice core measurements of atmospheric methane and oxygen from that same period.

Now the challenge is to locate some of the oldest ice in Antarctica, which may not be as easy as it sounds.

“Most people assume that it’s a question of just drilling deeper for ice cores, but it’s not that simple. Very old ice probably exists in small isolated patches at the base of the ice sheet that have not yet been identified, but in many places it has probably melted and flowed out into the ocean,” explained co-author Dr Edward Brook of Oregon State University.

The scientists are hoping that the new technique will help identify ice that is more than a million years old, thereby reconstructing climate much farther back into Earth’s history.

“Reconstructing the Earth’s climate back to 1.5 million years is important because a shift in the frequency of ice ages took place in what is known as the Middle Pleistocene transition. The Earth is thought to have shifted in and out of ice ages every 100,000 years or so during the past 800,000 years, but there is evidence that such a shift took place every 40,000 years prior to that time,” Dr Buizert said.

“Why was there a transition from a 40,000-year cycle to a 100,000-year cycle? Some people believe a change in the level of atmospheric carbon dioxide may have played a role. That is one reason we are so anxious to find ice that will take us back further in time so we can further extend data on past carbon dioxide levels and test this hypothesis,” he concluded.

More Information : Christo Buizert et al. Radiometric 81Kr dating identifies 120,000-year-old ice at Taylor Glacier, Antarctica. PNAS, published online April 21, 2014; doi: 10.1073/pnas.1320329111

Note : The above story is based on materials provided by  Sci-News

Related Articles