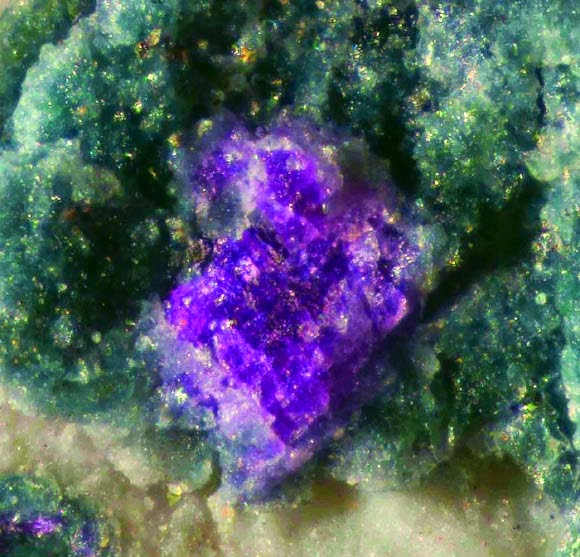
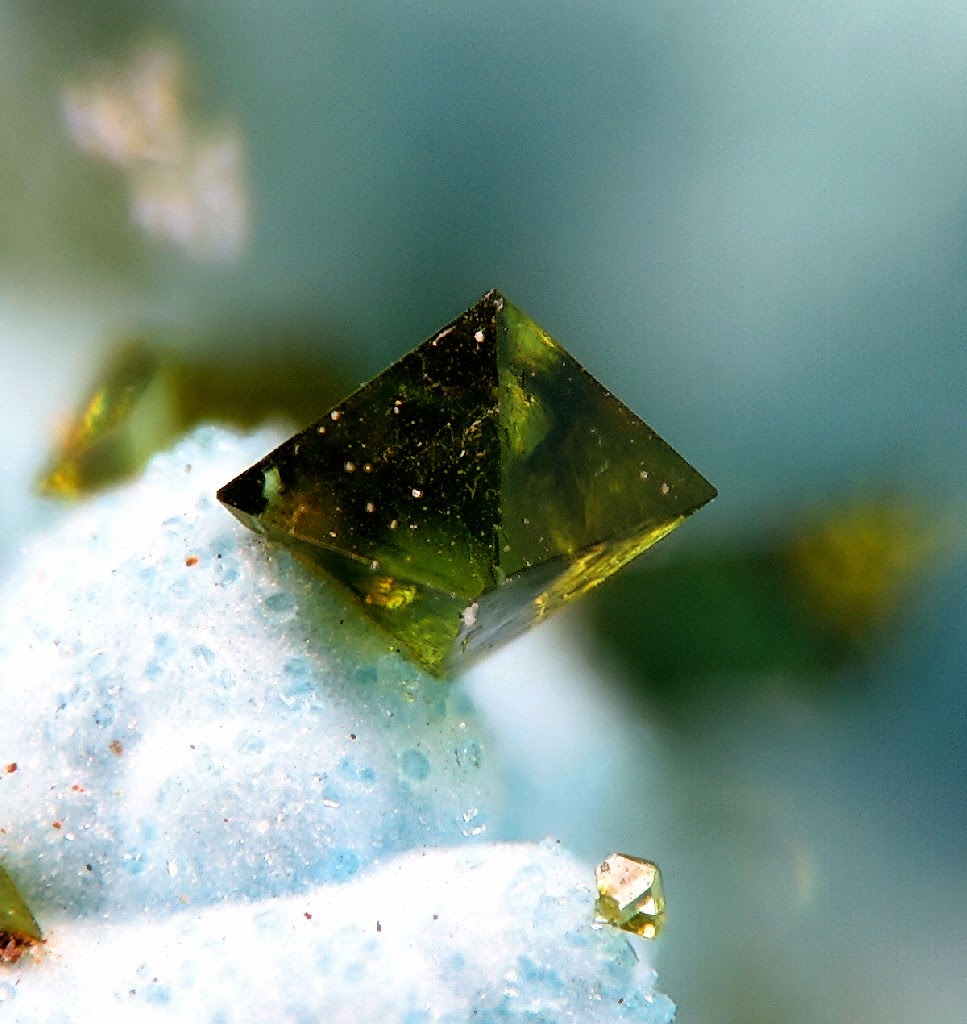
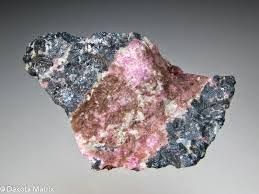
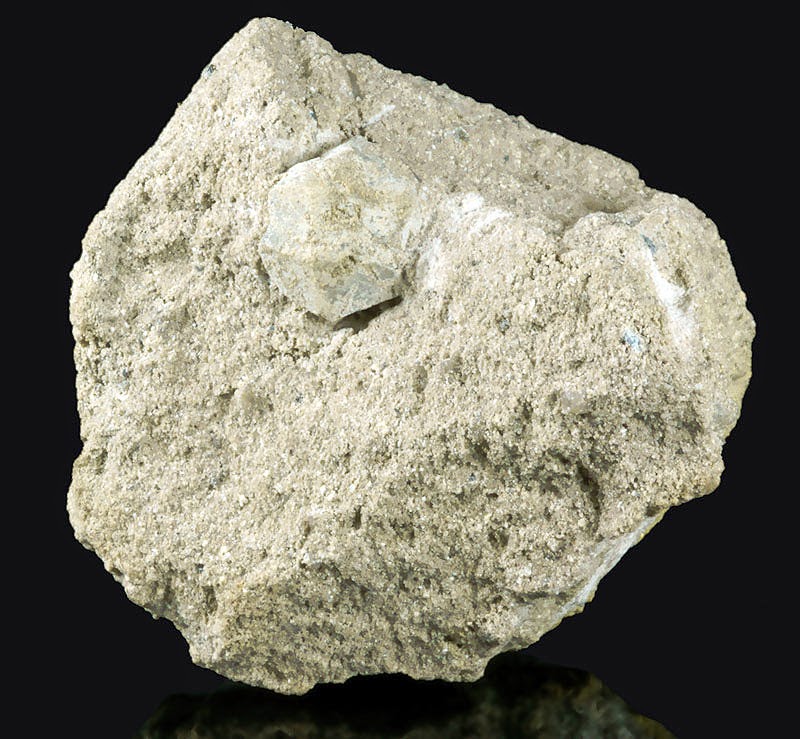
Crystals of putnisite (purple) . Image credit: P. Elliott et al.
The new mineral is named putnisite after Drs Christine and Andrew Putnis from the University of Münster, Germany, for their outstanding contributions to mineralogy.
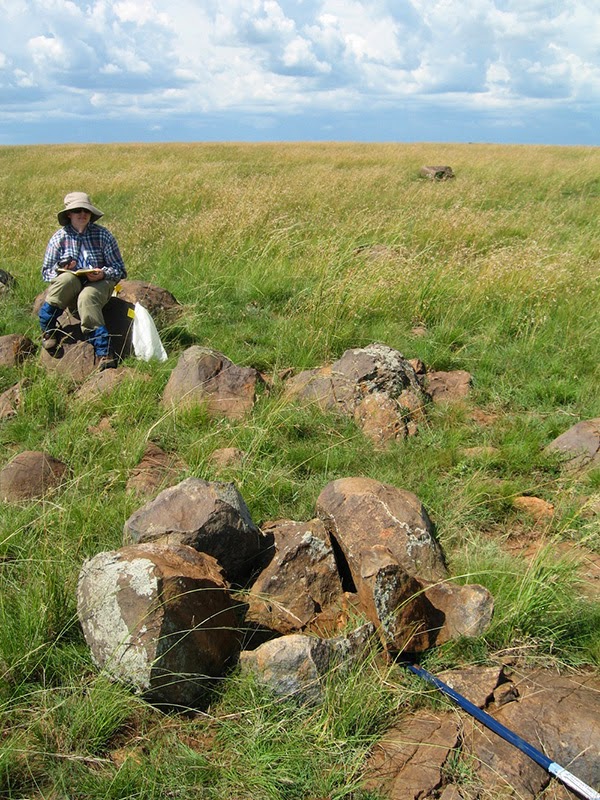
Putnisite occurs as isolated pseudocubic crystals, up to 0.5 mm in diameter, and is associated with quartz and a near amorphous Cr silicate.
It is translucent, with a pink streak and vitreous lustre. It is brittle and shows one excellent and two good cleavages parallel to {100}, {010} and {001}.
“What defines a mineral is its chemistry and crystallography. By x-raying a single crystal of mineral you are able to determine its crystal structure and this, in conjunction with chemical analysis, tells you everything you need to know about the mineral,” explained Dr Elliott, who, along with colleagues, described putnisite in the Mineralogical Magazine.
“Most minerals belong to a family or small group of related minerals, or if they aren’t related to other minerals they often are to a synthetic compound – but putnisite is completely unique and unrelated to anything.”
Putnisite combines the elements strontium, calcium, chromium, sulfur, carbon, oxygen and hydrogen: SrCa4Cr83+(CO3)8SO4(OH)16•25H2O
The mineral has a Mohs hardness of 1.5–2, a measured density of 2.20 g/cm3 and a calculated density of 2.23 g/cm3. It was discovered during prospecting by a mining company in Western Australia.
“Nature seems to be far cleverer at dreaming up new chemicals than any researcher in a laboratory,” Dr Elliott concluded.
Reference::
P. Elliott et al. 2014. Putnisite, SrCa4Cr83+(CO3)8SO4(OH)16•25H2O, a new mineral from Western Australia: description and crystal structure. Mineralogical Magazine, vol. 78, no. 1, pp. 131-144; DOI: 10.1180/minmag.2014.078.1.10
Note : The above story is based on materials provided by Natali Anderson.
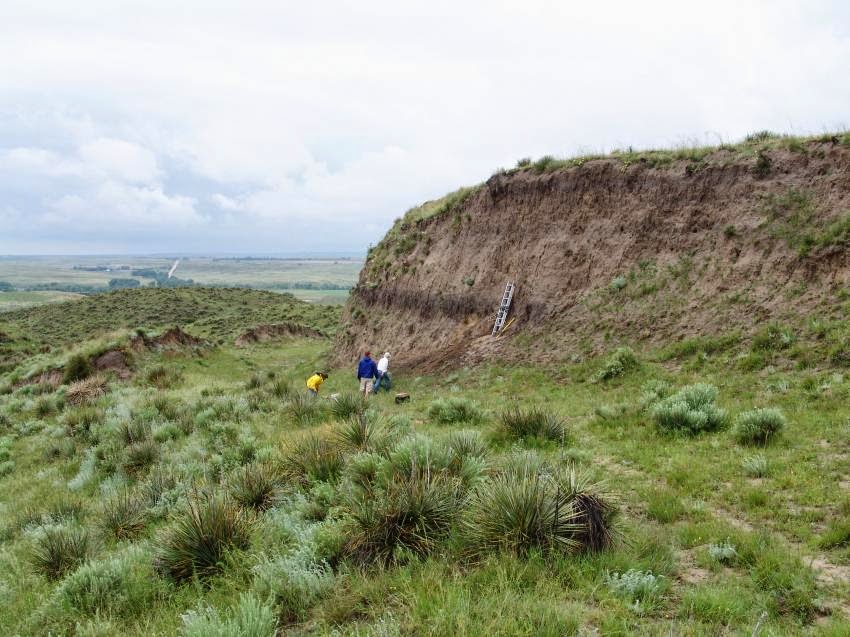
Image showing the remnants of a crater that UAlberta researchers theorize was left by a massive meteorite strike sometime in the last 70 million years. Colour variation shows metres above sea level.
The discovery of an ancient ring-like structure in southern Alberta suggests the area was struck by a meteorite large enough to leave an eight-kilometre-wide crater, producing an explosion strong enough to destroy present-day Calgary, say researchers from the Alberta Geological Survey and University of Alberta.
The first hints about the impact site near the southern Alberta hamlet of Bow City were discovered by a geologist with the Alberta Geological Survey and studied by a U of A team led by Doug Schmitt, Canada Research Chair in Rock Physics.
Time and glaciers have buried and eroded much of the evidence, making it impossible at this point to say with full certainty the ring-like structure was caused by a hypervelocity meteorite impact, but that’s what seismic and geological evidence strongly suggests, said Schmitt, a professor in the Faculty of Science and co-author of a new paper about the discovery.
“We know that the impact occurred within the last 70 million years, and in that time about 1.5 km of sediment has been eroded. That makes it really hard to pin down and actually date the impact.”
Erosion has worn away all but the “roots” of the crater, leaving a semicircular depression eight kilometres across with a central peak. Schmitt says that when it formed, the crater likely reached a depth of 1.6 to 2.4 km—the kind of impact his graduate student Wei Xie calculated would have had devastating consequences for life in the area.
“An impact of this magnitude would kill everything for quite a distance,” he said. “If it happened today, Calgary (200 km to the northwest) would be completely fried and in Edmonton (500 km northwest), every window would have been blown out. Something of that size, throwing that much debris in the air, potentially would have global consequences; there could have been ramifications for decades.”
The impact site was first discovered in 2009 by geologist Paul Glombick, who at the time was working on a geological map of the area for the Alberta Geological Survey, focusing on the shallow subsurface, between zero and 500 metres in depth. Glombick relied on existing geophysical log data from the oil and gas industry when he discovered a bowl-shaped structure. After checking maps of the area dating back to the 1940s, he found evidence of faulting at the surface.
The Alberta Geological Survey contacted the U of A and Schmitt to explore further, peeking into the earth by analyzing seismic data donated by industry. Schmitt’s student, Todd Brown, later confirmed a crater-like structure.
For Glombick, who earned his bachelor’s degree and PhD in geology from the U of A, contributing to such a historic find was a “pretty cool” departure from his regular duties of mapping rock and layers in the shallow subsurface.
“It’s exciting to come across a structure like this. It highlights there’s still a fair amount of unknowns in the shallow subsurface,” he said, noting the oil and gas industry’s geological interests focus deeper underground. “It’s nice to be able to contribute something to the geology of Alberta.”
The research team’s paper about the discovery was published in the journal Meteoritics & Planetary Science in an early online release.
Map:
Note : The above story is based on materials provided by University of Alberta
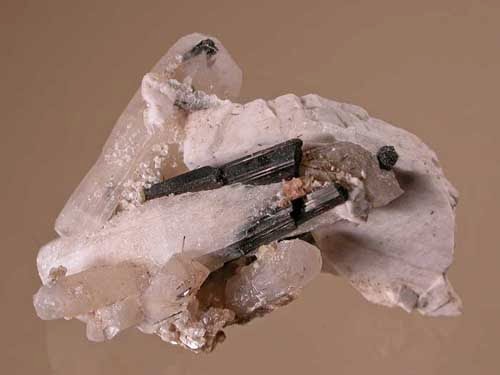
Chemical Formula: Co2+Co3+2S4 Locality: Bastnäs mines, Riddarhyttan, Västmanland, Sweden. Name Origin: Named after the Swedish botanist, C. Linne (1707-1778).Linnaeite is a cobalt sulfide mineral with the composition Co2+Co3+2S4. It was discovered in 1845 in Västmanland, Sweden, and was named to honor Carl Linnaeus (1707–1778).Linnaeite forms a series with polydymite, Ni+2Ni+32S4. Linnaeite is found in hydrothermal veins with other cobalt and nickel sulfides in many localities around the world
History
Discovery date : 1845 Town of Origin : MINE BASTNAS, RIDDERHYTTAN Country of Origin: SUEDE
Optical properties
Optical and misc. Properties : Opaque Reflective Power: 44,7% (580)
An eroding bluff on the US Great Plains reveals a buried, carbon-rich layer of fossil soil. A team of researchers led by UW-Madison Assistant Professor of geography Erika Marin-Spiotta has found that buried fossil soils contain significant amounts of carbon and could contribute to climate change as the carbon is released through human activities such as mining, agriculutre and deforestation. Credit: Jospeh Mason
Soils that formed on the Earth’s surface thousands of years ago and that are now deeply buried features of vanished landscapes have been found to be rich in carbon, adding a new dimension to our planet’s carbon cycle.
The finding, reported today in the journal Nature Geoscience, is significant as it suggests that deep soils can contain long-buried stocks of organic carbon which could, through erosion, agriculture, deforestation, mining and other human activities, contribute to global climate change.
“There is a lot of carbon at depths where nobody is measuring,” says Erika Marin-Spiotta, a University of Wisconsin-Madison assistant professor of geography and the lead author of the new study. “It was assumed that there was little carbon in deeper soils. Most studies are done in only the top 30 centimeters. Our study is showing that we are potentially grossly underestimating carbon in soils.”
The soil studied by Marin-Spiotta and her colleagues, known as the Brady soil, formed between 15,000 and 13,500 years ago in what is now Nebraska, Kansas and other parts of the Great Plains. It lies up to six-and-a- half meters below the present-day surface and was buried by a vast accumulation of windborne dust known as loess beginning about 10,000 years ago, when the glaciers that covered much of North America began to retreat.
The region where the Brady soil formed was not glaciated, but underwent radical change as the Northern Hemisphere’s retreating glaciers sparked an abrupt shift in climate, including changes in vegetation and a regime of wildfire that contributed to carbon sequestration as the soil was rapidly buried by accumulating loess.
“Most of the carbon (in the Brady soil) was fire derived or black carbon,” notes Marin-Spiotta, whose team employed an array of new analytical methods, including spectroscopic and isotopic analyses, to parse the soil and its chemistry. “It looks like there was an incredible amount of fire.”
The team led by Marin-Spiotta also found organic matter from ancient plants that, thanks to the thick blanket of loess, had not fully decomposed. Rapid burial helped isolate the soil from biological processes that would ordinarily break down carbon in the soil.
Such buried soils, according to UW-Madison geography Professor and study co-author Joseph Mason, are not unique to the Great Plains and occur worldwide.
The work suggests that fossil organic carbon in buried soils is widespread and, as humans increasingly disturb landscapes through a variety of activities, a potential contributor to climate change as carbon that had been locked away for thousands of years in arid and semiarid environments is reintroduced to the environment.
The element carbon comes in many forms and cycles through the environment – land, sea and atmosphere – just as water in various forms cycles through the ground, oceans and the air. Scientists have long known about the carbon storage capacity of soils, the potential for carbon sequestration, and that carbon in soil can be released to the atmosphere through microbial decomposition.
The deeply buried soil studied by Marin-Spiotta, Mason and their colleagues, a one-meter-thick ribbon of dark soil far below the modern surface, is a time capsule of a past environment, the researchers explain. It provides a snapshot of an environment undergoing significant change due to a shifting climate. The retreat of the glaciers signaled a warming world, and likely contributed to a changing environment by setting the stage for an increased regime of wildfire.
“The world was getting warmer during the time the Brady soil formed,” says Mason. “Warm-season prairie grasses were increasing and their expansion on the landscape was almost certainly related to rising temperatures.”
The retreat of the glaciers also set in motion an era when loess began to cover large swaths of the ancient landscape. Essentially dust, loess deposits can be thick—more than 50 meters deep in parts of the Midwestern United States and areas of China. It blankets large areas, covering hundreds of square kilometers in meters of sediment.
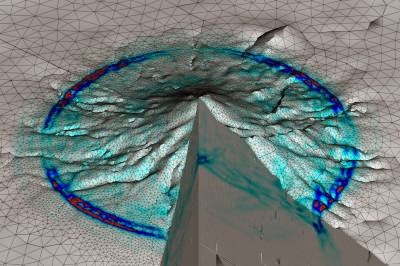
This shows a visualization of vibrations inside the Merapi volcano (island of Java) computed with the earthquake simulation software SeisSol. Credit: Alex Breuer (TUM) / Christian Pelties (LMU)
Geophysicists use the SeisSol earthquake simulation software to investigate rupture processes and seismic waves beneath the Earth’s surface. Their goal is to simulate earthquakes as accurately as possible to be better prepared for future events and to better understand the fundamental underlying mechanisms. However, the calculations involved in this kind of simulation are so complex that they push even super computers to their limits.
In a collaborative effort, the workgroups led by Dr. Christian Pelties at the Department of Geo and Environmental Sciences at LMU and Professor Michael Bader at the Department of Informatics at TUM have optimized the SeisSol program for the parallel architecture of the Garching supercomputer “SuperMUC”, thereby speeding up calculations by a factor of five.
Using a virtual experiment they achieved a new record on the SuperMUC: To simulate the vibrations inside the geometrically complex Merapi volcano on the island of Java, the supercomputer executed 1.09 quadrillion floating point operations per second. SeisSol maintained this unusually high performance level throughout the entire three hour simulation run using all of SuperMUC’s 147,456 processor cores.
Complete parallelization
This was possible only following the extensive optimization and the complete parallelization of the 70,000 lines of SeisSol code, allowing a peak performance of up to 1.42 petaflops. This corresponds to 44.5 percent of Super MUC’s theoretically available capacity, making SeisSol one of the most efficient simulation programs of its kind worldwide.
“Thanks to the extreme performance now achievable, we can run five times as many models or models that are five times as large to achieve significantly more accurate results. Our simulations are thus inching ever closer to reality,” says the geophysicist Dr. Christian Pelties. “This will allow us to better understand many fundamental mechanisms of earthquakes and hopefully be better prepared for future events.”
The next steps are earthquake simulations that include rupture processes on the meter scale as well as the resultant destructive seismic waves that propagate across hundreds of kilometers. The results will improve the understanding of earthquakes and allow a better assessment of potential future events.
“Speeding up the simulation software by a factor of five is not only an important step for geophysical research,” says Professor Michael Bader of the Department of Informatics at TUM. “We are, at the same time, preparing the applied methodologies and software packages for the next generation of supercomputers that will routinely host the respective simulations for diverse geoscience applications.”
Note : The above story is based on materials provided by Technische Universitaet Muenchen
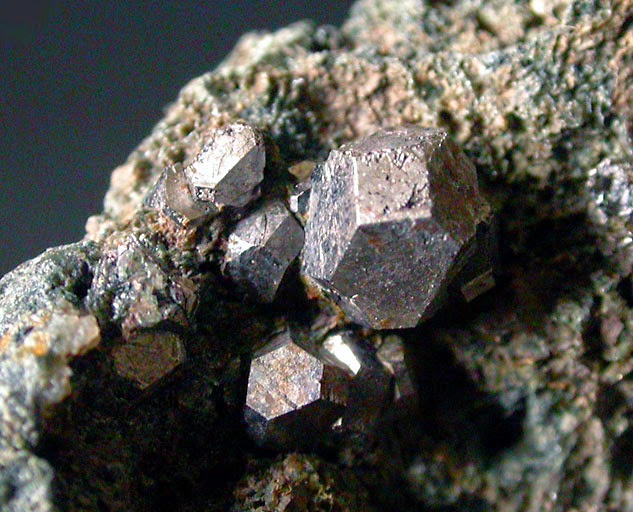
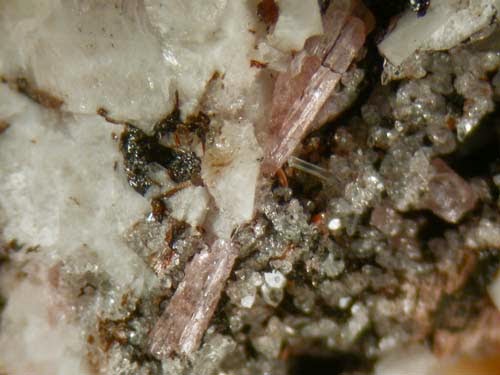
Chemical Formula: Cu2(PO4)(OH) Locality: Lubietova (German Livethen), Czechoslovakia. Name Origin: Named after its locality.
Libethenite is a rare copper phosphate hydroxide mineral. It forms striking, dark green orthorhombic crystals. It was discovered in 1823 in Ľubietová, Slovakia and is named after the German name of that locality (Libethen).
History
Discovery date : 1823 Town of Origin : L’UBIETOVA (LIBETBANYA) STREDOSLOVENSKY KRAJ Country of Origin : SLOVAQUIE
Optical properties
Optical and misc. Properties : Translucent to subtranslucent Refractive Index : from 1,70 to 1,78 Axial angle 2V : ~90°
Physical Properties
Cleavage: {100} Indistinct, {010} Indistinct Color: Green, Dark green, Blackish green, Light olive green, Dark olive green. Density: 3.6 – 4, Average = 3.8 Diaphaneity: Translucent to subtranslucent Fracture: Brittle – Generally displayed by glasses and most non-metallic minerals. Hardness: 4 – Fluorite Luminescence: Non-fluorescent. Luster: Vitreous – Greasy Streak: light green
GEOMAR researchers specify models for the birth of the youngest world ocean
Pacific, Atlantic and Indian Ocean, with the land masses of the Americas, Europe, Asia, Africa and Australia in between – that’s how we know our earth. From a geologist’s point of view, however, this is only a snapshot. Over the course of the earth’s history, many different continents have formed and split again. In between oceans were created, new seafloor was formed and disappeared again: Plate tectonics is the generic term for these processes.
The Red Sea, where currently the Arabian Peninsula separates from Africa, is one of the few places on earth where the splitting of a continent and the emergence of the ocean can be observed. During a three-year joint project, the Jeddah Transect Project (JTP), researchers at the GEOMAR Helmholtz Centre for Ocean Research Kiel and the King Abdulaziz University (KAU) in Jeddah, Saudi Arabia, have taken a close look at this crack in the earth’s crust by means of seabed mapping, sampling and magnetic modeling. “The findings have shed new light on the early stages of oceanic basins, and they specifically change the school of thought on the Red Sea,” says Dr. Nico Augustin from GEOMAR, lead author of the study. It has now been published in the scientific journal “Earth and Planetary Science Letters”.
It is, and was, undisputed that a continent is stretched and thinned out by volcanic activity before it ruptures and a new ocean basin is formed. The rifting occurs where the greatest stretching takes place. However, the detailed processes during the break-up are debated in research. On the one hand, one needs to better understand the dynamics of our home planet. “On the other hand, most marine oil and gas resources are located near such former fracture zones. This research can therefore also have economic and political implications,” says Professor Colin Devey (GEOMAR), co-author of the study.
Until now, conventional knowledge said that a continent is breaking apart more or less simultaneously along an entire line, and the ocean basin is formed all at once. The Red Sea, however, did not fit into this picture. Here, a model was favored with several smaller fracture zones, lined up one after the other, that would unite gradually, which in turn would lead to a relatively slow emergence of the ocean during a long transition phase. “Our studies show that the Red Sea is not an exception but that it takes its place in line with the other ocean basins,” says Augustin. The previous picture we had of the ocean floor in the Red Sea was simply corrupted by salt glaciers. “The volcanic rocks we recovered are similar to those from other normal mid-ocean ridges,” says co-author Froukje van der Zwan, working on her PhD as part of the JTP.
During the early formation stages of the Red Sea, the area was covered by a very shallow sea that dried up repeatedly. This created thick salt deposits that later on broke apart with the continental crust. Over geologic time periods, salt shows tar-like behavior and begins to flow. “Our new high-resolution seabed maps and magnetic modeling show that the kilometer-thick salt deposits, after the break-up of the Arabian Plate from Africa, flowed like glaciers toward the newly created trench and thus over the oceanic crust due to gravity,” says Augustin. Since these submarine salt glaciers do not cover the rifting zone uniformly over the entire length, the impression of several small fracture zones was created.
The consequences of this discovery are profound: For one, there really seems to be only one single mechanism worldwide for the dispersal of a continent. And secondly, is not yet known how much ocean crust is covered by salt. This questions the previous dating of the opening of the Red Sea. In addition, the volcanically active trench rift zone of the Red Sea, surrounded by salt glaciers, is host of a giant sink filled with a very hot and very salty solution. “Since the sediment in the salt solution is rich in metals, this so-called Atlantis II Deep is also of economic interest,” says co-author Devey. It is quite conceivable that over the course of the earth’s history similar deposits associated with volcanism and salt deposits were created during the opening phase of other oceans. “Thus, our studies help to clarify older research questions. But they also provide starting points for new investigations in all of the oceans,” says Augustin.
Original publication:
Augustin, N., C. W. Devey, F. M. van der Zwan, Peter Feldens, M. Tominaga, R. A. Bantan, T. Kwasnitschka (2014): The rifting to spreading transition in the Red Sea. Earth and Planetary Science Letters, 395, http://dx.doi.org/10.1016/j.epsl.2014.03.047
Note : The above story is based on materials provided by Helmholtz Centre for Ocean Research Kiel (GEOMAR)
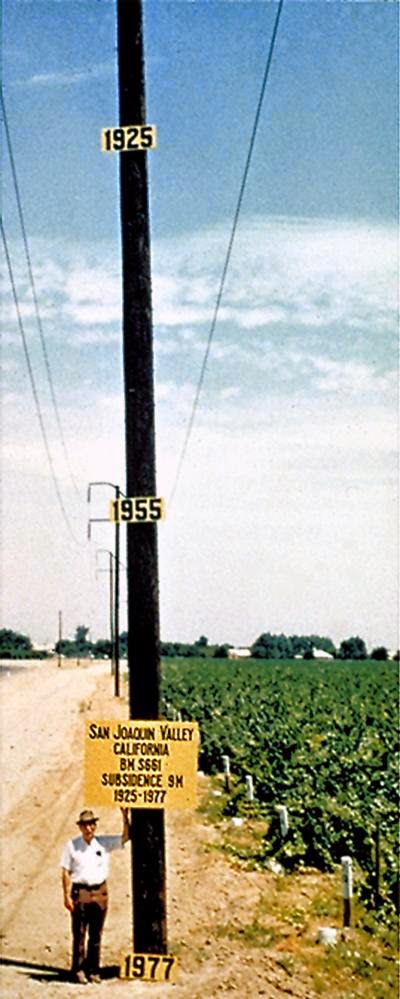
This photo shows the approximate location of maximum subsidence in the United States, identified by research efforts of Dr. Joseph F. Poland (pictured). The site is in the San Joaquin Valley southwest of Mendota, Calif. Signs on the pole show approximate altitude of land surface in 1925, 1955, and 1977. Scientists have now found that the groundwater depletion has contributed to rapid uplift of the Sierra Nevada mountains and the California Coast Range as well as affected seismic activity on the San Andreas Fault. Credit: Photo Courtesy USGS.
RENO, Nev. – Like a detective story with twists and turns in the plot, scientists at the University of Nevada, Reno are unfolding a story about the rapid uplift of the famous 400-mile long Sierra Nevada mountain range of California and Nevada.
The newest chapter of the research is being published today in the scientific journal Nature, showing that draining of the aquifer for agricultural irrigation in California’s Central Valley results in upward flexing of the earth’s surface and the surrounding mountains due to the loss of mass within the valley. The groundwater subsidence was found to also correlate with seismic activity on the San Andreas Fault.
University of Nevada, Reno Research Professor Geoff Blewitt also told the story in a presentation at the European Geophysical Sciences Union conference in Vienna, Austria on April 28. The annual EGU General Assembly is the largest and most prominent European geosciences event. It attracts over 11,000 scientists from all over the world.
“We first wrote two years ago about the rapid rise of the Sierra, with its 14,000-foot peaks in the south and 10,000-foot peaks at Lake Tahoe, moving as much as 1 to 3 millimeters per year,” said Blewitt, of the Nevada Bureau of Mines and Geology, a division of the College of Science. “The puzzling results of our earlier research cannot be explained easily by geology alone. We’ve now found that a reason for the rapid uplift may be linked to human activity.”
Over the past 150 years, around 40 trillion gallons of groundwater in California’s Central Valley has been lost through pumping, irrigation and evapotranspiration. That’s roughly equal to all the water in Lake Tahoe, the volume of which can cover the entire state of California in 14 inches of water.
“This massive withdrawal of water has relieved pressure on the Earth’s crust, which is now rebounding upwards in response,” Blewitt said. “This is counter-intuitive to most people, even geologists, who tend to only think that water withdrawal causes subsidence, which is only true in the sediments of the valley from which the water is withdrawn. With the weight of the groundwater missing, the hard-rock crust under the valley is actually rising too.”
The rise is quite fast in geologic time, with these mountain ranges rising by a similar amount each year – about the thickness of a dime – with a cumulative rise over the past 150 years of up to 6 inches, according to the calculations by the team of geophysicists.
Blewitt and colleague Bill Hammond, who run the Nevada Geodetic Laboratory at the University of Nevada, Reno, partnered with the University of Western Washington, the University of California, Berkeley and the University of Ottawa in the research.
“The real importance of this research is that we are demonstrating a potential link between human activity and deformation of the solid Earth, which explains current mountain uplift and the yearly variation in seismicity,” said Colin Amos, assistant professor of geology from Western Washington University and lead author of the Nature article. “These are questions that lots of geologists have been puzzling over, and it’s a real eye opener to think that humans are the ultimate cause.”
The study is based on detailed GPS measurements from California and Nevada between 2007 and 2010. Also working on the study were Pascal Audet of the University of Ottawa and Roland Bürgmann, professor of earth and planetary science at the University of California, Berkeley. The detailed GPS analysis was performed by Hammond and Blewitt with support from the National Science Foundation.
Hammond and Blewitt use data from their Nevada Geodetic Lab and its MAGNET GPS Network, the largest GPS data-processing center in the world, able to process information from about 12,000 stations around the globe continuously, 24/7. The facility measures the shape of the Earth every day using data drawn in from the global network with stations on every continent around the planet, including more than 1,200 stations from the NSF EarthScope Plate Boundary Observatory, as well as stations in space. The space-based radar data comes from the European Space Agency with support from NASA.
“We can sense the long-term flexing of the crust that accompanies trends in climate and related seasonal changes in the Earth’s surface that track yearly precipitation,” Hammond said. “The processing facility at the Nevada Geodetic Laboratory makes it possible to interpret trends in over 500 locations in southern California, needed to measure the centimeter-scale changes these loads produce. It makes it possible for scientists to connect climatic changes to subsidence patterns and the rate of earthquake occurrence.”
“The data is like a gold mine, we keep digging for new discoveries,” he said. “Scientists around the world use it extensively for research such as modeling earthquakes and volcanoes.”
Note : The above story is based on materials provided by University of Nevada, Reno
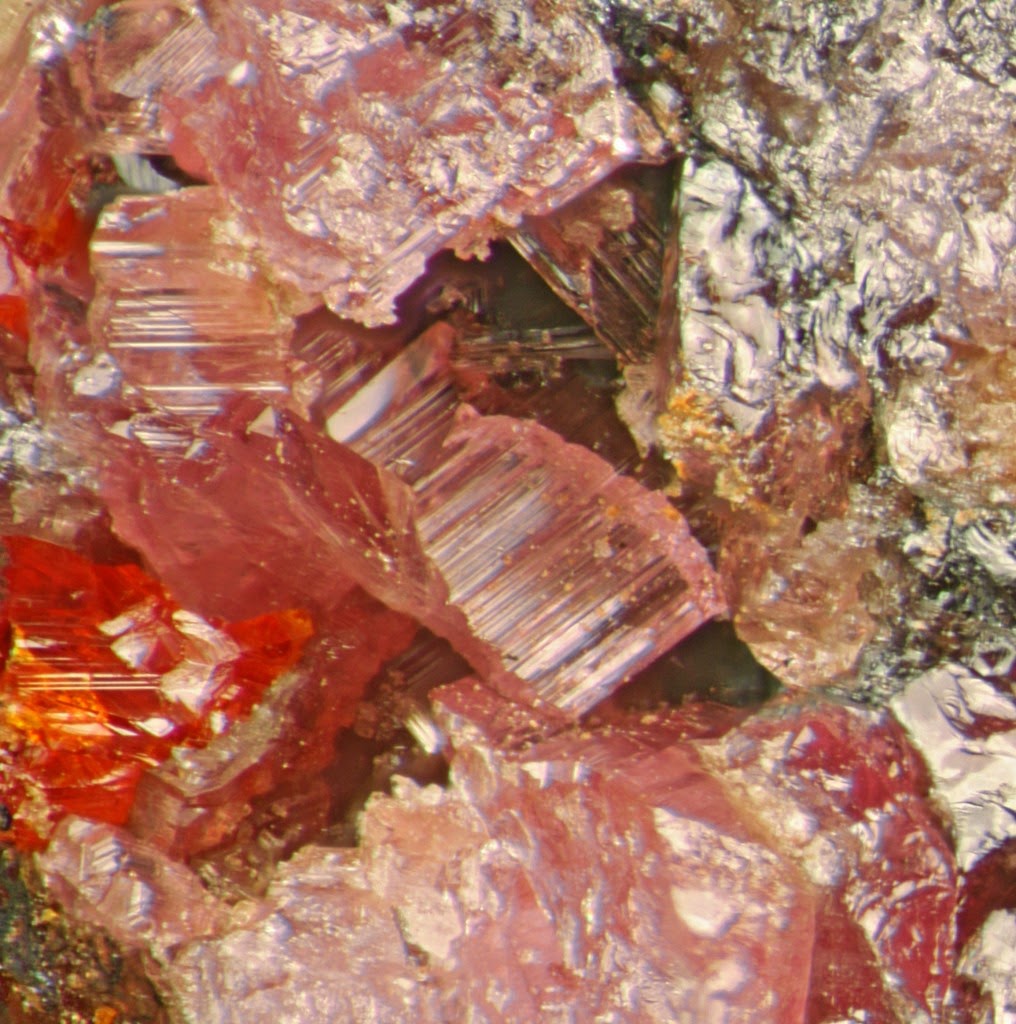
Chemical Formula: Mn7(SiO4)3(OH)2 Locality: Franklin, Sussex Co., New Jersey. Name Origin: From the Greek leukos, “pale” and foinis, “red purple”, in allusion to its color
Leucophoenicite is a mineral with formula Mn7(SiO4)3(OH)2. Generally brown to red or pink in color, the mineral gets its name from the Greek words meaning “pale purple-red”. Leucophoenicite was discovered in the U.S. State of New Jersey and identified as a new mineral in 1899.
Description
Leucophoenicite is normally brown, light purple-red, raspberry-red or pink in color; in thin section it is rose-red to colorless. The name is derived from the Greek words leukos, meaning “pale”, and foinis, meaning “purple-red”, in reference to its common coloring.
Leucophoenicite typically occurs as isolated grains or it has granular massive habit. Crystals of the mineral, which occur rarely, are slender, prismatic, elongated, and striated. The mineral forms in a low pressure, hydrothermal environment or in a contact zone in the veins and skarns of a stratiform Zn-Mn ore body.
Leucophoenicite is a member of the humite group. It has been found in association with barite, barysilite, calcite, copper, franklinite, garnet, glaucochroite, hausmannite, jerrygibbsite, manganosite, pyrochroite, rhodochrosite, sonolite, spessartine, sussexite, tephroite, vesuvianite, willemite, and zincite.
History
Discovery date : 1899 Town of Origin : FRANKLIN, SUSSEX CO., NEW JERSEY Country of Origin: USA
Optical properties
Optical and misc. Properties: Transparent to translucent Refractive Index : from 1,75 to 1,78 Axial angle 2V : 74,5°
Physical Properties
Cleavage: {001} Indistinct Color: Brown, Brown, Violet red, Light red, Dark pink. Density: 3.8 Diaphaneity: Transparent to translucent Fracture: Brittle – Generally displayed by glasses and most non-metallic minerals. Hardness: 5.5-6 – Knife Blade-Orthoclase Luminescence: Non-fluorescent. Luster: Vitreous (Glassy) Magnetism: Nonmagnetic
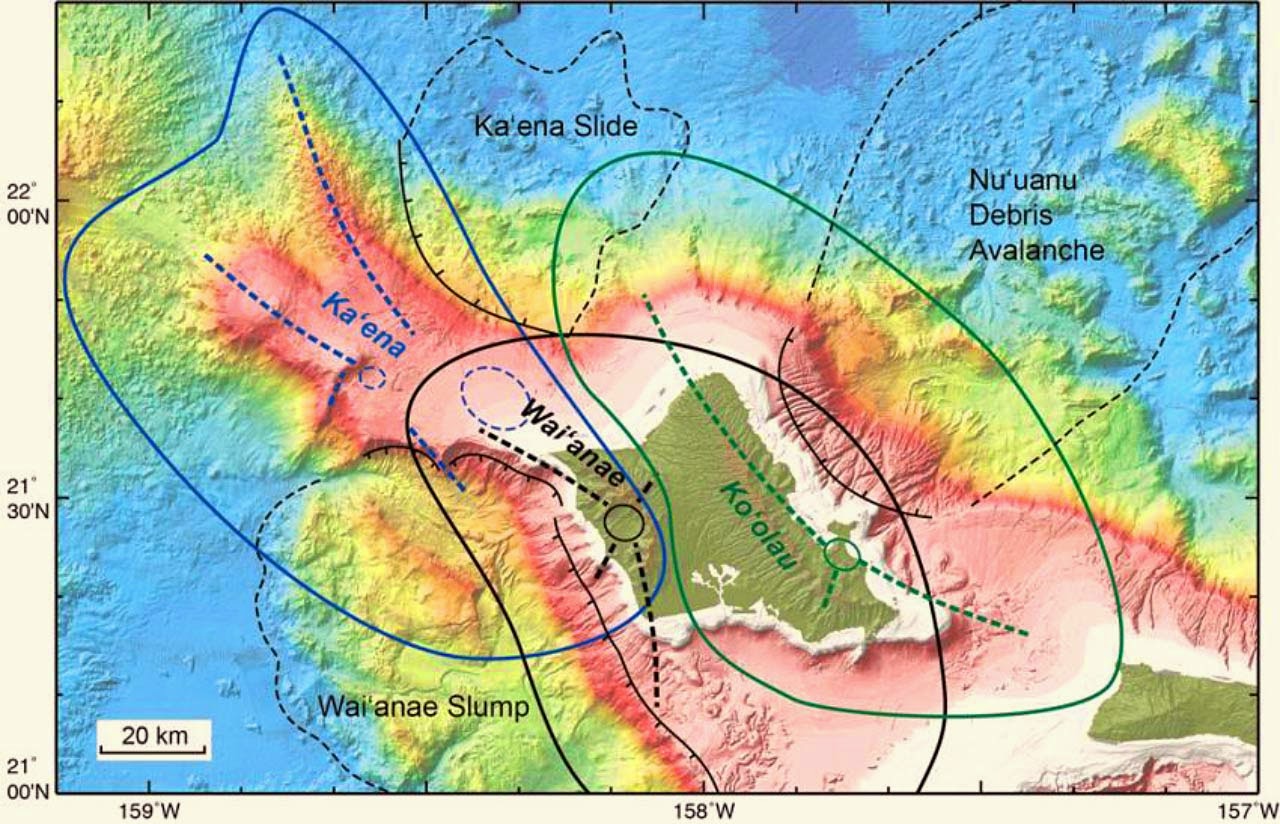
This map shows the distribution of the three volcanoes – the Ka’ena, Wai’anae and Ko’olau – now thought to have made up the region of O’ahu, Hawai’i. Bold dashed lines delineate possible rift zones of the three volcanoes; also shown are the major landslide deposits around O’ahu. Image credit: J. Sinton et al / University of Hawai’i’s School of Ocean and Earth Science and Technology.
As we know it today, O’ahu is the remnants of two volcanoes, Wai’anae and Ko’olau. But extending almost 100 km from the western tip of this island is a large region of shallow bathymetry called the submarine Ka’ena Ridge.
It is that region that has now been recognized to represent a precursor volcano to the island of O’ahu, and on whose flanks the Wai’anae and Ko’olau volcanoes later formed.
Prior to the recognition of Ka’ena Volcano, Wai’anae Volcano was assumed to have been exceptionally large and to have formed an unusually large distance from its next oldest neighbor – Kaua’i.
Prof John Sinton of the University of Hawai’i’s School of Ocean and Earth Science and Technology, who is the lead author of a paper published in the Geological Society of America Bulletin, explained: “both of these assumptions can now be revised: Wai’anae is not as large as previously thought and Ka’ena Volcano formed in the region between Kauai and Wai’anae.”
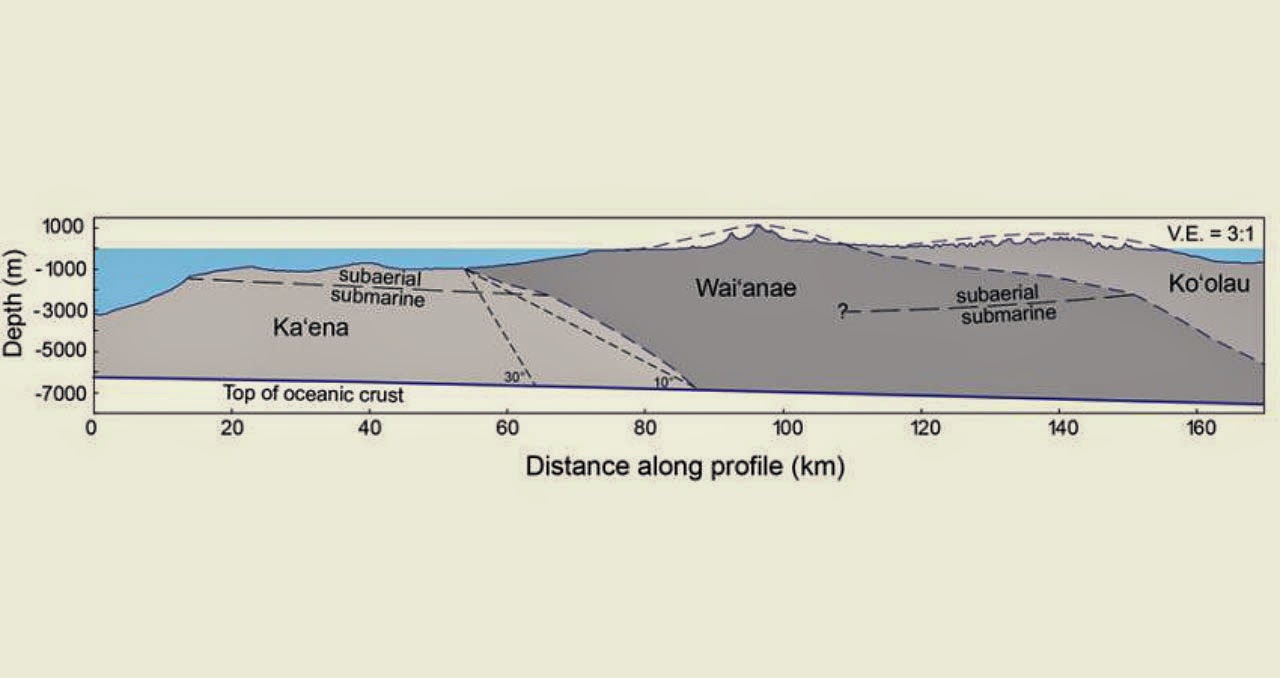
This image shows how Ka’ena, Wai’anae and Ko’olau overlap. Image credit: J. Sinton et al / University of Hawai’i’s School of Ocean and Earth Science and Technology.
In 2010 scientists documented enigmatic chemistry of some unusual lavas of Wai’anae.
“We previously knew that they formed by partial melting of the crust beneath Wai’anae, but we didn’t understand why they have the isotopic composition that they do. Now, we realize that the deep crust that melted under Waianae is actually part of the earlier Ka’ena Volcano,” Prof Sinton said.
The high-quality bathymetric data showed that Ka’ena Ridge had an unusual morphology.
Prof Sinton’s team then began collecting samples from Ka’ena and Wai’alu submarine Ridges.
The geochemical and age data, along with geological observations and geophysical data confirmed that Ka’ena was not part of Waianae, but rather was an earlier volcanic edifice. Wai’anae must have been built on the flanks of Ka’ena.
“What is particularly interesting is that Ka’ena appears to have had an unusually prolonged history as a submarine volcano, only breaching the ocean surface very late in its history,” Prof Sinton said.
Note : The above story is based on materials provided by GSA Release No. 14-35
The Mackenzie River (Slavey language: Deh-Cho, big river or Inuvialuktun: Kuukpak, great river) is the largest and longest river system in Canada, and is exceeded only by the Mississippi River system in North America. It flows through a vast, isolated region of forest and tundra entirely within the country’s Northwest Territories, although its many tributaries reach into four other Canadian provinces and territories. The river’s mainstem runs 1,738 kilometres (1,080 mi) in a northerly direction to the Arctic Ocean, draining a vast area nearly the size of Indonesia. It is the largest river flowing into the Arctic from North America, and with its tributaries is one of the longest rivers in the world.
Course
Rising out of the marshy western end of Great Slave Lake, the Mackenzie River flows generally west-northwest for about 300 km (190 mi), passing the hamlets of Fort Providence and Brownings Landing. At Fort Simpson it is joined by the Liard River, its largest tributary, then swings towards the Arctic, paralleling the Franklin Mountains as it receives the North Nahanni River. The Keele River enters from the left about 100 km (62 mi) above Tulita, where the Great Bear River joins the Mackenzie. Just before crossing the Arctic Circle, the river passes Norman Wells, then continues northwest to merge with the Arctic Red and Peel rivers. It finally empties into the Beaufort Sea, part of the Arctic Ocean, through the vast Mackenzie Delta.
Most of the Mackenzie River is a broad, slow-moving waterway; its elevation drops just 156 metres (512 ft) from source to mouth. It is a braided river for much of its length, characterized by numerous sandbars and side channels. The river ranges from 2 to 5 km (1.2 to 3.1 mi) wide and 8 to 9 m (26 to 30 ft) deep in most parts, and is thus easily navigable except when it freezes over in the winter. However, there are several spots where the river narrows to less than half a kilometre (0.3 mi) and flows quickly, such as at the Sans Sault Rapids at the confluence of the Mountain River and “The Ramparts”, a 40 m (130 ft) deep canyon south of Fort Good Hope.
Watershed
At 1,805,200 square kilometres (697,000 sq mi), the Mackenzie River’s watershed or drainage basin is the largest in Canada, encompassing nearly 20% of the country. From its farthest headwaters at Thutade Lake in the Omineca Mountains to its mouth, the Mackenzie stretches for 4,241 km (2,635 mi) across western Canada, making it the longest river system in the nation and the thirteenth longest in the world. The river discharges more than 325 cubic kilometres (78 cu mi) of water each year, accounting for roughly 11% of the total river flow into the Arctic Ocean. The Mackenzie’s outflow holds a major role in the local climate above the Arctic Ocean with large amounts of warmer fresh water mixing with the cold seawater.
Satellite view of the lower Mackenzie River
Many major watersheds of North America border on the drainage of the Mackenzie River. Much of the western edge of the Mackenzie basin runs along the Continental Divide. The divide separates the Mackenzie watershed from that of the Yukon River and its headstreams the Pelly and Stewart rivers, which flow to the Bering Strait; and the Fraser River and Columbia River systems, both of which run to the Pacific Ocean. Lowland divides in the north distinguish the Mackenzie basin from those of the Anderson, Horton, Coppermine and Back Rivers – all of which empty into the Arctic. Eastern watersheds bordering on that of the Mackenzie include those of the Thelon and Churchill Rivers, both of which flow into Hudson Bay. On the south, the Mackenzie watershed borders that of the North Saskatchewan River, part of the Nelson River system, which empties into Hudson Bay after draining much of south-central Canada.
Through its many tributaries, the Mackenzie River basin covers portions of five Canadian provinces and territories – British Columbia (BC), Alberta, Saskatchewan, and the Yukon and Northwest Territories. The two largest headwaters forks, the Peace and Athabasca Rivers, drain much of the central Alberta prairie and the Rocky Mountains in northern BC then combine into the Slave River at the Peace-Athabasca Delta near Lake Athabasca, which also receives runoff from northwestern Saskatchewan. The Slave is the primary feeder of Great Slave Lake (contributing about 77% of the water); other inflows include the Taltson, Lockhart and Hay Rivers, the latter of which also extends into Alberta and BC. Direct tributaries of the Mackenzie from the west such as the Liard and Peel Rivers carry runoff from the mountains of the eastern Yukon.
The eastern portion of the Mackenzie basin is dominated by vast reaches of lake-studded boreal forest and includes many of the largest lakes in North America. By both volume and surface area, Great Bear Lake is the biggest in the watershed and third largest on the continent, with a surface area of 31,153 km2 (12,028 sq mi) and a volume of 2,236 km3 (536 cu mi). Great Slave Lake is slightly smaller, with an area of 28,568 km2 (11,030 sq mi) and containing 2,088 km3 (501 cu mi) of water, although it is significantly deeper than Great Bear. The third major lake, Athabasca, is less than a third that size with an area of 7,800 km2 (3,000 sq mi). Six other lakes in the watershed cover more than 1,000 km2 (390 sq mi), including the Williston Lake reservoir, the second-largest artificial lake in North America, on the Peace River.
With an average annual flow of 9,910 m3/s (350,000 cu ft/s), the Mackenzie River has the highest discharge of any river in Canada and is the fourteenth largest in the world in this respect. About 60% of the water comes from the western half of the basin, which includes the Rocky, Selwyn, and Mackenzie mountain ranges out of which spring major tributaries such as the Peace and Liard Rivers, which contribute 23% and 27% of the total flow, respectively. In contrast the eastern half, despite being dominated by marshland and large lakes, provides only about 25% of the Mackenzie’s discharge. During peak flow in the spring, the difference in discharge between the two halves of the watershed becomes even more marked. While large amounts of snow and glacial melt dramatically drive up water levels in the Mackenzie’s western tributaries, large lakes in the eastern basin retard springtime discharges. Breakup of ice jams caused by sudden rises in temperature – a phenomenon especially pronounced on the Mackenzie – further exacerbate flood peaks. In full flood, the Peace River can carry so much water that it inundates its delta and backs upstream into Lake Athabasca, and the excess water can only flow out after the Peace has receded.
Geology
As recently as the end of the last glacial period eleven thousand years ago the majority of northern Canada was buried under the enormous continental Laurentide ice sheet. The tremendous erosive powers of the Laurentide and its predecessors, which at maximum extent completely buried the Mackenzie River valley under thousands of meters of ice and flattened the eastern portions of the Mackenzie watershed. When the ice sheet receded for the last time, it left a 1,100 km (680 mi)-long postglacial lake called Lake McConnell, of which Great Bear, Great Slave and Athabasca Lakes are remnants. Significant evidence exists that roughly 13,000 years ago, the channel of the Mackenzie was scoured by one or more massive glacial lake outburst floods unleashed from Lake Agassiz, formed by melting ice west of the present-day Great Lakes. At its peak, Agassiz had a greater volume than all present-day freshwater lakes combined. This is believed to have disrupted currents in the Arctic Ocean and led to an abrupt 1,300-year-long cold temperature shift called the Younger Dryas.
Ecology
The Mackenzie River’s watershed is considered one of the largest and most intact ecosystems in North America, especially in the north. Approximately 63% of the basin – 1,137,000 km2 (439,000 sq mi) – is covered by forest, mostly boreal, and wetlands comprise some 18% of the watershed – about 324,900 km2 (125,400 sq mi). More than 93% of the wooded areas in the watershed are virgin forest. There are fifty-three fish species in the basin, none of them endemic. Most of the aquatic species in the Mackenzie River are descendants of those of the Mississippi River and its tributaries. This anomaly is believed to have been caused by hydrologic connection of the two river systems during the Ice Ages by meltwater lakes and channels.
Fishes in the Mackenzie River proper include the northern pike, some minnows, and lake whitefish, and the river’s shores are lined with sparse vegetation like dwarf birch and willows, as well as numerous peat dogs. Further south the tundra vegetation transitions to black spruce, aspen and poplar forest. Overall, the northern watershed is not very diverse ecologically, due to its cold climate – permafrost underlies about three-quarters of the watershed, reaching up to 100 m (330 ft) deep in the delta region – and meager to moderate rainfall, amounting to about 410 millimetres (16 in) over the basin as a whole. The southern half of the basin, in contrast, includes larger reaches of temperate and alpine forests as well as fertile floodplain and riparian habitat, but is actually home to fewer fish species due to large rapids on the Slave River preventing upstream migration of aquatic species.
Migratory birds use the two major deltas in the Mackenzie River basin – the Mackenzie Delta and the inland Peace-Athabasca Delta – as important resting and breeding areas. The latter is located at the convergence of four major North American migratory routes, or flyways. As recently as the mid-twentieth century, more than 400,000 birds passed through during the spring and up to a million in autumn. Some 215 bird species in total have been catalogued in the delta, including endangered species such as the whooping crane, peregrine falcon and bald eagle. Unfortunately, the construction of W.A.C. Bennett Dam on the Peace River has reduced the seasonal variations of water levels in the delta, causing damage to its ecosystems. Populations of migratory birds in the area have steadily declined since the 1960s.
Note : The above story is based on materials provided by Wikipedia
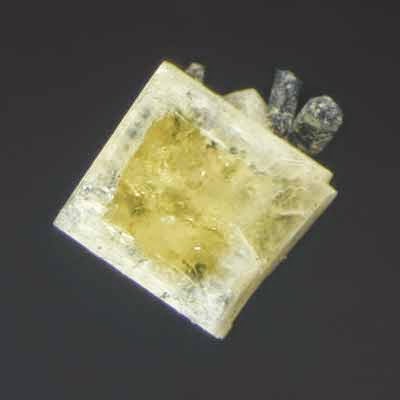
Chemical Formula: (Na,Ca)2BeSi2(O.OH.F)7 Locality: Langesundfiord district, southern Norway. Name Origin: From the Greek leucos, “white” and phanein, ” to appear” in allusion to the white color
Leucophanite is a sorosilicate mineral with a complex composition, (Na,Ca)2BeSi2(O.OH.F)7. It may contain cerium substituting in the calcium position.
It occurs in pegmatites and alkali igneous complexes as yellow, greenish or white triclinic crystals and has been found in Norway, Quebec and Russia.
It was first described from the Langesundfiord district of southern Norway in 1840. The name is from the Greek leucos for “white” and phanein for “to appear” in allusion to the common white color.
History
Discovery date: 1840 Town of Origin: LAVEN, LANGESUNDFJORD Country of Origin : NORVEGE
Optical properties
Optical and misc. Properties: Transparent to translucent Refractive Index : from 1,56 to 1,59 Axial angle 2V : 36-50°
Physical Properties
Color: White, Greenish yellow, Yellow, Light green. Density: 2.96 Diaphaneity: Transparent to translucent Fracture: Brittle – Generally displayed by glasses and most non-metallic minerals. Hardness: 4 – Fluorite Luminescence: Fluorescent, Short UV=pink, Long UV=pink. Luster: Vitreous (Glassy) Streak: white
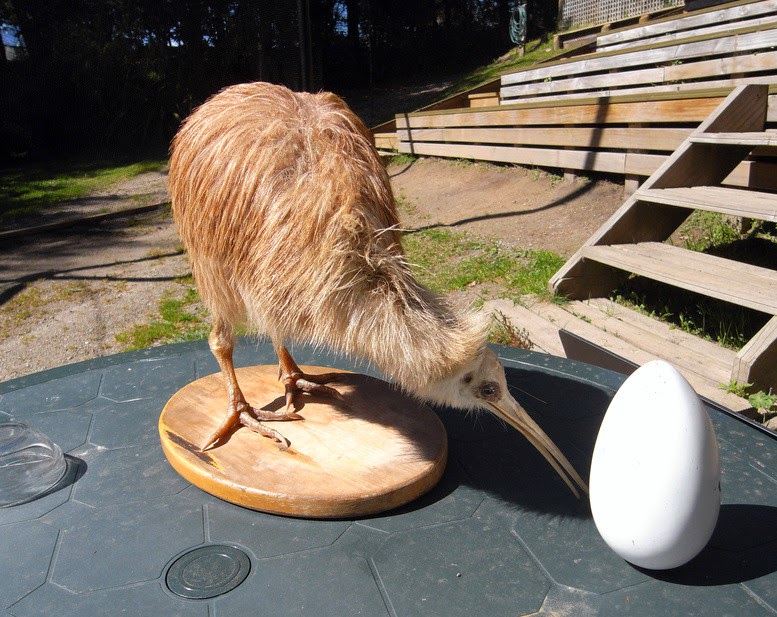
Australia can no longer lay claim to the origins of the iconic New Zealand kiwi following University of Adelaide research published in the journal Science today showing the kiwi’s closest relative is not the emu as was previously thought.
Instead, the diminutive kiwi is most closely related to the extinct Madagascan elephant bird — a 2-3 metre tall, 275 kg giant. And surprisingly, the study concluded, both of these flightless birds once flew.
A new study by the University of Adelaide’s Australian Centre for Ancient DNA (ACAD), has solved a 150-year-old evolutionary mystery about the origins of the giant flightless “ratite” birds, such as the emu and ostrich, which are found across the southern continents. This group contains some of the world’s largest birds — such as the extinct giant moa of New Zealand and elephant birds of Madagascar.
The different “ratite” species were long thought to have formed as the flightless birds were isolated by the separation of the southern continents over the last 130 million years.
However, ancient DNA extracted from bones of two elephant birds held by the Museum of New Zealand, Te Papa Tongarewa, has revealed a close genetic connection with the kiwi, despite the striking differences in geography, morphology and ecology between the two.
“This result was about as unexpected as you could get,” says Mr Kieren Mitchell, PhD candidate with ACAD, who performed the work. “New Zealand and Madagascar were only ever distantly physically joined via Antarctica and Australia, so this result shows the ratites must have dispersed around the world by flight.”
The results correct previous work by ACAD Director Professor Alan Cooper conducted in the 1990s, which had shown the closest living relatives of the kiwi were the Australian emu and cassowary. “It’s great to finally set the record straight, as New Zealanders were shocked and dismayed to find that the national bird appeared to be an Australian immigrant,” says Professor Cooper. “I can only apologise it has taken so long!”
The team were able to use the elephant bird DNA to estimate when the ratite species had separated from each other.
“The evidence suggests flying ratite ancestors dispersed around the world right after the dinosaurs went extinct, before the mammals dramatically increased in size and became the dominant group,” says Professor Cooper.
“We think the ratites exploited that narrow window of opportunity to become large herbivores, but once mammals also got large, about 50 million years ago, no other bird could try that idea again unless they were on a mammal free island — like the Dodo.”
“We can now see why the evolutionary history of the ratites has been such a difficult problem,” says co-author Professor Mike Lee, of the South Australian Museum and University of Adelaide. “Many of them independently converged on very similar body plans, complicating analysis of their history.”
“We recently found fossils of small kiwi ancestors, which we suggested might have had the power of flight not too long ago,” says co-author Flinders University’s Dr Trevor Worthy. “The genetic results back up this interpretation, and confirm that kiwis were flying when they arrived in New Zealand.
“It also explains why the kiwi remained small. By the time it arrived in New Zealand, the large herbivore role was already taken by the moa, forcing the kiwi to stay small, and become insectivorous and nocturnal.”
Alan Tennyson, Curator of Vertebrates at Te Papa, New Zealand’s national museum, says: “The New Zealand kiwi is an integral part of this country’s culture and heritage. It’s fitting that Te Papa’s scientific collections have been used to resolve the mystery of its origins.”
Journal Reference:
Kieren J. Mitchell, Bastien Llamas, Julien Soubrier, Nicolas J. Rawlence, Trevor H. Worthy, Jamie Wood, Michael S. Y. Lee, Alan Cooper. Ancient DNA reveals elephant birds and kiwi are sister taxa and clarifies ratite bird evolution. Science, 2014 DOI: 10.1126/science.1251981
Note : The above story is based on materials provided by University of Adelaide.
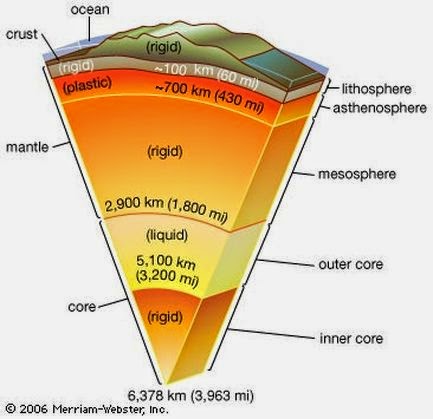
Washington, D.C.—Breaking research news from a team of scientists led by Carnegie’s Ho-kwang “Dave” Mao reveals that the composition of the Earth’s lower mantle may be significantly different than previously thought. These results are to be published by Science.
The lower mantle comprises 55 percent of the planet by volume and extends from 670 and 2900 kilometers in depth, as defined by the so-called transition zone (top) and the core-mantle boundary (below). Pressures in the lower mantle start at 237,000 times atmospheric pressure (24 gigapascals) and reach 1.3 million times atmospheric pressure (136 gigapascals) at the core-mantle boundary.
The prevailing theory has been that the majority of the lower mantle is made up of a single ferromagnesian silicate mineral, commonly called perovskite (Mg,Fe)SiO3) defined through its chemistry and structure. It was thought that perovskite didn’t change structure over the enormous range of pressures and temperatures spanning the lower mantle.
Recent experiments that simulate the conditions of the lower mantle using laser-heated diamond anvil cells, at pressures between 938,000 and 997,000 times atmospheric pressure (95 and 101 gigapascals) and temperatures between 3,500 and 3,860 degrees Fahrenheit (2,200 and 2,400 Kelvin), now reveal that iron bearing perovskite is, in fact, unstable in the lower mantle.
The team finds that the mineral disassociates into two phases one a magnesium silicate perovskite missing iron, which is represented by the Fe portion of the chemical formula, and a new mineral, that is iron-rich and hexagonal in structure, called the H-phase. Experiments confirm that this iron-rich H-phase is more stable than iron bearing perovskite, much to everyone’s surprise. This means it is likely a prevalent and previously unknown species in the lower mantle. This may change our understanding of the deep Earth.
“We still don’t fully understand the chemistry of the H-phase,” said lead author Li Zhang, also of Carnegie. “But this finding indicates that all geodynamic models need to be reconsidered to take the H-phase into account. And there could be even more unidentified phases down there in the lower mantle as well, waiting to be identified.”
Note : The above story is based on materials provided by Carnegie Institution
Chemical Formula: K(AlSi2O6) Locality: Bearpaw Mountains., Montana, USA. Name Origin: From the Greek leukos – “white.”
Leucite is a rock-forming mineral composed of potassium and aluminium tectosilicate K(AlSi2O6). Crystals have the form of cubic icositetrahedra but, as first observed by Sir David Brewster in 1821, they are not optically isotropic, and are therefore pseudo-cubic.
Goniometric measurements made by Gerhard vom Rath in 1873 led him to refer the crystals to the tetragonal system. Optical investigations have since proved the crystals to be still more complex in character, and to consist of several orthorhombic or monoclinic individuals, which are optically biaxial and repeatedly twinned, giving rise to twin-lamellae and to striations on the faces. When the crystals are raised to a temperature of about 500 °C they become optically isotropic and the twin-lamellae and striations disappear, although they reappear when the crystals are cooled again. This pseudo-cubic character of leucite is very similar to that of the mineral boracite.
The crystals are white or ash-grey in colour, hence the name suggested by A. G. Werner in 1701, from ‘λευκος’, ‘(matt) white’. They are transparent and glassy when fresh, albeit with a noticeably subdued ‘subvitreous’ lustre due to the low refractive index, but readily alter to become waxy/greasy and then dull and opaque; they are brittle and break with a conchoidal fracture. The Mohs hardness is 5.5, and the specific gravity 2.47. Inclusions of other minerals, arranged in concentric zones, are frequently present in the crystals. On account of the color and form of the crystals the mineral was early known as white garnet. French authors in older literature may employ René Just Haüy’s name amphigène, but ‘leucite’ is the only name for this mineral species that is recognised as official by the International Mineralogical Association.
History
Discovery date : 1791 Town of Origin : MT. VESUVE (VOLCAN), NAPLES, CAMPANIE Country of Origin : ITALIE
Optical properties
Optical and misc. Properties: Translucent to transparent Refractive Index : 1,50 Axial angle 2V : TRES PETIT
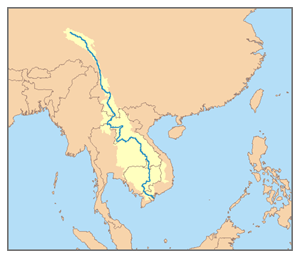
The Mekong is a trans-boundary river in Southeast Asia. It is the world’s 12th-longest river and the 7th-longest in Asia. Its estimated length is 4,350 km (2,703 mi), and it drains an area of 795,000 km2 (307,000 sq mi), discharging 457 km3 (110 cu mi) of water annually.
From the Tibetan Plateau this river runs through China’s Yunnan province, Burma (Myanmar), Laos, Thailand, Cambodia and Vietnam. In 1995, Laos, Thailand, Cambodia and Vietnam established the Mekong River Commission to assist in the management and coordinated use of the Mekong’s resources. In 1996 China and Burma (Myanmar) became “dialogue partners” of the MRC and the six countries now work together within a cooperative framework.
The extreme seasonal variations in flow and the presence of rapids and waterfalls in this river have made navigation difficult. The river is a major trading route linking China’s southwestern province of Yunnan to Laos, Burma (Myanmar) and Thailand to the south, an important trade route between western China and Southeast Asia.
Course
The Mekong rises as the Lancang (Lantsang) in the “Three Rivers Area” on the Tibetan Plateau in the Sanjiangyuan National Nature Reserve; the reserve protects the headwaters of, from north to south, the Yellow (Huang He), the Yangtze and the Mekong Rivers. It flows southeast through Yunnan Province, and then through the Three Parallel Rivers Area in the Hengduan Mountains, along with the Yangtze to its north and the Salween River (Nujiang in Chinese) to its south.
The Mekong then meets the tripoint of China, Burma (Myanmar) and Laos. From there it flows southwest and forms the border of Burma and Laos for about 100 kilometres (62 mi) until it arrives at the tripoint of Burma, Laos, and Thailand. This is also the point of confluence between the Ruak River (which follows the Thai-Burma border) and the Mekong. The area of this tripoint is sometimes termed the Golden Triangle, although the term also refers to the much larger area of those three countries that is notorious as a drug producing region.
From the Golden Triangle tripoint, the Mekong turns southeast to briefly form the border of Laos with Thailand. It then turns east into the interior of Laos, flowing first east and then south for some 400 kilometres (250 mi) before meeting the border with Thailand again. Once more, it defines the Laos-Thailand border for some 850 kilometres (530 mi) as it flows first east, passing in front of the capital of Laos, Vientiane, then turns south. A second time, the river leaves the border and flows east into Laos soon passing the city of Pakse. Thereafter, it turns and runs more or less directly south, crossing into Cambodia.
At Phnom Penh the river is joined on the right bank by the river and lake system the Tonlé Sap. When the Mekong is low, the Tonle Sap is a tributary; water flows from the lake and river into the Mekong. When the Mekong floods, the flow reverses; the floodwaters of the Mekong flow up the Tonle Sap.
Immediately after the Sap River joins the Mekong by Phnom Penh, the Bassac River branches off the right (west) bank. The Bassac River is the first and main distributary of the Mekong; thus, this is the beginning of the Mekong Delta. The two rivers, the Bassac to the west and the Mekong to the east, enter Vietnam very soon after this. In Vietnam, the Bassac is called the Hậu River (Sông Hậu or Hậu Giang); the main, eastern, branch of the Mekong is called the Tiền River or Tiền Giang. In Vietnam, distributaries of the eastern (main, Mekong) branch include the Mỹ Tho River, the Ba Lai River, the Hàm Luông River, and the Cổ Chiên River.
Drainage basin
The Mekong Basin can be divided into two parts: the ‘Upper Mekong Basin’ in Tibet and China, and the ‘Lower Mekong Basin’ from Yunnan downstream from China to the South China Sea. From the point where it rises to its mouth, the most precipitous drop in the Mekong occurs in Upper Mekong Basin, a stretch of some 2,200 km (1,400 mi). Here, it drops 4,500 metres (14,800 ft) before it enters the Lower Basin where the borders of Thailand, Laos, China and Burma (Myanmar) come together in the Golden Triangle. Downstream from the Golden Triangle, the river flows for a further 2,600 km (1,600 mi) through Laos, Thailand and Cambodia before entering the South China Sea via a complex delta system in Vietnam.
Upper Mekong Basin
The Upper Basin makes up 24% of the total area and contributes 15 to 20% of the water that flows into the Mekong River. The catchment here is steep and narrow. Soil erosion has been a major problem and approximately 50% of the sediment in the river comes from the Upper Basin.
In Yunnan province in China, the river and its tributaries are confined by narrow, deep gorges. The tributary river systems in this part of the basin are small. Only 14 have catchment areas that exceed 1,000 km2 (390 sq mi), yet the greatest amount of loss of forest cover in the entire river system per square kilometer has occurred in this region due to heavy unchecked demand for natural resources. In the south of Yunnan, in Simao and Xishuangbanna Prefectures, the river changes as the valley opens out, the floodplain becomes wider, and the river becomes wider and slower.
Lower Mekong Basin
Major tributary systems develop in the Lower Basin. These systems can be separated into two groups: tributaries that contribute to the major wet season flows, and tributaries that drain low relief regions of lower rainfall. The first group are left bank tributaries that drain the high-rainfall areas of Lao PDR. The second group are those on the right bank, mainly the Mun and Chi rivers, that drain a large part of Northeast Thailand.
Laos lies almost entirely within the Lower Mekong Basin. Its climate, landscape and land use are the major factors shaping the hydrology of the river. The mountainous landscape means that only 16% of the country is farmed under lowland terrace or upland shifting cultivation. With upland shifting agriculture (slash and burn), soils recover within 10 to 20 years but the vegetation does not. Shifting cultivation is common in the uplands of Northern Laos and is reported to account for as much as 27% of the total land under rice cultivation. As elsewhere in the basin, forest cover has been steadily reduced during the last three decades by shifting agriculture and permanent agriculture. The cumulative impacts of these activities on the river regime have not been measured. However, the hydrological impacts of land-cover changes induced by the Vietnam War were quantified in two sub-catchments of the Lower Mekong River Basin.
Loss of forest cover in the Thai areas of the Lower Basin has been the highest in all the Lower Mekong countries over the past 60 years. On the Korat Plateau, which includes the Mun and Chi tributary systems, forest cover was reduced from 42% in 1961 to 13% in 1993. Although this part of Northeast Thailand has an annual rainfall of more than 1,000 mm, a high evaporation rate means it is classified as a semi arid region. Consequently, although the Mun and Chi Basins drain 15% of the entire Mekong Basin, they only contribute 6% of the average annual flow. Sandy and saline soils are the most common soil types, which makes much of the land unsuitable for wet rice cultivation. In spite of poor fertility, however, agriculture is intensive. Glutinous rice, maize and cassava are the principal crops. Drought is by far the major hydrological hazard in this region.
As the Mekong enters Cambodia, over 95% of the flows have already joined the river. From here on downstream the terrain is flat and water levels rather than flow volumes determine the movement of water across the landscape. The seasonal cycle of changing water levels at Phnom Penh results in the unique “flow reversal” of water into and out of the Great Lake via the Tonle Sap River. Phnom Penh also marks the beginning of the delta system of the Mekong River. Here the mainstream begins to break up into an increasing number of branches.
In Cambodia, the wet rice is the main crop and is grown on the flood plains of the Tonle Sap, Mekong and Bassac (the Mekong delta distributary known as the Hậu in Vietnam) rivers. More than half of Cambodia remains covered with mixed evergreen and deciduous broadleaf forest, but forest cover has decreased from 73% in 1973 to 63% in 1993. Here, the river landscape is flat. Small changes in water level determine the direction of water movement, including the large-scale reversal of flow into and out of the Tonle Sap basin from the Mekong River.
The Mekong Delta in Viet Nam is farmed intensively and has little natural vegetation left. Forest cover is less than 10%. In the Central Highlands of Vietnam, forest cover was reduced from over 95% in the 1950s to around 50% in the mid 1990s. Agricultural expansion and population pressure are the major reasons for land use and landscape change. Both drought and flood are common hazards in the Delta, which many people believe is the most sensitive to upstream hydrological change.
Geology
The internal drainage patterns of the Mekong are unusual when compared to those of other large rivers. Most large river systems that drain the interiors of continents, such as the Amazon, Congo, and Mississippi, have relatively simple dendritic tributary networks that resemble a branching tree.
Typically, such patterns develop in basins with gentle slopes where the underlying geological structure is fairly homogenous and stable, exerting little or no control on river morphology. In marked contrast, the tributary networks of the Salween, Yangtze, and particularly the Mekong, are complex with different sub-basins often exhibiting different, and distinct, drainage patterns. These complex drainage systems have developed in a setting where the underlying geological structure is heterogeneous and active, and is the major factor controlling the course of rivers and the landscapes they carve out.
The elevation of the Tibetan Plateau during the Tertiary period was an important factor in the genesis of the south-west monsoon, which is the dominant climatic control influencing the hydrology of the Mekong Basin. Understanding the nature and timing of the elevation of Tibet (and the Central Highlands of Viet Nam) therefore helps explain the provenance of sediment reaching the delta and the Tonle Sap Great Lake today. Studies of the provenance of sediments in the Mekong Delta reveal a major switch in the source of sediments about eight million years ago (Ma). From 36 to 8 Ma the bulk (76%) of the sediments deposited in the delta came from erosion of the bedrock in the Three Rivers Area. From 8 Ma to the present, however, the contribution from the Three Rivers Area fell to 40%, while that from the Central Highlands rose from 11 to 51%. One of the most striking conclusions of provenance studies is the small contribution of sediment from the other parts of the Mekong Basin, notably the Khorat Plateau, the uplands of northern Lao PDR and northern Thailand, and the mountain ranges south of the Three Rivers Area.
The last glacial period came to an abrupt end about 19,000 years ago (ka) when sea levels rose rapidly, reaching a maximum of about 4.5 m above present levels in the early Holocene at about 8 ka. At this time the shoreline of the South China Sea almost reached Phnom Penh and cores recovered from near Angkor Borei contained sediments deposited under the influence of tides, and salt marsh and mangrove swamp deposits. Sediments deposited in the Tonle Sap Great Lake about this time (7.9–7.3 ka) also show indications of marine influence, suggesting a connection to the South China Sea. Although the hydraulic relationships between the Mekong and the Tonle Sap Great Lake systems during the Holocene are not well understood, it is clear that between 9,000 and 7,500 years ago the confluence of the Tonle Sap and the Mekong was in close proximity to the South China Sea.
The present river morphology of the Mekong Delta developed over the last 6,000 years. During this period, the delta advanced 200 km over the continental shelf of the South China Sea, covering an area of more than 62,500 km2. From 5.3 to 3.5 ka the delta advanced across a broad embayment formed between higher ground near the Cambodian border and uplands north of Ho Chi Minh City. During this phase of its development the delta was sheltered from the wave action of long-shore currents and was constructed largely through fluvial and tidal processes. At this time the delta was advancing at a rate of 17–18 m per year. After 3.5 ka, however, the delta had built out beyond the embayment and became subject to wave action and marine currents. These deflected deposition south-eastwards in the direction of the Cà Mau Peninsula, which is one of the most recent features of the delta.
For much of its length the Mekong flows through bedrock channels, i.e. channels that are confined or constrained by bedrock or old alluvium in the bed and riverbanks. Geomorphologic features normally associated with the alluvial stretches of mature rivers, such as meanders, oxbow lakes, cut-offs, and extensive floodplains are restricted to a short stretch of the mainstream around Vientiane and downstream of Kratie where the river develops alluvial channels that are free of control exerted by the underlying bedrock.
The Mekong Basin is not normally considered a seismically active area as much of the basin is underlain by the relatively stable continental block. Nonetheless, the parts of the basin in northern Laos, northern Thailand, Burma (Myanmar) and China do experience frequent earthquakes and tremors. The magnitude of these earthquakes rarely exceeds 6.5 on the Richter scale and is unlikely to cause material damage.
Note : The above story is based on materials provided by Wikipedia
PhD student Lisa Cupelli sits atop rocks in the heart of South Africa’s Vredefort impact crater, where she and Western Earth Sciences professor Desmond Moser, below, confirmed the rocks are some of the only remains of a magma sea created more than 2 billion years ago. Credit: Desmond Moser
Desmond Moser never gives up. Twenty years ago, the now Western Earth Sciences professor first visited the heart of South Africa’s Vredefort impact crater, locating what he believed to be some of the only remains of a magma sea created more than 2 billion years ago in a 300-kilometre-wide crater.
He published his finding in 1997 in the journal Geology and awaited praise from peers.
But it never came.
“It was the first paper I ever published and people keep following it up by publishing stuff knocking it. I said it looked like impact rock, while everyone else said it wasn’t. But I was still convinced I was right,” said Moser, of what he refers to as the Vredefort Gabbronorite.
In 2009, Moser, along with PhD student Lisa Cupelli, returned to the South African site to see if they could once and for all confirm his original findings.
Scientists place the asteroid that struck Vredefort among the latest ever to hit the Earth, estimating its size at 5-10-km in diameter.
Given the original location was staked out in pre-GPS 1994, the pair had only an old map and a 35mm slide to guide them.
“I told her this is the situation: If we can find more of the stuff, and we can prove it, it’s going to be good news. Or, it could be a total bust,” he said. “There are hundreds, if not thousands, of geologists going to the area all the time, but they are just walking over the stuff.”
After and hour-and-a-half, Moser and Cupelli found the site where he collected his first sample, thanks to the marking of an windmill that still stood nearby in what was now a farmer’s field.
They spent the next two-and-a-half weeks mapping and collecting samples. And the result was just what he expected.
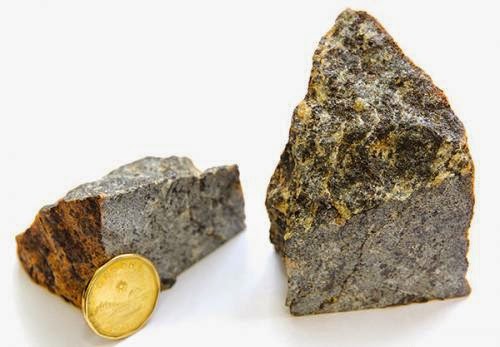
A sample of the Vredefort Gabbronorite rock Western Earth Sciences professor Desmond Moser confirmed was impact rock created more than 2 billion years ago in South Africa. Credit: Paul Mayne / Western News
“It is definitely a rock that crystalized from the mini-sea of magma, which was created by the impact crater,” he said.
To this day, detractors still think Moser is mistaken.
“Everyone assumed over the years it (the rock) had simply been worn away. It’s not target impact that I found, but rock that is produced from the heat of the magma ocean and, once crystalized, turns into rock – new impact-created rock.”
One of the reasons Moser said other geologists kept missing the point was it didn’t look like what you expect it to look like, even to Moser.
“I did say no at first. But what people usually don’t look at is the micro-minerals,” he said. “When I brought it back to the lab, most of the rocks I got from there had all these smashed and corrupted crystals. But with this particular one they were gem-quality, beautiful little prisms, crystal clean. And then I dated them and they came out to be the age of the impact.
“Then, I knew I had something.”
Moser’s re-confirmation of his earlier work, published in this month’s Geology, will keep geologists on both sides of the fence or, in this case, both sides of the crater, debating whether or not Moser’s discovery is what he says it is.
“I think there is more to be found. We may be walking over more impact rock, but just not assuming what it is,” he said.
One thing for sure, Moser still has the scientific evidence to prove his 20-year-old point.
“I’m a big believer in the truth, and sometimes it takes that long,” he said. “But science works.”
Note : The above story is based on materials provided by University of Western Ontario
Chemical Formula: K(Li,Al,Rb)3(Al,Si)4O10(F,OH)2 Locality: Pala, San Diego Co., California, USA. Name Origin: From the Greek lepidion – “scale” and lithos – “stone.”Lepidolite is a lilac-gray or rose-colored member of the mica group with formula K(Li,Al,Rb)3(Al,Si)4O10(F,OH)2. It is a secondary source of lithium. It is a phyllosilicate mineral and a member of the polylithionite-trilithionite series.It is associated with other lithium-bearing minerals like spodumene in pegmatite bodies. It is one of the major sources of the rare alkali metals rubidium and caesium. In 1861 Robert Bunsen and Gustav Kirchhoff extracted 150 kg of lepidolite and yielded a few grams of rubidium salts for analysis, and therefore discovered the new element rubidium.
It occurs in granite pegmatites, in some high-temperature quartz veins, greisens and granites. Associated minerals include quartz, feldspar, spodumene, amblygonite, tourmaline, columbite, cassiterite, topaz and beryl.
Notable occurrences include Brazil; Ural Mountains, Russia; California, United States; Tanco Mine, Bernic Lake, Manitoba, Canada; and Madagascar.
History
Discovery date : 1792 Town of Origin : ROZNA, BYSTRICE, MORAVIE Country of Origin : TCHEQUIE
Optical properties
Optical and misc. Properties : Translucent Refractive Index : from 1,52 to 1,58 Axial angle 2V : 0-58°
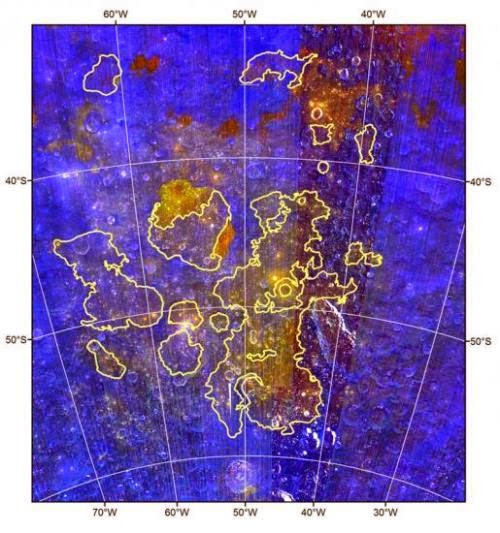
Data from the Moon Mineralogy Mapper show the presence of cryptomaria (“hidden seas,” outlined in yellow). Primary material of the lunar crust is shown as blue. Areas show as yellow indicate basalt that originated below the surface.
Billions of years ago, volcanoes sent material from inside planetary bodies to the surface. Subsequent impacts have covered those original deposits. Jennifer Whitten, who receives her Ph.D. in geological sciences this year, has figured out a way to study those “hidden seas” and learn more about the early volcanic history the Moon and Mercury.
Volcanism is a planet’s way of turning itself inside out. For scientists, material blasted to the surface from volcanoes is a goldmine of information about a planet’s past.
“Volcanic deposits are important because you get a picture of how the surface has been modified, but you can also learn so much about the interior of a planet,” said Jennifer Whitten, who will receive her Ph.D. this week from the Department of Geological Sciences. “So you get a picture of the inside and the outside.”
For her dissertation, Whitten studied volcanic deposits on the Moon and Mercury that date back billions of years. She hopes that a better understanding of these ancient deposits will shed light on the formation and early evolution of those two planetary bodies.
It might also deepen our understanding of Earth in its infancy. On our home planet, ancient volcanic deposits are often ground away by the constant churning of tectonic plates. So to truly understand how volcanism shapes a young planet, Whitten says, it’s essential to look beyond the Earth.
“One of the most perplexing questions about the earliest history of the planets, including Earth, is the amount of volcanic activity that occurs then,” said Jim Head, professor of geological sciences and Whitten’s adviser. “The observational techniques Jennifer Whitten has developed have contributed greatly to our understanding of these early volcanic processes.”
Hidden volcanoes on the Moon and Mercury
On the Moon, some volcanic deposits are easy to spot. The lunar maria—the dark splotches that form the iconic “man in the Moon”—are composed largely of volcanic basalts. Termed “mare,” the Greek word for sea, because early astronomers mistook them for bodies of water, they were formed billions of years ago when molten lava flowed up from the depths and filled in deep basins formed by asteroids and other impactors.
But there are other volcanic deposits on the Moon—many of them older than the visible maria—that are hidden from view. As impacts pounded the Moon’s surface, some ancient volcanic deposits were covered with debris blasted out of impact craters. The debris, which is generally a bright whitish color, hides the dark-colored basalt from view. Those hidden maria—called “cryptomaria” after the Greek for hidden or secret seas—are what Whitten wanted to explore. Understanding where these deposits are located and what they’re made of helps to fill in missing pieces of the Moon’s volcanic history.
Whitten used a variety of techniques to look through the veneer of impact debris and definitively identify cryptomaria deposits on the Moon. One of those techniques involved looking for a very specific type of crater. When a small impactor strikes a cryptomare deposit, it digs up some of the volcanic material beneath the impact debris. The result is a crater surrounded by a dark halo of mare material.
Using these dark-halo craters as a guide, Whitten was able to identify 18 deposits of cryptomaria on the Moon. Having mapped the deposits, she was able to answer some critical questions about them.
First, she was able to use data from the Moon Mineralogy Mapper, which flew aboard India’s Chandrayaan-1 spacecraft, to identify the composition of the deposits. She found that cryptomaria had a composition similar to the visible maria—something that had been the subject of speculation before now.
“I’ve been able to show that it is actually mare basalt,” she said. “We can use the term cryptomaria and know that it means what we think it means.”
Second, Whitten was able to show that cryptomaria are concentrated on the Moon’s near side—the side facing Earth. It’s long been known that the lunar far side lacks the visible mare deposits that dominate the near side. But it wasn’t clear whether or not there may have been some cryptomaria hiding on the far side.
“Secretly I really wanted to find some major deposit on the far side so I could say, ‘Look everyone; it’s not all on the near side,'” Whitten said. “But that didn’t happen.”
The finding suggests that volcanism throughout the Moon’s history was concentrated on the near side. That appears to be in part because the crust is thinner on the nearside, allowing volcanic material to flow through more easily.
Whitten used similar techniques to look for signs of ancient volcanism on Mercury. There, she was able to show vast areas of the planet’s northern hemisphere, known as the intercrater plains, have a volcanic origin. The work added substantially to the inventory of volcanic material on the surface of Mercury.
More research ahead
Recently, Whitten accepted a position as a postdoctoral researcher at the Smithsonian Air and Space Museum in Washington, D.C. There, she’ll be involved a project that uses radar to look for more buried volcanic deposits on the Moon.
“I’m excited about learning a new technique that provides access to the few upper meters of the lunar surface, especially since my dissertation was focused on finding buried volcanic deposits,” she said. “I am optimistic about finding interesting volcanic features.”
Those features could help deepen our understanding of the solar system.
“In the big picture, understanding volcanic deposits can give a sense of the initial composition of these planets,” Whitten said. “That tells you about the materials in the cloud that formed the solar system.”
It also helps us learn about our own planet. The types of deposits Whitten looked at on the Moon and Mercury are called large igneous provinces or LIPs. LIPs have been fairly common throughout Earth’s history and have been linked to several major extinction events. So understanding how they work could be of critical importance.
“The LIPs on Earth have been eroded or are under the ocean, so it’s hard to study them,” Whitten said. “But you can get an idea of the size of these things and what affects their size because we can study them on Moon or Mercury. I think it’s really exciting that by understanding what’s happening on the Moon and Mercury, you can better understand the early history of the Earth.”
Note : The above story is based on materials provided by Brown University
Click here (PDF or JPG) to download the latest version (v 2014/02) of the International Chronostratigraphic Chart. Translations of the chart: Chinese (v2013-01: PDF or JPG), Spanish (v2013-01), Portuguese (v2013-01: PDF or JPG), Norwegian (v2013-01: PDF or JPG), Basque (v2013-01: PDF or JPG), Catalan (v2013-01: PDF or JPG), French (v2012) and Japanese (v2012).
The old versions can be download at the following links: 2008 (PDF or JPG), 2009 (PDF or JPG), 2010 (PDF or JPG), 2012 (PDF or JPG), 2013/01 (PDF or JPG).