back to top
27.8 C
New York
Tuesday, April 22, 2025
Home Blog Page 28

Traces of Earth’s early magma ocean identified in Greenland rocks

Isua in Greenland Credit: Hanika Rizo
Isua in Greenland. Credit: Hanika Rizo

New research led by the University of Cambridge has found rare evidence — preserved in the chemistry of ancient rocks from Greenland — which tells of a time when Earth was almost entirely molten.

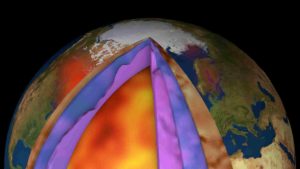
The study, published in the journal Science Advances, yields information on a important period in our planet’s formation, when a deep sea of incandescent magma stretched across Earth’s surface and extended hundreds of kilometres into its interior.

It is the gradual cooling and crystallisation of this ‘magma ocean’ that set the chemistry of Earth’s interior — a defining stage in the assembly of our planet’s structure and the formation of our early atmosphere.

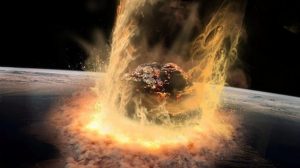
Scientists know that catastrophic impacts during the formation of the Earth and Moon would have generated enough energy to melt our planet’s interior. But we don’t know much about this distant and fiery phase of Earth’s history because tectonic processes have recycled almost all rocks older than 4 billion years.

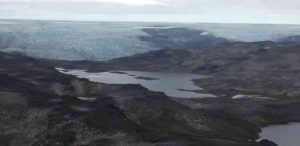
Now researchers have found the chemical remnants of the magma ocean in 3.6-billion-year-old rocks from southwestern Greenland.

The findings support the long-held theory that Earth was once almost entirely molten and provide a window into a time when the planet started to solidify and develop the chemistry that now governs its internal structure. The research suggests that other rocks on Earth’s surface may also preserve evidence of ancient magma oceans.

“There are few opportunities to get geological constraints on the events in the first billion years of Earth’s history. It’s astonishing that we can even hold these rocks in our hands — let alone get so much detail about the early history of our planet,” said lead author Dr Helen Williams, from Cambridge’s Department of Earth Sciences.

The study brings forensic chemical analysis together with thermodynamic modelling in search of the primeval origins of the Greenland rocks, and how they got to the surface.

At first glance, the rocks that make up Greenland’s Isua supracrustal belt look just like any modern basalt you’d find on the sea floor. But this outcrop, which was first described in the 1960s, is the oldest exposure of rocks on Earth. It is known to contain the earliest evidence of microbial life and plate tectonics.

The new research shows that the Isua rocks also preserve rare evidence which even predates plate tectonics — the residues of some of the crystals left behind as that magma ocean cooled.

“It was a combination of some new chemical analyses we did and the previously published data that flagged to us that the Isua rocks might contain traces of ancient material. The hafnium and neodymium isotopes were really tantalizing, because those isotope systems are very hard to modify — so we had to look at their chemistry in more detail,” said co-author Dr Hanika Rizo, from Carleton University.

Iron isotopic systematics confirmed to Williams and the team that the Isua rocks were derived from parts of the Earth’s interior that formed as a consequence of magma ocean crystallisation.

Most of this primeval rock has been mixed up by convection in the mantle, but scientists think that some isolated zones deep at the mantle-core boundary — ancient crystal graveyards — may have remained undisturbed for billions of years.

It’s the relics of these crystal graveyards that Williams and her colleagues observed in the Isua rock chemistry. “Those samples with the iron fingerprint also have a tungsten anomaly — a signature of Earth’s formation — which makes us think that their origin can be traced back to these primeval crystals,” said Williams.

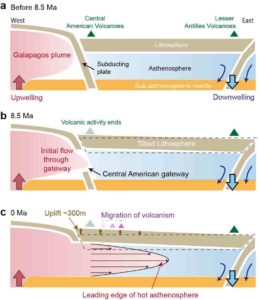
But how did these signals from the deep mantle find their way up to the surface? Their isotopic makeup shows they were not just funnelled up from melting at the core-mantle boundary. Their journey was more circuitous, involving several stages of crystallization and remelting — a kind of distillation process. The mix of ancient crystals and magma would have first migrated to the upper mantle, where it was churned up to create a ‘marble cake’ of rocks from different depths. Later melting of that hybrid of rocks is what produced the magma which fed this part of Greenland.

The team’s findings suggest that modern hotspot volcanoes, which are thought to have formed relatively recently, may actually be influenced by ancient processes.

“The geochemical signals we report in the Greenland rocks bear similarities to rocks erupted from hotspot volcanoes like Hawaii — something we are interested in is whether they might also be tapping into the depths and accessing regions of the interior usually beyond our reach,” said Dr Oliver Shorttle, who is jointly based at Cambridge’s Department of Earth Sciences and Institute of Astronomy.

The team’s findings came out of a project funded by Deep Volatiles, a NERC-funded 5-year research programme. They now plan to continue their quest to understand the magma ocean by widening their search for clues in ancient rocks and experimentally modelling isotopic fractionation in the lower mantle.

“We’ve been able to unpick what one part of our planet’s interior was doing billions of years ago, but to fill in the picture further we must keep searching for more chemical clues in ancient rocks,” said co-author Dr Simon Matthews from the University of Iceland.

Scientists have often been reluctant to look for chemical evidence of these ancient events. “The evidence is often altered by the course of time. But the fact we found what we did suggests that the chemistry of other ancient rocks may yield further insights into the Earth’s formation and evolution — and that’s immensely exciting,” said Williams.

Reference:
Helen M. Williams, Simon Matthews, Hanika Rizo, Oliver Shorttle. Iron isotopes trace primordial magma ocean cumulates melting in Earth’s upper mantle. Science Advances, 2021; 7 (11): eabc7394 DOI: 10.1126/sciadv.abc7394

Note: The above post is reprinted from materials provided by University of Cambridge. The original story is licensed under a Creative Commons License.

Gravity mission still unearthing hidden secrets

Despite ESA’s GOCE mission ending over seven years ago, scientists continue to use this remarkable satellite’s gravity data to delve deep and unearth secrets about our planet. Recent research shows how scientists have combined GOCE data with measurements taken at the surface to generate a new model of Earth’s crust and upper mantle. This is the first time such a model has been created this way – and it is shedding new light on the processes of plate tectonics. The new model produced in ESA’s 3D Earth study shows for the first time how dissimilar the sub-lithospheric mantle is beneath different oceans, and provides insight as to how the morphology and spreading rates of mid-oceanic ridges may be connected with the deep chemical and thermal structure. Credit: ESA/Planetary Visions)

Despite ESA’s GOCE mission ending over seven years ago, scientists continue to use this remarkable satellite’s gravity data to delve deep and unearth secrets about our planet. Recent research shows how scientists have combined GOCE data with measurements taken at the surface to generate a new model of Earth’s crust and upper mantle. This is the first time such a model has been created this way—and it is shedding new light on processes of plate tectonics, which, in turn, are related to phenomena such as earthquakes and volcanic eruptions.

The lithosphere, which includes the planet’s hard crust and the partially molten top part of the upper mantle, is fundamental to plate tectonics.

Plate tectonics describes how the crust is divided into a mosaic of plates that slide laterally over the malleable top of the upper mantle and in doing so give rise to new seafloor along mid-ocean ridges, mountains, volcanoes and earthquakes. A better understanding of these processes relies on knowledge of differences in the lithosphere’s temperature and chemical composition.

Geophysicists traditionally measure the speed at which seismic waves propagate when an earthquake occurs to determine the distribution of subsurface physical properties. The speed of seismic waves is governed mostly by the temperature of subsurface rocks and to a lesser extent by density.

Here, gravity data from space can add to picture because the strength of the gravity signal is related to density. In addition, data from satellites is uniform in coverage and in accuracy, and satellites cover areas where ground measurements are scarce.

For over four years, GOCE mapped Earth’s gravity with extreme detail and accuracy. This has led to some remarkable discoveries, from deep below the surface of our planet to high up in the atmosphere and beyond.

New research published in Geophysical Journal International describes how scientists generated a new model of the lithosphere using the joint power of GOCE gravity data and seismological observations combined with petrological data, which comes from the study of rocks brought to the surface and from laboratories where the extreme pressures and temperatures of Earth’s interior are replicated.

Javier Fullea, from Complutense University of Madrid and the Dublin Institute for Advanced Studies, and also co-author of the paper, said, “Earlier global models of the crust or lithosphere suffered from limited resolution or were based on a single method or dataset.

“Only recently available models were able to combine multiple geophysical data, but they were often only on regional scales or they were limited by how the different data are integrated.

“For the first time, we’ve been able to create a new model that combines global-scale multiple terrestrial and GOCE satellite datasets in a joint inversion that describes the actual temperature and composition of mantle rocks.”

Jesse Reusen, from Delft University of Technology, added, “This novel model provides an image of the present-day composition and thermal structure of the upper mantle that can be used to estimate the viscosity. In fact, it has already been used to estimate the remaining post-glacial uplift—or the rise of the land after the removal of weight of the ice—following the melting of the Laurentide ice sheet in Canada, improving our understanding of interactions between the cryosphere and the solid Earth. This research was published last year in the Journal of Geophysical Research.”

The new model produced in ESA’s 3D Earth study shows for the first time how dissimilar the sub-lithospheric mantle is beneath different oceans, and provides insight as to how the morphology and spreading rates of mid-oceanic ridges may be connected with the deep chemical and thermal structure.

ESA’s Roger Haagmans, commented, “Our GOCE mission never ceases to impress. The data it delivered during its four-year life in orbit continue to be used to understand the complexities of our planet. Here we see it shining new light on the structure of Earth deep below our feet. Even though processes are occurring deep down, they have an effect on Earth’s surface—from the generation of renewed seafloor to earthquakes, so in turn, affect us all.

“Moreover, this is a remarkable result from the 3D Earth project and another significant step towards the realisation of one of the main goals of our Science for Society programme: develop the most advanced reconstruction of our solid Earth from the core to the surface, and its dynamic processes.”

Reference:
J Fullea et al. WINTERC-G: mapping the upper mantle thermochemical heterogeneity from coupled geophysical-petrological inversion of seismic waveforms, heat flow, surface elevation and gravity satellite data, Geophysical Journal International (2021). DOI: 10.1093/gji/ggab094

Note: The above post is reprinted from materials provided by European Space Agency.

Geologists discover powerful ‘river of rocks’ below Caribbean

In this image, the warped amount of the surface is due to the opening of the Central American gateway that allowed hot material to flow through. (a) Before 8.5 million years ago, hot material was upwelling under the Galapagos from deep inside the Earth, but was blocked out of the Caribbean because of a curtain of subducting plate. (b) A gateway opened at 8.5 million years ago allowing the hot material to flow through. (c) Today, the hot material reaches midway between Central America and the Lesser Antilles, tilting up the bottom of the Caribbean sea by about 300 m (1,000 ft). Credit: University of Houston

Geologists have long thought tectonic plates move because they are pulled by the weight of their sinking portions and that an underlying, hot, softer layer called asthenosphere serves as a passive lubricant. But a team of geologists at the University of Houston has found that layer is actually flowing vigorously, moving fast enough to drive plate motions.

In their study published in Nature Communications, researchers from the UH College of Natural Sciences and Mathematics looked at minute changes in satellite-detected gravitational pull within the Caribbean and at mantle tomography images — similar to a CAT Scan — of the asthenosphere under the Caribbean. They found a hot “river of rocks” being squeezed from the Pacific Ocean through a gateway under Central America and reaching to the middle of the Caribbean Sea. This underground “river of rocks” started flowing eight million years ago, when the Central American gateway opened, uplifting the overlying seafloor by several hundred feet and tilting it to the northeast toward the Lesser Antilles.

“Without the extra support generated by this flow in the asthenosphere, portions of Central America would still be below sea level. The Atlantic and the Pacific Oceans would be connected without a need for the Panama Canal,” said study co-author Lorenzo Colli, assistant professor of geophysics, geodynamics and mantle structure in the Department of Earth and Atmospheric Sciences.

The findings have implications for understanding the shape of the Earth’s surface, of its evolution over time through the appearance and disappearance of shallows seas, low-lying land bridges and the forces that move tectonic plates and cause earthquakes.

Another fascinating discovery, according to the researchers, is the asthenosphere is moving six inches per year, which is three times faster than an average plate. It can move independently from the overlying plates and drag them in a different direction.

“This challenges the top-down notion that subduction is always the driver,” explained Jonny Wu, study co-author and assistant professor of structural geology, tectonics and mantle structure. “Think of the plates moving like an air hockey puck and being lubricated from below. Instead, what we found is the air hockey table is imposing its own currents on the puck that’s moving around, creating a bottom-up movement that has not been well recognized, and that’s being quantified here.”

Reference:
Yi-Wei Chen, Lorenzo Colli, Dale E. Bird, Jonny Wu, Hejun Zhu. Caribbean plate tilted and actively dragged eastwards by low-viscosity asthenospheric flow. Nature Communications, 2021; 12 (1) DOI: 10.1038/s41467-021-21723-1

Note: The above post is reprinted from materials provided by University of Houston. Original written by Sara Tubbs.

Volcanic eruptions had large and persistent impacts on global hydroclimate over the last millennium

Arenal, a major tourist attraction in Costa Rica, is one of the most active volcanos in Central America. Credit: Ernesto Tejedor

Large tropical volcanos have caused some of the world’s most destructive natural disasters in history, with eruptions spewing out massive quantities of harmful gases and other debris that can wipe out everything in their path.

But what about wider impacts on global climate? These large eruptions are known to temporarily cool the planet and cause other climate disruptions, including changes in the global distribution of rainfall.

In a new study, a team of paleoclimate researchers, including Ernesto Tejedor and Mathias Vuille at the University at Albany, used a proxy product that employs natural climate archives to better understand the global and seasonal hydroclimate impacts of all known tropical eruptions over the last millennium larger than Mount Pinatubo in 1991, the largest volcanic eruption to happen in the last 100 years.

Their results showed that the hydroclimatic response following these large eruptions was often significant and at times persisted for more than a decade. Most notably, the eruptions that were followed by abnormally dry conditions were estimated over tropical Africa, Central Asia and the Middle East, along with wet conditions over Oceania and the South American monsoon regions. The researchers also compared their results to those from a stand-alone climate model and found that the model simulated smaller and more short-lived hydroclimatic impacts.

Results are now published in the Proceedings of the National Academy of Sciences (PNAS).

“We have not had a major volcanic eruption in 30 years, so I think we tend to forget how large of a societal disruption they can cause,” said Vuille, a professor in UAlbany’s Department of Atmospheric and Environmental Sciences. “When looking at the hydroclimatic response globally, much of the previous work has relied on existing climate models. Our proxy product adds new, real-world data to estimate the responses on a global scale, which suggests these eruptions can cause much larger and prolonged wet and dry anomalies than we initially believed.”

PHYDA Product

The new dataset used in this study, called the Paleo Hydrodynamics Data Assimilation (PHYDA) product, was created through support from UAlbany’s $5 million “PIRE CREATE” project, which is funded through the National Science Foundation.

The PHYDA product is a publicly available global reconstruction of temperature and hydroclimate conditions over the last 2,000 years, which are estimated by combining information from a climate model and a global collection of 2,591 tree-ring records, 197 coral and sclerosponge records, 153 ice-core isotope records, 26 cave-sediment records, 10 lake-sediment records and one marine-sediment record.

Using PHYDA, the researchers were able to compare their new proxy-estimated climate responses to volcanism with those derived exclusively from a climate model using the Community Earth System Model Last Millennium Ensemble (CESM-LME).

“The trees, and the other natural climate archives included in the PHYDA, were there to see these volcanic eruptions happen. It’s not a theoretical construct,” said Jason Smerdon, PIRE CREATE researcher and professor at Columbia University’s Lamont-Doherty Earth Observatory. “This was the first time we were able to use this new proxy product as an estimate of volcanic climate responses in the past, and the picture it paints has yielded surprises in terms of how large and persistent the hydroclimatic impacts of volcanism can be.”

Volcanic Eruption Preparedness

The researchers agree that understanding why there are discrepancies between the hydroclimatic impacts estimated from a proxy-based product and a stand-alone climate model will be critical for projecting how future volcanic eruptions may affect global climate, especially with added impacts from anthropogenic climate change.

It is probable that more large tropical volcanic eruptions will occur within the next century, according to Tejedor, the paper’s first author and UAlbany postdoctoral researcher on the PIRE CREATE team.

“If you look at past centuries and the frequency of large volcanic eruptions through history, it is very likely that we’ll see a similar-sized eruption before the end of this century, possibly more than one,” said Tejedor. “We believe our findings serve as an important warning that affected communities must not only think about immediate impacts, but that volcanic eruptions can also lead to long-lasting changes in climate.”

Reference:
Ernesto Tejedor et al. Global hydroclimatic response to tropical volcanic eruptions over the last millennium, Proceedings of the National Academy of Sciences (2021). DOI: 10.1073/pnas.2019145118

Note: The above post is reprinted from materials provided by University at Albany.

Europe’s largest meteorite crater – home to deep ancient fungi

Fungi sample, hypha and sphere in a drill core sample from 540 m depth in the Siljan impact structure, scanning electron microscope image (width ~70 µm). Credit Henrik Drake.

Fractured rocks of impact craters have been suggested to be suitable environments for deep colonization of microbial communities. In a new study published in Communications Earth & Environment, a team of researchers shows that fungi has colonized deep parts of the largest impact crater in Europe, the Siljan impact structure, Sweden. Intriguingly, the fungi seem to have been fueling methane production in the crater.

At the scenic Swedish lake of Siljan, an impressive impact structure of more than 50 km in diameter formed almost 400 million years ago. In newly retrieved bore cores from drillings deep into the crater, a team of researchers have found fossil evidence of fungi.

The researchers examined an intensively fractured rock section at 540 depth level in the crater and noted fine filamentous structures in the vuggy rock. After closer examination in the laboratory, it became clear to them that the filaments were fossilized remains of fungi. Fungi that withstand the oxygen free environment at these depths.

The relative abundance of different isotopes of carbon and sulfur within minerals found in relation to fungi suggested to the researchers that the fungi were involved in methane- and sulfide-forming processes in relationships with other inhabitants of the deep biosphere – bacteria and archaea.

Henrik Drake, of the Linnaeus University, Sweden, and lead author of the study, explains the discovery:

-The findings suggest that fungi may be widespread decomposers of organic matter and overlooked symbiotic partners to other, more primitive, microorganisms, thereby capable of enhancing the production of greenhouse gases in the vast rock-hosted deep biosphere.

The first in situ finding

Radioisotopic dating of tiny calcite crystals formed following microbial methane formation revealed an age of the fungi fossils to around 39 million years ago, more than 300 million years after the meteorite impact.

-We propose that the anaerobic fungi decomposed organic bituminous material in the fractures and produced hydrogen gas that fueled methanogens. This would be the first in situ finding of ancient anaerobic fungi linked to methanogenesis at great depth in the continental crust, says Magnus Ivarsson, at the Swedish Museum of Natural History and co-author of the study.

The impact structure, with a ring zone of down-faulted Paleozoic sediments, has been optimal for deep colonization of fungi, because energy sources in the form of organics and hydrocarbons from overlying shales have migrated throughout the fractured crater.

-The preserved organic molecules that we could detect in the fungal remains give us additional evidence for a fungal origin and also for the proposed biodegradation pathway of shale-derived hydrocarbons, ultimately leading to production of methane at depth, adds co-author Christine Heim, of University of Cologne, Germany.

Henrik Drake summarizes:

-Microorganisms and their strategies for survival and colonization of Earth’s most hostile environments continue to amaze and surprise us, and here we add another fungal piece to the deep biosphere jigsaw puzzle.

Reference:
The results are presented in the article”Fossilized anaerobic and possibly methanogenesis-fueling fungi identified deep within the Siljan impact structure, Sweden” in the Nature journal Communications Earth & Environment (published 18th of February 2021). DOI:10.1038/s43247-021-00107-9. The article is available in full-length here: www.nature.com/articles/s43247-021-00107-9

Note: The above post is reprinted from materials provided by Linnaeus University.

Younger Tyrannosaurus Rex bites were less ferocious than their adult counterparts

Skeletons of four tyrannosaurid specimens tested in the study. Clockwise from above left: adult Tyrannosaurus rex “Sue” (FMNH PR 2081) (Field Museum of Natural History, Chicago, IL; photo by the Field Museum), juvenile Tyrannosaurus rex “Jane” (BMRP 2002.4.1) (Burpee Museum of Natural History; photo by A. Rowe), adult Tarbosaurus bataar (Dinosaurium exhibition, Prague, Czech Republic; photo by R. Holiš) and Raptorex kriegsteini skeletal reconstruction (LH PV18) (Long Hao Institute of Geology and Paleontology, Hohhot, Inner Mongolia, China; photo by P. Sereno). Credit: Listed in caption. Final image by Andre Rowe

By closely examining the jaw mechanics of juvenile and adult tyrannosaurids, some of the fiercest dinosaurs to inhabit earth, scientists led by the University of Bristol have uncovered differences in how they bit into their prey.

They found that younger tyrannosaurs were incapable of delivering the bone-crunching bite that is often synonymous with the Tyrannosaurus rex and that adult specimens were far better equipped for tearing out chunks of flesh and bone with their massive, deeply set jaws.

The team also found that tension from the insertion of the lower pterygoid muscle is linked to decreasing stresses near the front of the typical tyrannosaur jaw, where the animals may have applied their highest impact bite forces using their large, conical teeth.

This would be advantageous with the highly robust teeth on the anterior end of the tyrannosaur jaw, where, usually, they may have applied their highest impact bite forces. Crocodilians experience the reverse situation — they possess robust teeth near the posterior end of their mandible where they apply their highest bite forces.

Adult tyrannosaurids have been extensively studied due to the availability of relatively complete specimens that have been CT scanned.

The availability of this material has allowed for studies of their feeding mechanics. The adult Tyrannosaurus rex was capable of a 60,000 Newton bite (for comparison, an adult lion averages 1,300 Newtons) and there is evidence of it having actively preyed on large, herbivorous dinosaurs.

The team were interested in inferring more about the feeding mechanics and implications for juvenile tyrannosaurs.

Their main hypotheses were that larger tyrannosaurid mandibles experienced absolutely lower peak stress, because they became more robust (deeper and wider relative to length) as they grew, and that at equalized mandible lengths, younger tyrannosaurids experienced greater stress and strain relative to the adults, suggesting relatively lower bite forces consistent with proportionally slender jaws.

At actual size the juveniles experienced lower absolute stresses when compared to the adult, contradicting our first hypothesis. This means that in real life, adult tyrannosaurs would experience high absolute stresses during feeding but shrug it off due to its immense size. However, when mandible lengths are equalized, the juvenile specimens experienced greater stresses, due to the relatively lower bite forces typical in slender jaws.

Lead author Andre Rowe, a Geology PhD Student at the University of Bristol’s School of Earth Sciences, said: “Tyrannosaurids were active predators and their prey likely varied based on their developmental stage.

“Based on biomechanical data, we presume that they pursued smaller prey and fulfilled an environmental role similar to the ‘raptor’ dinosaurs such as the dromaeosaurs. Adult tyrannosaurs were likely subduing large dinosaurs such as the duckbilled hadrosaurs and Triceratops, which would be quickly killed by their bone-crunching bite.

“This study illustrates the importance of 3D modeling and computational studies in vertebrate paleontology — the methodology we used in our study can be applied to many different groups of extinct animals so that we can better understand how they adapted to their respective environments.”

There are two major components of this research that Andre and the team would like to see future researchers delve into continued CT and surface scanning of dinosaur cranial material and more application of 3D models in dinosaur biomechanics research.

Andre added: “There remains a plethora of unearthed dinosaur material that has not been utilized in studies of feeding and function — ideally, all of our existing specimens will one day be scanned and made widely available online to researchers everywhere.

“The current lack of 3D model availability is noticeable in dinosaur research; relatively few studies involving 3D models of carnivorous dinosaurs have been published thus far. There is still much work to be done concerning skull function in all extinct animals — not only dinosaurs.”

Reference:
Andre J. Rowe, Eric Snively. Biomechanics of juvenile tyrannosaurid mandibles and their implications for bite force: Evolutionary biology. The Anatomical Record, 2021; DOI: 10.1002/ar.24602

Note: The above post is reprinted from materials provided by University of Bristol.

Rise of marine predators reshaped ocean life as dramatically as mass extinctions

These fossil ammonites have lost their outer coating of shell, revealing the iridescent nacre beneath. Now extinct, ammonites were a group of marine mollusks that first appeared about 409 million years ago, persisting until the extinction event that wiped out the dinosaurs about 66 million years ago. Credit: Florida Museum photo by Jeff Gage

Evolutionary arms races between marine animals overhauled ocean ecosystems on scales similar to the mass extinctions triggered by global disasters, a new study shows.

Scientists at Umeå University in Sweden and the Florida Museum of Natural History used paleontological databases to build a multilayered computer model of the history of marine life over the last 500 million years. Their analysis of the fossil record closely echoed a seminal 1981 study by paleontologist J. John Sepkoski — with one key difference.

Sepkoski’s ground-breaking statistical work showed abrupt ocean-wide changes in biodiversity about 490 and 250 million years ago, corresponding to two mass extinction events. These events divided marine life into what he called “three great evolutionary faunas,” each dominated by a unique set of animals.

But the new model reveals a fourth.

The fierce fight for survival that played out between predatory marine animals and their prey about 250 to 66 million years ago may have been an equally powerful force, reshaping ocean diversity into what we see today. This third grand transition was much more gradual than its predecessors and driven by organisms, rather than external processes.

“What we learned is that not all major shifts in animal life have been related to mass extinction events,” said study lead author Alexis Rojas, who earned his Ph.D. at the University of Florida. Rojas is now a postdoctoral researcher at the Integrated Science Lab, a hub dedicated to interdisciplinary research at Umeå University.

Many scientists have long held the view that external factors such as volcanic activity, asteroid impacts or changes in climate are the primary drivers of major shifts in the Earth’s biosphere, said study co-author Michal Kowalewski, Rojas’ doctoral adviser and the Florida Museum Thompson Chair of Invertebrate Paleontology.

“The fossil record tells us that some of the key transitions in the history of life were rapid changes triggered by abrupt external factors. But this study shows that some of those major transitions were more gradual and may have been driven by biological interactions between organisms,” he said.

One reason Sepkoski’s work was so revolutionary was that he took a mathematical approach to a practical problem: The fossil record is too big and complex for one person to be able to discern life’s underlying patterns by looking at specimens alone.

“When its components are examined individually or in small groups, the complexity of their form, function, interaction, and history often seems overwhelming, and almost infinite,” he wrote in the introduction to his 1981 study.

Organizing these components into a hierarchy of systems, he argued, presented a more complete view. Sepkoski’s modelling divided 500 million years of ocean life into three great dynasties, each separated by a mass extinction that cleared the way for new groups to flourish and dominate. After the reign of trilobites, clamlike animals known as brachiopods and certain ancient corals and ammonites rose to prominence. After the cataclysmic end-Permian extinction, sometimes known as the “Great Dying,” they were in turn replaced by snails, clams, crustaceans, modern corals and various kinds of bony fishes.

Sepkoski’s hypothesis fundamentally changed how scientists thought about the history of life, Kowalewski said. It offered an organized way of understanding the history of marine ecosystems — the overarching storyline and plot twists.

But as our knowledge of the fossil record grows, so does Sepkoski’s dilemma of how to analyze such vast and complex information, said Kowalewski.

“With millions of fossil specimens now documented, there is simply no feasible way for our brains to process such massive archives of paleontological data,” he said. “Fortunately, analytical methods continue to improve, giving us better ways to extract and examine information hidden inside these immensely complex data.”

Rojas took on this challenge by using the latest advancements in data modelling. Specifically, he was interested in using complex network tools to create a better representation of the fossil record. Unlike other approaches in paleobiology, complex networks use a linked structure of nodes representing physical and abstract variables to uncover underlying patterns in a given system. Network approaches can be applied to social phenomena — for example, showing a Facebook user’s patterns of interactions with friends on the platform — but they can also be applied to complex natural systems. Like Sepkoski, Rojas is a classically trained paleontologist looking for a fresh perspective on the fossil record.

“There are many processes happening at the same time at multiple scales: in your neighborhood, your country and across the entire planet. Now imagine the processes that occur in one day, one year or 500 years. What we are doing is trying to understand all these things across time,” he said.

A simple network might consist of a single layer — all records of animal life and where they lived. But Rojas and his colleagues’ network incorporates different intervals of time as individual layers, a feature lacking in previous research on macroevolution. The result is what Rojas described as a new, abstracted fossil record, a complement to the physical fossil record represented by the specimens in museum collections.

“It’s important because the questions we are asking, the processes we are studying, occur at different scales in time and space,” Rojas said. “We’ve taken some steps back so we can look at the entire fossil record. By doing that, we can explore all sorts of questions.”

Think of it like navigating a Google Earth that represents the oceans over the last 500 million years. When and where would you go?

“Our interactive map of marine life shows smaller groups of animals and their interactions within each evolutionary fauna,” Rojas said. “At the most basic levels, this map shows ocean regions with particular animals. The building blocks of our study are the individual animals themselves.”

This complex network shows what Sepkoski’s model could not capture: a gradual transition in ocean life coincident with the Mesozoic Marine Revolution, which started about 150 million years ago during the Mesozoic Era. First hypothesized in the 1970s, this revolution was caused by the rapid increase of marine predators such as bony fish, crustaceans and snails, which have dominated oceans ever since. Their proliferation drove prey to become more mobile, hide beneath the ocean floor or enhance their defenses by thickening their armor, developing spines or improving their ability to regenerate body parts.

Sepkoski knew about the Mesozoic Marine Revolution, but his model, limited by the methods and data available at the time, was unable to delineate the ocean ecosystems preceding and following this gradual transition. The study by Rojas and his colleagues demonstrates that both physical and biological processes play key roles in shaping ocean life at the highest levels.

“We are integrating the two hypotheses — the Mesozoic Marine Revolution and the three great evolutionary faunas into a single story,” Rojas said. “Instead of three phases of life, the model shows four.”

Joaquin Calatayud, Magnus Neuman and Martin Rosvall of Umeå University also co-authored the study.

Reference:
Alexis Rojas, Joaquin Calatayud, Michał Kowalewski, Magnus Neuman, Martin Rosvall. A multiscale view of the Phanerozoic fossil record reveals the three major biotic transitions. Communications Biology, 2021; 4 (1) DOI: 10.1038/s42003-021-01805-y

Note: The above post is reprinted from materials provided by Florida Museum of Natural History. Original written by Natalie Van Hoose.

Research shows we’re surprisingly similar to Earth’s first animals

Fossil of Dickinsonia, an Ediacaran-era animal. (Mary Droser/UCR)

The earliest multicellular organisms may have lacked heads, legs, or arms, but pieces of them remain inside of us today, new research shows.

According to a UC Riverside study, 555-million-year-old oceanic creatures from the Ediacaran period share genes with today’s animals, including humans.

“None of them had heads or skeletons. Many of them probably looked like three-dimensional bathmats on the sea floor, round discs that stuck up,” said Mary Droser, a geology professor at UCR. “These animals are so weird and so different, it’s difficult to assign them to modern categories of living organisms just by looking at them, and it’s not like we can extract their DNA — we can’t.”

However, well-preserved fossil records have allowed Droser and the study’s first author, recent UCR doctoral graduate Scott Evans, to link the animals’ appearance and likely behaviors to genetic analysis of currently living things. Their research on these links has been recently published in the journal Proceedings of the Royal Society B.

For their analysis, the researchers considered four animals representative of the more than 40 recognized species that have been identified from the Ediacaran era. These creatures ranged in size from a few millimeters to nearly a meter in length.

Kimberella were teardrop-shaped creatures with one broad, rounded end and one narrow end that likely scraped the sea floor for food with a proboscis. Further, they could move around using a “muscular foot” like snails today. The study included flat, oval-shaped Dickinsonia with a series of raised bands on their surface, and Tribrachidium, who spent their lives immobilized at the bottom of the sea.

Also analyzed were Ikaria, animals recently discovered by a team including Evans and Droser. They were about the size and shape of a grain of rice, and represent the first bilaterians — organisms with a front, back, and openings at either end connected by a gut. Evans said it’s likely Ikaria had mouths, though those weren’t preserved in the fossil records, and they crawled through organic matter “eating as they went.”

All four of the animals were multicellular, with cells of different types. Most had symmetry on their left and right sides, as well as noncentralized nervous systems and musculature.

Additionally, they seem to have been able to repair damaged body parts through a process known as apoptosis. The same genes involved are key elements of human immune systems, which helps to eliminate virus-infected and pre-cancerous cells.

These animals likely had the genetic parts responsible for heads and the sensory organs usually found there. However, the complexity of interaction between these genes that would give rise to such features hadn’t yet been achieved.

“The fact that we can say these genes were operating in something that’s been extinct for half a billion years is fascinating to me,” Evans said.

The work was supported by a NASA Exobiology grant, and a Peter Buck postdoctoral fellowship.

Going forward, the team is planning to investigate muscle development and functional studies to further understand early animal evolution.

“Our work is a way to put these animals on the tree of life, in some respects,” Droser said. “And show they’re genetically linked to modern animals, and to us.”

Reference:
Scott D. Evans, Mary L. Droser, Douglas H. Erwin. Developmental processes in Ediacara macrofossils. Proceedings of the Royal Society B: Biological Sciences, 2021; 288 (1945): 20203055 DOI: 10.1098/rspb.2020.3055

Note: The above post is reprinted from materials provided by University of California – Riverside. Original written by Jules Bernstein.

‘Pompeii of prehistoric plants’ unlocks evolutionary secret

 Reconstruction of the crown of Paratingia wuhaia sp. nov.
Reconstruction of the crown of Paratingia wuhaia sp. nov.

Spectacular fossil plants preserved within a volcanic ash fall in China have shed light on an evolutionary race 300 million years ago, which was eventually won by the seed-bearing plants that dominate so much of the Earth today.

New research into fossils found at the ‘Pompeii of prehistoric plants’, in Wuda, Inner Mongolia, reveals that the plants, called Noeggerathiales, were highly-evolved members of the lineage from which came seed plants.

Noeggerathiales were important peat-forming plants that lived around 325 to 251 million years ago. Understanding their relationships to other plant groups has been limited by poorly preserved examples until now.

The fossils found in China have allowed experts to work out that Noeggerathiales are more closely related to seed plants than to other fern groups.

No longer considered an evolutionary dead-end, they are now recognized as advanced tree-ferns that evolved complex cone-like structures from modified leaves. Despite their sophistication, Noeggerathiales fell victim to the profound environmental and climate changes of 251 million years ago that destroyed swamp ecosystems globally.

The international research team, led by palaeontologists at Nanjing Institute of Geology and Palaeontology and the University of Birmingham, today published its findings in the Proceedings of the National Academy of Sciences (PNAS).

Co-author Dr. Jason Hilton, Reader in Palaeobiology at the University of Birmingham’s Institute of Forest Research, commented: “Noeggerathiales were recognized as early as the 1930s, but scientists have treated them as a ‘taxonomic football’, endlessly kicked around without anyone identifying their place in the Story of Life.

“The spectacular fossil plants found in China are becoming renowned as the plant equivalent of Pompeii. Thanks to this slice of life preserved in volcanic ash, we were able to reconstruct a new species of Noeggerathiales that finally settles the group’s affinity and evolutionary importance.

“The fate of the Noeggerathiales is a stark reminder of what can happen when even very advanced life forms are faced with rapid environmental change.”

The researchers studied complete Noeggerathiales preserved in a bed of volcanic ash 66 cm thick formed 298 million years ago, smothering all the plants growing in a nearby swamp.

The ash stopped the fossils from rotting or being consumed, and preserved many complete individuals in microscopic detail.

Lead-Author Jun Wang, Professor of Palaeobotany at Nanjing Institute of Geology and Palaeontology, commented: “Many specimens were identified in excavations in 2006-2007 when a few leaves were visible on the surface of the ash. It looked they might be connected to each other and a stem below — we revealed the crown on site, but then extracted the specimens complete to take them back to the lab.

“It has taken many years to study these fully and the additional specimens we have found more recently. The complete trees are the most impressive fossil plants I have seen and because of our careful work they are also some of the most important to science.”

The researchers also deduced that that the ancestral lineage from which seed plants evolved diversified alongside the earliest seed plant radiation during the Devonian, Carboniferous and Permian periods, and did not rapidly die out as previously thought.

Reference:
Jun Wang, Jason Hilton, Hermann W. Pfefferkorn, Shijun Wang, Yi Zhang, Jiri Bek, Josef Pšenička, Leyla J. Seyfullah, David Dilcher. Ancient noeggerathialean reveals the seed plant sister group diversified alongside the primary seed plant radiation. Proceedings of the National Academy of Sciences, 2021; 118 (11): e2013442118 DOI: 10.1073/pnas.2013442118

Note: The above post is reprinted from materials provided by University of Birmingham.

Unusual earthquakes highlight central Utah volcanoes

The Cinders lava flow Utah

If you drive south through central Utah on Interstate 15 and look west somewhere around Fillmore, you’ll see smooth hills and fields of black rock. The area is, aptly, named the Black Rock Desert. It may not look like much, but you’re looking at some of Utah’s volcanoes.

A pair of earthquake sequences, in September 2018 and April 2019, focused scientists’ attention on the Black Rock Desert. The sequences, which included the main quakes and their aftershocks, were very different from the Magna earthquake that shook the Wasatch Front in 2020 and other Utah earthquakes. The Black Rock sequences were captured by the Utah Regional Seismic Network and by nearby temporary seismic equipment deployment that was monitoring a geothermal well. Earthquakes in the Black Rock Desert are rare and capturing the seismic recordings from these earthquakes provides a glimpse into the volcanic system of the Black Rock Desert that, while not showing any signs of erupting, is still active. A study of the earthquake sequences is published in Geophysical Research Letters.

“The results showed us that we should give more attention to the Black Rock area,” says Maria Mesimeri, a postdoctoral research associate with the University of Utah Seismograph Stations. “We need to improve seismic and volcanic monitoring in this area, so that we are aware of small changes that may occur.”

Not your typical earthquakes

The earthquake sequences, with main shocks of magnitude 4.0 and 4.1 respectively, were picked up by both the Utah Regional Seismic Network and a dense temporary network of seismometers deployed as part of Utah FORGE, an experimental geothermal project funded by the U.S. Department of Energy and operated by the University of Utah, located about 19 miles south of the Black Rock Desert near Milford, Utah. The temporary network allowed researchers to detect more aftershocks than usual. For example, the regional network detected 19 earthquakes as part of the April 2019 sequence. But the dense temporary network detected an additional 35 quakes. Each additional aftershock provided a bit more information for seismologists studying the sequence.

The Black Rock sequences showed some interesting features that set them apart from the 2020 Magna sequence and other Utah earthquake sequences. While the initial Magna quake occurred at a depth of about six miles below the surface, a typical depth for Utah earthquakes, the Black Rock quakes were much shallower — around 1.5 miles below the surface.

“Because these earthquakes were so shallow,” Mesimeri says, “we could measure surface deformation [due to the quakes] using satellites, which is very unusual for earthquakes this small.”

Also, Mesimeri and her colleagues found, the quakes produced much lower-frequency seismic energy than usually seen in Utah quakes. And one of the main types of seismic waves, shear waves or S-waves, wasn’t detected in the Black Rock sequences.

Volcanoes? In Utah?

All of these signs point to the Black Rock sequences having a very different origin than the Magna sequence, which was generated by movement of the Wasatch Fault. The Black Rock quakes, on the other hand, may have been generated by ongoing activity in the Black Rock volcanic field.

What are volcanoes doing in the middle of Utah? The Wasatch Mountains (and Wasatch Fault) form the eastern margin of a region called the Basin and Range province that stretches west to the Sierra Nevada. The province is being stretched apart by plate tectonics, and that stretching thins the crust, allowing more heat to rise up from the Earth’s interior. In the Black Rock area, that heat resulted in eruption of basalt lava up until around 9,000 to 12,000 years ago.

So what do these earthquake sequences mean for the volcanoes of the Black Rock Desert?

“Our findings suggest that the system is still active and that the earthquakes were probably the result of fluid-related movement in the general area,” Mesimeri says, referring to potentially magma or heated water. “The earthquakes could be the result of the fluid squeezing through rock or the result of deformation from fluid movement that stressed the surface faults.”

Activity in a volcanic field does not mean eruption, and Mesimeri says that there’s no evidence that any eruption is imminent in the Black Rock Desert. But, she says, it’s an area that geoscientists may want to monitor a little more closely.

Reference:
Maria Mesimeri, Kristine L. Pankow, William D. Barnhart, Katherine M. Whidden, J. Mark Hale. Unusual Seismic Signals in the Sevier Desert, Utah Possibly Related to the Black Rock Volcanic Field. Geophysical Research Letters, 2021; 48 (5) DOI: 10.1029/2020GL090949

Note: The above post is reprinted from materials provided by University of Utah. Original written by Paul Gabrielsen.

How do you know where volcanic ash will end up?

Volcanic plume associated with the April-May 2010 eruption of Eyjafjallajökull volcano (Iceland) and Scanning Electron Microscope image of a typical ash cluster made of micrometric volcanic particles collected on an adhesive paper during fallout. © UNIGE, Costanza Bonadonna

When the Eyjafjallajökull volcano in Iceland erupted in April 2010, air traffic was interrupted for six days and then disrupted until May. Until then, models from the nine Volcanic Ash Advisory Centres (VAACs) around the world, which aimed at predicting when the ash cloud interfered with aircraft routes, were based on the tracking of the clouds in the atmosphere. In the wake of this economic disaster for airlines, ash concentration thresholds were introduced in Europe which are used by the airline industry when making decisions on flight restrictions. However, a team of researchers, led by the University of Geneva (UNIGE), Switzerland, discovered that even the smallest volcanic ash did not behave as expected. Its results, to be read in the journal Nature Communications, will help to refine the way that volcanic ash is represented in forecasting models used by the VAACs, which must react in real-time to provide useful advice during a volcanic eruption.

The eruption of Iceland’s Eyjafjallajökull volcano in 2010 not only disrupted global air traffic, but also called into question the functioning of the forecast strategies used by the VAACs, based only on the spatial tracking of the ash cloud. A meeting of experts refined the strategies based on ash concentration thresholds and enabled flights to resume more quickly, while ensuring the safety of passengers and flight personnel.

“During a volcanic explosive eruption, fragments ranging from a few microns to more than 2 metres are ejected from the volcanic vent,” explains Eduardo Rossi, a researcher at the Department of Earth Sciences of the UNIGE Faculty of Sciences and the first author of the study. The larger the particles, the faster and closer to the volcano they fall, reducing the concentration of ash in the atmosphere. “This is why the new strategies have integrated concentration thresholds better defining the dangerousness for aircraft engines. From 2 milligrams per cubic metre, airlines must have an approved safety case to operate,” says the Geneva-based researcher.

Particle aggregates that impact predictive models

Despite existing knowledge about the ash clouds, several open questions remained unanswered after the 2010 Eyjafjallajökull eruption, including the discovery of particles in UK that were much larger than expected. “We wanted to understand how this was possible by accurately analysing the ash particles from the Sakurajima volcano in Japan, which has been erupting 2-3 times a day for more than 50 years,” says Costanza Bonadonna, a professor in the Department of Earth Sciences at UNIGE.

By using adhesive paper to collect the ash before it hit the ground, the team of scientists had already observed during the Eyjafjallajökull eruption how micrometric particles would group together into clusters, which, after the impact with the ground, were destroyed. “It plays an important role in the sedimentation rate, notes Eduardo Rossi. Once assembled in aggregates, these micrometre particles fall much faster and closer to the volcano than the models predict, because they are ultimately heavier than if they fell individually. This is called premature sedimentation. ”

The rafting effect, declared impossible by theory

In Japan the UNIGE team made a new important discovery: the observation of the rafting effect. Using a high-speed camera, the volcanologists observed the sedimentation of the ash in real-time and discovered previously unseen aggregates called cored clusters. “These are formed by a large particle of 100-800 microns — the core — which is covered by many small particles less than 60 microns, explains Costanza Bonadonna. And this external layer of small particles can act like a parachute over the core, delaying its sedimentation. This is the rafting effect. ”

This rafting effect had been theoretically suggested in 1993, but finally declared impossible. Today, its existence is well and truly proven by direct observation and accurate theoretical analysis, made possible by high-speed camera. “Working with Frances Beckett of the UK Met Office, we have carried out several simulations that have enabled us to answer the questions raised by the eruption of Eyjafjallajökull and the unexplained discovery of these oversized ash particles in UK. It was the result of this rafting effect, which delayed the fall of these aggregates,” enthuses Eduardo Rossi.

Now that the ash aggregates, the cored clusters and the rafting effect have been studied, it is a matter of collecting more accurate physical particle parameters so that one day they can be integrated into the operational models of the VAACs, for which size and density play a crucial role in calculating the concentration of ash in the atmosphere.

Note: The above post is reprinted from materials provided by Université de Genève.

Asteroid dust found in crater closes case of dinosaur extinction

 The asteroid impact led to the extinction of 75% of life, including all non-avian dinosaurs. Credit: Willgard Krause/Pixabay.
The asteroid impact led to the extinction of 75% of life, including all non-avian dinosaurs. Credit: Willgard Krause/Pixabay.

Researchers believe they have closed the case of what killed the dinosaurs, definitively linking their extinction with an asteroid that slammed into Earth 66 million years ago by finding a key piece of evidence: asteroid dust inside the impact crater.

Death by asteroid rather than by a series of volcanic eruptions or some other global calamity has been the leading hypothesis since the 1980s, when scientists found asteroid dust in the geologic layer that marks the extinction of the dinosaurs. This discovery painted an apocalyptic picture of dust from the vaporized asteroid and rocks from impact circling the planet, blocking out the sun and bringing about mass death through a dark, sustained global winter — all before drifting back to Earth to form the layer enriched in asteroid material that’s visible today.

In the 1990s, the connection was strengthened with the discovery of a 125-mile-wide Chicxulub impact crater beneath the Gulf of Mexico that is the same age as the rock layer. The new study seals the deal, researchers said, by finding asteroid dust with a matching chemical fingerprint within that crater at the precise geological location that marks the time of the extinction.

“The circle is now finally complete,” said Steven Goderis, a geochemistry professor at the Vrije Universiteit Brussel, who led the study published in Science Advances on Feb. 24.

The study is the latest to come from a 2016 International Ocean Discovery Program mission co-led by The University of Texas at Austin that collected nearly 3,000 feet of rock core from the crater buried under the seafloor. Research from this mission has helped fill in gaps about the impact, the aftermath and the recovery of life.

The telltale sign of asteroid dust is the element iridium — which is rare in the Earth’s crust, but present at elevated levels in certain types of asteroids. An iridium spike in the geologic layer found all over the world is how the asteroid hypothesis was born. In the new study, researchers found a similar spike in a section of rock pulled from the crater. In the crater, the sediment layer deposited in the days to years after the strike is so thick that scientists were able to precisely date the dust to a mere two decades after impact.

“We are now at the level of coincidence that geologically doesn’t happen without causation,” said co-author Sean Gulick, a research professor at the UT Jackson School of Geosciences who co-led the 2016 expedition with Joanna Morgan of Imperial College London. “It puts to bed any doubts that the iridium anomaly [in the geologic layer] is not related to the Chicxulub crater.”

The dust is all that remains of the 7-mile-wide asteroid that slammed into the planet millions of years ago, triggering the extinction of 75% of life on Earth, including all nonavian dinosaurs.

Researchers estimate that the dust kicked up by the impact circulated in the atmosphere for no more than a couple of decades — which, Gulick points out, helps time how long extinction took.

“If you’re actually going to put a clock on extinction 66 million years ago, you could easily make an argument that it all happened within a couple of decades, which is basically how long it takes for everything to starve to death,” he said.

The highest concentrations of iridium were found within a 5-centimeter section of the rock core retrieved from the top of the crater’s peak ring — a high-elevation point in the crater that formed when rocks rebounded then collapsed from the force of impact.

The iridium analysis was carried out by labs in Austria, Belgium, Japan and the United States.

“We combined the results from four independent laboratories around the world to make sure we got this right,” said Goderis.

In addition to iridium, the crater section showed elevated levels of other elements associated with asteroid material. The concentration and composition of these “asteroid elements” resembled measurements taken from the geologic layer at 52 sites around the world.

The core section and geologic layer also have earthbound elements in common, including sulfurous compounds. A 2019 study found that sulfur-bearing rocks are missing from much of the rest of the core despite being present in large volumes in the surrounding limestone. This indicates that the impact blew the original sulfur into the atmosphere, where it may have made a bad situation worse by exacerbating global cooling and seeding acid rain.

Gulick and colleagues at the University of Texas Institute for Geophysics and Bureau of Economic Geology — both units of the UT Jackson School — plan to return to the crater this summer to begin surveying sites at its center, where they hope to plan a future drilling effort to recover more asteroid material.

Note: The above post is reprinted from materials provided by University of Texas at Austin.

Making sense of commotion under the ocean to locate tremors near deep-sea faults

Using a method to better locate the source of weak tremors from regions with complex geological features, researchers found that many tremors originate from the shear zone, an area of high fluid pressure, in the Nankai Trough, which is schematically shown here with structures of tectonic plates and fault lines.

Researchers from Japan and Indonesia have pioneered a new method for more accurately estimating the source of weak ground vibrations in areas where one tectonic plate is sliding under another in the sea. Applying the approach to Japan’s Nankai Trough, the researchers were able to estimate previously unknown properties in the region, demonstrating the method’s promise to help probe properties needed for better monitoring and understanding larger earthquakes along this and other plate interfaces.

Episodes of small, often imperceptible seismic events known as tremors occur around the world and are particularly common in areas near volcanoes and subduction zones — regions where one of the massive plates forming Earth’s outer layers slides under another. Though they may be weak, studying these vibrations is important for estimating features of the associated tectonic plate boundaries and is necessary for detecting slipping among the plates that can be used to warn against larger earthquake events and tsunamis.

“Tremor episodes occur frequently in subduction zones, but their point of origin can be difficult to determine as they have no clear onset features like the sudden, strong shaking seen with ordinary earthquakes,” explains Takeshi Tsuji, leader of the study’s research team from Kyushu University’s International Institute for Carbon-Neutral Energy Research (I2CNER).

“Current techniques to identify their source rely on waveform readings from nearby seismic stations together with a modelling system, but complex geological structures can greatly influence the results, leading to inaccurate travel times.”

The I2CNER team developed the new methodology to take into account some of the complexities of subduction zones such as the Nankai Trough and estimate more accurate travel times from source to station. The novel approach involves a model that does not rely on a constant waveform and also considers the relationships between tremors detected at all possible pairs of monitoring stations.

“Applying this method to the Nankai Trough, we found that most tremors occurred in areas of high fluid pressure called the shear zone on the plate boundary,” says study lead author Andri Hendriyana.

“The thickness of the shear zone was found to be a major controlling factor for the tremor epicentre, with the tremor sequence initiating at regions where fluid pressures within the rocks are the greatest.”

Having better determined the locations of several tremors, the research could also more accurately estimate the speed of tremor propagation. Using this information, the team was then able to estimate how easily liquids can move through the deep fault. Known as permeability, this property is important for evaluating earthquake rupture processes and had never before been reported for the deep plate interface of the Nankai Trough.

“Accurately determining tremor source and related geophysical properties is crucial in the monitoring and modelling of larger earthquakes along the plate interface,” comments Tsuji. “Our method can also be applied in other regions where tremor location estimation is difficult because of a complex geography to better obtain this vital information.”

Reference:
Andri Hendriyana, Takeshi Tsuji. Influence of structure and pore pressure of plate interface on tectonic tremor in the Nankai subduction zone, Japan. Earth and Planetary Science Letters, 2021; 558: 116742 DOI: 10.1016/j.epsl.2021.116742

Note: The above post is reprinted from materials provided by Kyushu University.

A new, clearer insight into Earth’s hidden crystals

A transmitted light view through a 200-micron section of a peridotite sample, showing the three main minerals - olivine (clear-green), orthopyroxene (grey-green) and garnet (pink). Credit: Dr Emma Tomlinson, Trinity College Dublin.
A transmitted light view through a 200-micron section of a peridotite sample, showing the three main minerals – olivine (clear-green), orthopyroxene (grey-green) and garnet (pink). Credit: Dr Emma Tomlinson, Trinity College Dublin.

Geologists have developed a new theory about the state of Earth billions of years ago after examining the very old rocks formed in the Earth’s mantle below the continents.

Assistant Professor Emma Tomlinson from Trinity College Dublin and Queensland University of Technology’s Professor Balz Kamber have just published their research in leading international journal, Nature Communications.

The seven continents on Earth today are each built around a stable interior called a craton, and geologists believe that craton stabilisation some 2.5 — 3 billion years ago was critical to the emergence of land masses on Earth.

Little is known about how cratons and their supporting mantle keels formed, but important clues can be found in peridotite xenoliths, which are samples of mantle that are brought to the Earth’s surface by erupting volcanoes.

Dr Tomlinson, from Trinity’s School of Natural Sciences, said:

“Many rocks from the mantle below old continents contain a surprising amount of silica — much more than is found in younger parts of the mantle.”

“There is currently no scientific consensus about the reason for this.”

The new research, which looks at the global data for mantle peridotite, comes up with a new explanation for this observation.

The research used a new thermodynamic model to calculate that the unusual mineralogy developed when very hot molten rock — greater than 1700 °C — interacted with older parts of the mantle and this caused the growth of silica-rich minerals.

“For more than 1 billion years, from 3.8 to 2.5 billion years ago, volcanoes also erupted very unusual lavas of very low viscosity — lava that was very thin, very hot and often contained variable levels of silica,” Dr Tomlinson added.

“Our modelling suggests that the unusual lavas were in fact the molten rocks that interacted with the mantle at great depth and this interaction resulted in the variable level of silica.”

Professor Kamber, QUT, said:

“Both the silica-rich rocks in the deep mantle and the low viscosity volcanic rocks stopped being made by the Earth some 2.5 billion years ago. This timing is the boundary between the Archaean and Proterozoic eons — one of the most significant breaks in Earth’s geological timescale.”

What caused this boundary remains unknown, but the research offers a new perspective.

Professor Kamber added:

“This may have been due to a change in how the mantle was flowing. Once the mantle started slowly turning over all the way down to the core (2,900 km), the very high temperatures of the Archaean eon were no longer possible.”

Reference:
Tomlinson, E.L., Kamber, B.S. Depth-dependent peridotite-melt interaction and the origin of variable silica in the cratonic mantle. Nat Commun, 2021 DOI: 10.1038/s41467-021-21343-9

Note: The above post is reprinted from materials provided by Trinity College Dublin.

World’s oldest DNA reveals how mammoths evolved

1.2 million year old mammoth tooth from the Krestovka mammoth. Credit: Pavel Nikolskiy

An international team led by researchers at the Centre for Palaeogenetics in Stockholm has sequenced DNA recovered from mammoth remains that are up to 1.2 million years old. The analyses show that the Columbian mammoth that inhabited North America during the last ice age was a hybrid between the woolly mammoth and a previously unknown genetic lineage of mammoth. In addition, the study provides new insights into when and how fast mammoths became adapted to cold climate. These findings are published today in Nature.

Around one million years ago there were no woolly or Columbian mammoths, as they had not yet evolved. This was the time of their predecessor, the ancient steppe mammoth. Researchers have now managed to analyse the genomes from three ancient mammoths, using DNA recovered from mammoth teeth that had been buried for 0.7-1.2 million years in the Siberian permafrost.

This is the first time that DNA has been sequenced and authenticated from million-year-old specimens, and extracting the DNA from the samples was challenging. The scientists found that only minute amounts of DNA remained in the samples and that the DNA was degraded into very small fragments.

“This DNA is incredibly old. The samples are a thousand times older than Viking remains, and even pre-date the existence of humans and Neanderthals,” says senior author Love Dalén, a Professor of evolutionary genetics at the Centre for Palaeogenetics in Stockholm.

The age of the specimens was determined using both geological data and the molecular clock. Both these types of analyses showed that two of the specimens are more than one million years old, whereas the third is roughly 700 thousand years old and represents one of the earliest known woolly mammoths.

An unexpected origin of the Columbian mammoth

Analyses of the genomes showed that the oldest specimen, which was approximately 1.2 million years old, belonged to a previously unknown genetic lineage of mammoth. The researchers refer to this as the Krestovka mammoth, based on the locality where it was found. The results show that the Krestovka mammoth diverged from other Siberian mammoths more than two million years ago.

“This came as a complete surprise to us. All previous studies have indicated that there was only one species of mammoth in Siberia at that point in time, called the steppe mammoth. But our DNA analyses now show that there were two different genetic lineages, which we here refer to as the Adycha mammoth and the Krestovka mammoth. We can’t say for sure yet, but we think these may represent two different species,” says the study’s lead author Tom van der Valk.

The researchers also suggest that it was mammoths that belonged to the Krestovka lineage that colonised North America some 1.5 million years ago. In addition, the analyses show that the Columbian mammoth that inhabited North America during the last ice age, was a hybrid. Roughly half of its genome came from the Krestovka lineage and the other half from the woolly mammoth.

“This is an important discovery. It appears that the Columbian mammoth, one of the most iconic Ice Age species of North America, evolved through a hybridisation that took place approximately 420 thousand years ago,” says co-lead author Patrícia Pec?nerova?.

Evolution and adaptation in the woolly mammoth

The second million-year-old genome, from the Adycha mammoth, appears to have been ancestral to the woolly mammoth. The researchers could therefore compare its genome with the genome from one of the earliest known woolly mammoths that lived 0.7 million years ago, as well as with mammoth genomes that are only a few thousand years old. This made it possible to investigate how mammoths became adapted to a life in cold environments and to what extent these adaptations evolved during the speciation process.

The analyses showed that gene variants associated with life in the Arctic, such as hair growth, thermoregulation, fat deposits, cold tolerance and circadian rhythms, were already present in the million-year-old mammoth, long before the origin of the woolly mammoth. These results indicate that most adaptations in the mammoth lineage happened slowly and gradually over time.

“To be able to trace genetic changes across a speciation event is unique. Our analyses show that most cold adaptations were present already in the ancestor of the woolly mammoth, and we find no evidence that natural selection was faster during the speciation process,” says co-lead author David Di?ez-del-Molino.

Future research

The new results open the door for a broad array of future studies on other species. About one million years ago was a period when many species expanded across the globe. This was also a time period of major changes in climate and sea levels, as well as the last time that Earth’s magnetic poles changed places. Because of this, the researchers think that genetic analyses on this time scale have great potential to explore a wide range of scientific questions.

“One of the big questions now is how far back in time we can go. We haven’t reached the limit yet. An educated guess would be that we could recover DNA that is two million years old, and possibly go even as far back as 2.6 million. Before that, there was no permafrost where ancient DNA could have been preserved,” says Anders Götherström, a professor in molecular archaeology and joint research leader at the Centre for Palaeogenetics.

Reference:
van der Valk, T., Pečnerová, P., Díez-del-Molino, D. et al. Million-year-old DNA sheds light on the genomic history of mammoths. Nature, 2021 DOI: 10.1038/s41586-021-03224-9

Note: The above post is reprinted from materials provided by Stockholm University.

Proegernia mikebulli : New Australian fossil lizard

Swamp Skink (Lissolepis coventryi), which is probably the living lizard most similar to the new fossil. Photo: Dr Mark Hutchinson, SA Museum / Flinders University, a co-author. Credit: Dr Mark Hutchinson, SA Museum / Flinders University

Some of Australia’s most famous animals—wombat, platypus, kangaroos and the extinct marsupial tiger thylacine—have been traced back to their fossil ancestors in remarkable finds in central South Australia.

Now a remote expedition to a large inland salt lake in 2017 has sifted through remains unearthed in Namba Formation deposits to describe a tiny new skink, an ancestor of Australia’s well-known bluetongue lizards—to be named in honor of world-renown Flinders University lizard researcher Professor Mike Bull.

The new species, unveiled in the Royal Society’s Open Science today, is described as Australia’s oldest—a 25 million-year-old skink named Proegernia mikebulli after the late Flinders University Professor Mike Bull.

It was found by Flinders University and South Australian Museum palaeontologists and volunteers at a rich fossil site on Lake Pinpa located on the 602,000 square hectare Frome Downs Station, seven hours drive north of capital city Adelaide.

Following the crusted shoreline of a salt lake, the team homed in on a cross section of sediments where fossil excavations of ancestors of koala, a predatory bird, and fragments of a thylacine were previously unearthed. Remains of prehistoric fish, platypus, dolphins and crocodilians have also been found nearby.

“It was 45 C in the shade that day and hard work digging through the clay, but it was definitely worth it once the tiniest of bone fragments turned out to be those of the oldest Australian skink,” says lead author palaeo-herpetologist Dr. Kailah Thorn, who conducted the research at Flinders University as part of her Ph.D.

The once-verdant interior of Australia is considered the cradle of Australia’s unique fauna and in particular its reptile diversity.

“Fossil lizards are often too small to be identified when you’re in the field. Lizard skulls are made of more than 20 individual bones that all disarticulate when they fossilize,” says Dr. Thorn, who now works as curator of the Edward de Courcy Clarke Earth Sciences Museum at the University of Western Australia.

The discovery of the tiny fossil lizards in an area the size of one million soccer fields was enabled by building an understanding of the geology of the region, and targeting fossiliferous bands of silt to thoroughly sieve and sort back at the lab, she explains.

“These lizard fossils owe their discovery to the patient sorting of tiny bones,” says lead author, vertebrate palaeontologist Flinders University Associate Professor Trevor Worthy. “A teaspoon holds hundreds of tiny bones—all revealed in translucent splendor under a microscope.”

“Once every 30 spoons something else is found among the fish—usually a tiny mammal tooth. But the 2017 discovery of the oldest skink was a golden moment for a palaentologist,” he says.

When researchers placed the fossil in the evolutionary tree of lizards, it was found to be an early member of the Australian skink subfamily Egerniinae—the group now encompassing bluetongues, sleepy lizards (shinglebacks), land mullets and spiny-tailed skinks.

The newly described lizard Proegernia mikebulli is named after the late Flinders University Professor Mike Bull, who passed away suddenly in late 2016.

Inspired generations of Australian herpetologists, Professor Bull’s wide-ranging research career centered on social skinks from the Egerniinae subfamily, their behavior, parasites, and conservation.

“Our colleague Professor Bull’s long-term ecological studies of sleepy lizards were a massive contribution to biology,” says co-author Matthew Flinders Professor Mike Lee (Flinders University / SA Museum).

“The fossil record is essentially data from a long-term natural ecological study, so its fitting that this fossil lizards is named after in honor of Mike.”

Reference:
A new species of Proegernia from the Namba Formation in South Australia and the early evolution and environment of Australian egerniine skinks, Royal Society Open Science, royalsocietypublishing.org/doi/10.1098/rsos.201686

Note: The above post is reprinted from materials provided by Flinders University.

Slow motion precursors give earthquakes the fast slip

Matthew Siegfried inspects a GPS device, powered by a solar panel at Whillans Ice Plain. Credit: Grace Barcheck/Cornell University

At a glacier near the South Pole, earth scientists have found evidence of a quiet, slow-motion fault slip that triggers strong, fast-slip earthquakes many miles away, according to Cornell University research published in Science Advances.

During an earthquake, a fast slip happens when energy builds up underground and is released quickly along a fault. Blocks of earth rapidly slide against one another.

However, at an Antarctic glacier called Whillans Ice Plain, the earth scientists show that “slow slips” precede dozens of large magnitude 7 earthquakes. “We found that there is almost always a precursory ‘slow slip’ before an earthquake,” said lead author Grace Barcheck, research associate in Earth and Atmospheric Sciences at Cornell University.

Barcheck said that these slow-slip precursors — occurring as far as 20 miles away from the epicenter — are directly involved in starting the earthquake. “These slow slips are remarkably common,” she said, “and they migrate toward where the fast earthquake slip starts.”

Observations before several large tsunami-generating magnitude 8 and 9 earthquakes on subduction zone faults suggest a similar process may have occurred, according to Patrick Fulton, assistant professor and Croll Sesquicentennial Fellow in the Department of Earth and Atmospheric Sciences.

As these faults are mostly offshore and deep underwater, and because it is difficult to know when or where a large earthquake will occur, the start of large earthquakes is generally hard to observe.

To overcome these challenges, the scientists placed GPS sensors above an icy glacial fault at Whillans Ice Plain, where large magnitude 7 earthquakes occur nearly twice a day over a 60-mile-wide area of the glacier.

Within a period of two months in 2014, the group captured 75 earthquakes at the bottom of the Antarctic glacier. Data from GPS stations indicated that 73 — or 96% — of the 75 earthquakes showed a period of precursory slow motion.

The data from the GPS tracking stations and surface seismometers allowed the team to identify how the slow precursory slip triggers the fast earthquake slip.

“Our group was a little surprised to see so many precursors,” Barcheck said.

“In some cases, we can actually see the migration of the earthquake precursor towards where the earthquake begins.”

“Before we pored over the data, I thought that if we saw any precursors before the earthquakes, they would be rare and in the same place as the earthquake epicenter,” she said. “Instead, we found many slow-slip precursors — starting miles from the epicenters and migrating across the fault.”

Reference:
G. Barcheck, E. E. Brodsky, P. M. Fulton, M. A. King, M. R. Siegfried, S. Tulaczyk. Migratory earthquake precursors are dominant on an ice stream fault. Science Advances, 2021; 7 (6): eabd0105 DOI: 10.1126/sciadv.abd0105

Note: The above post is reprinted from materials provided by Cornell University. Original written by Blaine Friedlander.

Subduction may recycle less water than thought

The Middle America Trench, seen here as a dark blue strip off the Pacific coast of Central America, is a surface feature of a subduction zone extending from Mexico to Costa Rica. Credit: NOAA

When one tectonic plate dives beneath another at a subduction zone, it recycles huge amounts of water and other chemicals into Earth’s mantle. The sinking plate carries seawater trapped in sediments and crust or chemically bound in minerals like serpentine. Later release of this water in the mantle contributes to key geological processes, such as earthquakes and the formation of volcano-feeding magma.

By volume, the largest portion of a subducting plate is its bottom layer, which comprises upper mantle material. Estimates of the amount of water in down-going slabs of upper mantle vary widely: Some suggest that worldwide, subduction zones have swallowed more than two oceans’ worth of water in the past 540 million years. However, new research by Miller et al. suggests that water transport at the Middle America Trench subduction zone is an order of magnitude less than previously estimated.

As a plate approaches a subduction zone, it bends downward, causing faults to form. Models and earlier observations have suggested that this bending and faulting allow seawater to infiltrate into the upper mantle, where it fills cracks in fault zones, reacts with olivine to produce serpentine, and is later carried deeper into the subduction zone.

Previous estimates of how much water reaches the upper mantle along bending faults have relied on measurements of the speed of seismic waves as they pass through a subducting plate. However, those measurements and estimates could not discern whether the upper mantle layer is uniformly hydrated or whether water is confined to bending fault zones.

To address that limitation, the new study accounted for seismic anisotropy characterizing how the speed of seismic waves depends on the direction they travel through a material. The researchers used data collected by seafloor seismometers to measure seismic anisotropy along the Middle America Trench near Nicaragua, which enabled a much more detailed picture of upper mantle hydration.

The data revealed that in the region studied, water storage in the upper mantle is limited to serpentinized fault zones that thin rapidly with depth, suggesting that fault dynamics and serpentinization reaction kinetics prevent seawater from hydrating the mantle between bending faults. New estimates of water transport that incorporate this finding are an order of magnitude lower than previous estimates for the Middle America Trench. Because the same processes occur at other subduction zones, the researchers report that far less water may be transported worldwide than previously estimated.

Reference:
Nathaniel C. Miller et al. Limited Mantle Hydration by Bending Faults at the Middle America Trench, Journal of Geophysical Research: Solid Earth (2020). DOI: 10.1029/2020JB020982

Note: The above post is reprinted from materials provided by American Geophysical Union. The original article was written by Sarah Stanley.

Fujitsu leverages world’s fastest supercomputer and AI to predict tsunami flooding

An overview of tsunami prediction with AI Credit: Tohoku University, University of Tokyo, and Fujitsu Laboratories

A new AI model that harnesses the power of the world’s fastest supercomputer, Fugaku, can rapidly predict tsunami flooding in coastal areas before the tsunami reaches land.

The development of the new technology was announced as part of a joint project between the International Research Institute of Disaster Science (IREDeS) at Tohoku University, the Earthquake Research Institute at the University of Tokyo, and Fujitsu Laboratories.

The 2011 Great East Japan Earthquake and subsequent tsunami highlighted the shortcomings in disaster mitigation and the need to utilize information for efficient and safe evacuations.

While tsunami observation networks in Japanese coastal waters have been strengthened since then, using the data produced from those networks to predict a tsunami’s path once it hits land has gained greater urgency. This is especially true since a major earthquake is likely to hit Japan’s densely populated east coast sometime in the near future.

Tsunami prediction technologies will allow authorities to obtain accurate information quickly and aid them in effectively directing evacuation orders.

Fujitsu, Tohoku University, and The University of Tokyo leveraged the power of Fugaku to generate training data for 20,000 possible tsunami scenarios based on high-resolution simulations. These scenarios were used to streamline an AI model that uses offshore waveform data generated by the tsunami to predict flooding before landfall at high spatial resolution.

Conventional prediction technologies require the use of supercomputers and make rapid prediction systems difficult to implement. The current AI model, however, can be run in seconds on ordinary PCs.

When the model was applied to a simulation of tsunami flooding in Tokyo Bay following a large earthquake, it achieved highly accurate predictions with a regular PC within seconds. The results matched tsunami flooding of the tsunami source models released by the Cabinet Office of Japan.

The research team will continue to make use of Fugaku’s high-speed performance in the future by training the system with additional tsunami scenarios. Doing so will help realize AI that can predict tsunami flooding over even wider areas.

Note: The above post is reprinted from materials provided by Tohoku University.

The comet that killed the dinosaurs

Comet
Representative Image: Comet

It was tens of miles wide and forever changed history when it crashed into Earth about 66 million years ago.

The Chicxulub impactor, as it’s known, left behind a crater off the coast of Mexico that spans 93 miles and goes 12 miles deep. Its devastating impact brought the reign of the dinosaurs to an abrupt and calamitous end by triggering their sudden mass extinction, along with the end of almost three-quarters of the plant and animal species then living on Earth.

The enduring puzzle has always been where the asteroid or comet that set off the destruction originated, and how it came to strike the Earth. And now a pair of Harvard researchers believe they have the answer.

In a study published in Scientific Reports, Avi Loeb, Frank B. Baird Jr. Professor of Science at Harvard, and Amir Siraj ’21, an astrophysics concentrator, put forth a new theory that could explain the origin and journey of this catastrophic object and others like it.

Using statistical analysis and gravitational simulations, Loeb and Siraj show that a significant fraction of a type of comet originating from the Oort cloud, a sphere of debris at the edge of the solar system, was bumped off-course by Jupiter’s gravitational field during its orbit and sent close to the sun, whose tidal force broke apart pieces of the rock. That increases the rate of comets like Chicxulub (pronounced Chicks-uh-lub) because these fragments cross the Earth’s orbit and hit the planet once every 250 to 730 million years or so.

“Basically, Jupiter acts as a kind of pinball machine,” said Siraj, who is also co-president of Harvard Students for the Exploration and Development of Space and is pursuing a master’s degree at the New England Conservatory of Music. “Jupiter kicks these incoming long-period comets into orbits that bring them very close to the sun.”

It’s because of this that long-period comets, which take more than 200 years to orbit the sun, are called sun grazers, he said.

“When you have these sun grazers, it’s not so much the melting that goes on, which is a pretty small fraction relative to the total mass, but the comet is so close to the sun that the part that’s closer to the sun feels a stronger gravitational pull than the part that is farther from the sun, causing a tidal force” he said. “You get what’s called a tidal disruption event and so these large comets that come really close to the sun break up into smaller comets. And basically, on their way out, there’s a statistical chance that these smaller comets hit the Earth.”

The calculations from Loeb and Siraj’s theory increase the chances of long-period comets impacting Earth by a factor of about 10, and show that about 20 percent of long-period comets become sun grazers. That finding falls in line with research from other astronomers.

The pair claim that their new rate of impact is consistent with the age of Chicxulub, providing a satisfactory explanation for its origin and other impactors like it.

“Our paper provides a basis for explaining the occurrence of this event,” Loeb said. “We are suggesting that, in fact, if you break up an object as it comes close to the sun, it could give rise to the appropriate event rate and also the kind of impact that killed the dinosaurs.”

Loeb and Siraj’s hypothesis might also explain the makeup of many of these impactors.

“Our hypothesis predicts that other Chicxulub-size craters on Earth are more likely to correspond to an impactor with a primitive (carbonaceous chondrite) composition than expected from the conventional main-belt asteroids,” the researchers wrote in the paper.

This is important because a popular theory on the origin of Chicxulub claims the impactor is a fragment of a much larger asteroid that came from the main belt, which is an asteroid population between the orbit of Jupiter and Mars. Only about a tenth of all main-belt asteroids have a composition of carbonaceous chondrite, while it’s assumed most long-period comets have it. Evidence found at the Chicxulub crater and other similar craters that suggests they had carbonaceous chondrite.

This includes an object that hit about 2 billion years ago and left the Vredefort crater in South Africa, which is the largest confirmed crater in Earth’s history, and the impactor that left the Zhamanshin crater in Kazakhstan, which is the largest confirmed crater within the last million years.

The researchers say that composition evidence supports their model and that the years the objects hit support both their calculations on impact rates of Chicxulub-sized tidally disrupted comets and for smaller ones like the impactor that made the Zhamanshin crater. If produced the same way, they say those would strike Earth once every 250,000 to 730,000 years.

Loeb and Siraj say their hypothesis can be tested by further studying these craters, others like them, and even ones on the surface of the moon to determine the composition of the impactors. Space missions sampling comets can also help.

Aside from composition of comets, the new Vera Rubin Observatory in Chile may be able to see the tidal disruption of long-period comets after it becomes operational next year.

“We should see smaller fragments coming to Earth more frequently from the Oort cloud,” Loeb said. “I hope that we can test the theory by having more data on long-period comets, get better statistics, and perhaps see evidence for some fragments.”

Loeb said understanding this is not just crucial to solving a mystery of Earth’s history but could prove pivotal if such an event were to threaten the planet again.

“It must have been an amazing sight, but we don’t want to see that side,” he said.

Reference:
Siraj, A., Loeb, A. . Breakup of a long-period comet as the origin of the dinosaur extinction. Sci Rep, 2021 DOI: 10.1038/s41598-021-82320-2

Note: The above post is reprinted from materials provided by Harvard University. Original written by Juan Siliezar.

Related Articles