back to top
27.8 C
New York
Sunday, April 27, 2025
Home Blog Page 291

Richest marine reptile fossil bed along Africa’s South Atlantic coast is dated at 71.5 mya

Chemostratigraphy and magnetostratigraphy of Bentiaba section. Credit: Strganac

A new study uses carbon isotope dating to determine the first precise age for this bed, and ties the western coast of Africa to 30 million years of global geologic records

Paleontologists at Southern Methodist University have measured the carbon isotopes in marine fossils to precisely date for the first time 30 million years of sediments along Africa’s South Atlantic shoreline.
The researchers matched the pattern of ratios of carbon-13 and carbon-12 isotopes in marine fossils from Africa’s South Atlantic shoreline to known patterns of carbon ratios in fossils found elsewhere in the world. From that they determined the age of the coastal sediments at a fossil locality near the southern Angolan village of Bentiaba, said paleontologist Christopher Strganac, lead author on the study.

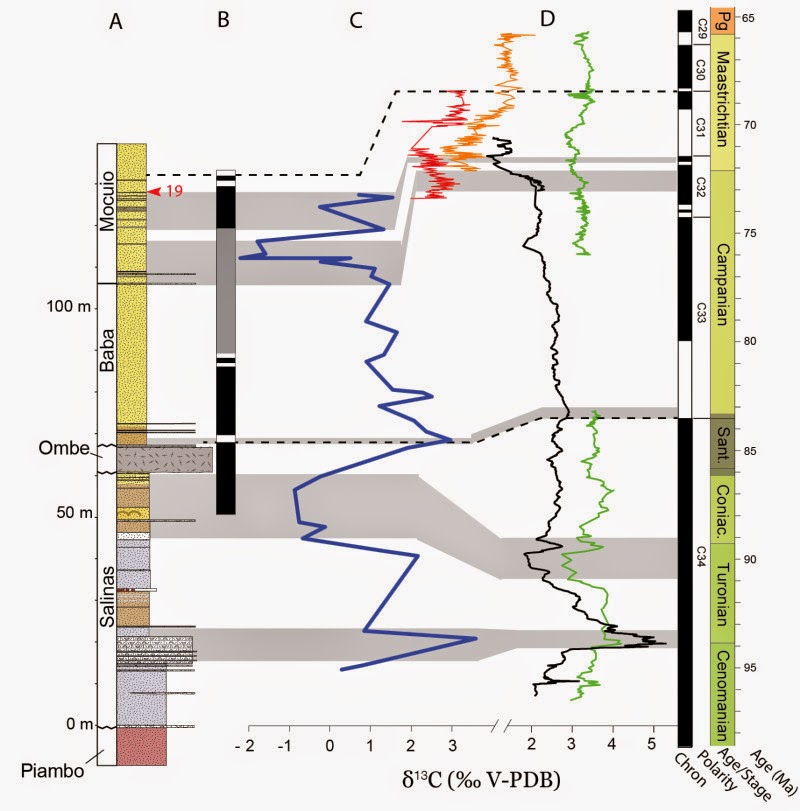
The analysis focused on a sequence of shoreline sediments totaling 140 meters thick. Their age spans a timeline of nearly 30 million years, from 95 million years ago to 68 million years ago. That period was about 40 million years after Africa and South America split, allowing the South Atlantic Ocean to slowly emerge.

The analysis revealed that the richest marine reptile fossil bed on Africa’s South Atlantic dated to 71.5 million years ago, he said. This new date at the Bentiaba locality is more than 2 million years older than the estimated date of about 69 million years previously assigned to those marine beds by earlier researchers.

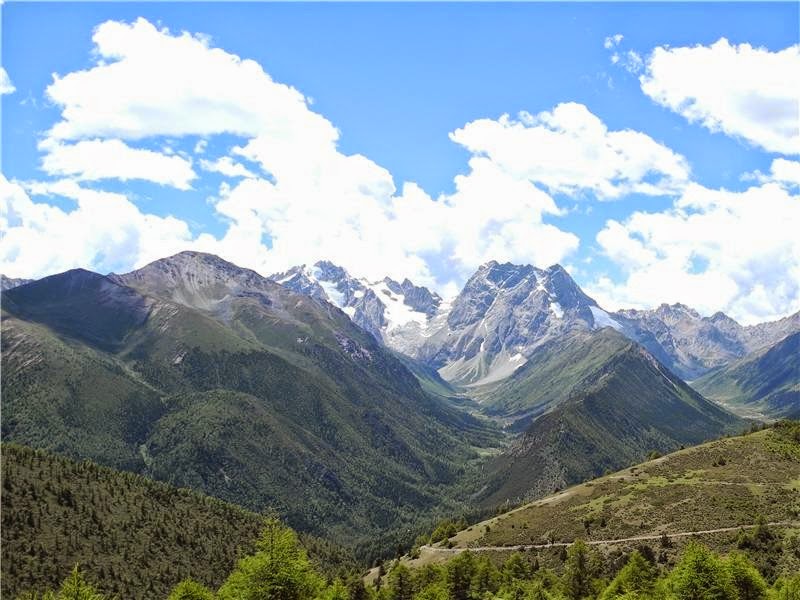
Africa’s South Atlantic coast is remarkable in plate tectonics as the place where part of the prehistoric supercontinent Gondwana split 130 million years ago into what we now call Africa and South America.

“The precise age for these rocks allows better understanding of the ancient life and environments at Bentiaba by placing them accurately within the history of the ancient South Atlantic,” said Strganac, a doctoral student in SMU’s Roy M. Huffington Department of Earth Sciences. “It’s a benchmark now from the Southern Hemisphere with which we can better understand ancient life at that time.”

The precise dating was made possible by new scientific dating techniques. The age of the rocks hadn’t previously been assessed because Africa’s South Atlantic shore — noted for its puzzle-like fit with South America — has few localities with well-exposed rocks of this age. Also, it has been essentially unexplored by scientific expeditions since the 1960s largely because war and unrest prevented exploration in the previous century.

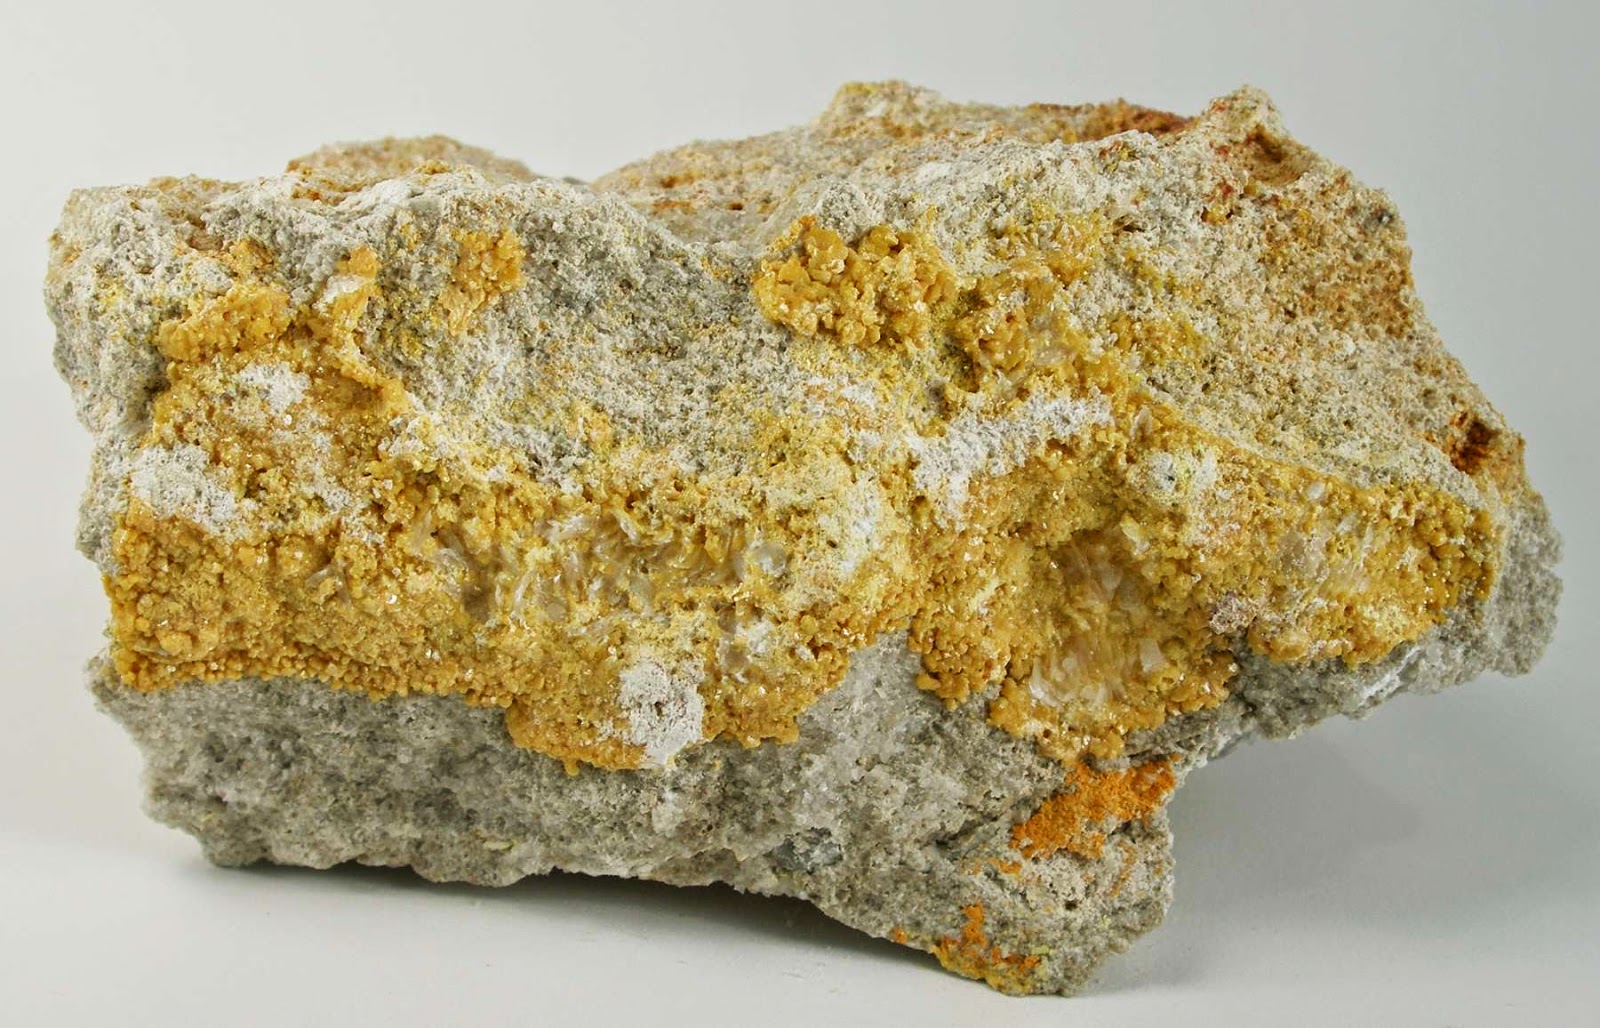
The new measurements stem from the work of Projecto PaleoAngola, an international team of scientists who in recent years have explored Angola and discovered an abundance of fossils. Their discoveries include the bones of dinosaurs, whales, mosasaurs and other ancient life from what is the richest marine reptile fossil bed along the South Atlantic coast.

Strganac and his co-authors report their findings in the Journal of African Earth Sciences.

“This improvement in understanding the ages of the rocks along the shore is a great first step in trying to understand the climatic and evolutionary events that accompanied the growth of this ocean,” said vertebrate paleontologist Louis L. Jacobs, also a co-author on the study and co-leader of Projecto PaleoAngola. Jacobs describes Angola as “an untapped frontier” for fossil hunters.

Aids in new knowledge of climate, temperature and vegetation

Scientists have recognized since the 1960s that ancient supercontinents split apart and their remnants drifted to the current positions of today’s continents over the course of millions of years. One of the results was the creation of vast new oceans. Little is known of the vertebrate life that lived during that time along the eastern and western margins of the emerging South Atlantic Ocean.

Fossils being discovered now by Projecto PaleoAngola hold the key to understanding the South Atlantic Ocean’s ancient past. Analysis of the fossils sheds light on the paleoenvironment, including changes in climate, temperature, vegetation and ecology.

The geologic time period covered by the 30-million-year sequence represents the Late Cretaceous. Studies have shown it was a period of dramatic change in climate, beginning with one of the warmest periods on Earth, then starting to transition to cooler climates, Strganac said.

Determining carbon ratios allowed comparison with global geologic events

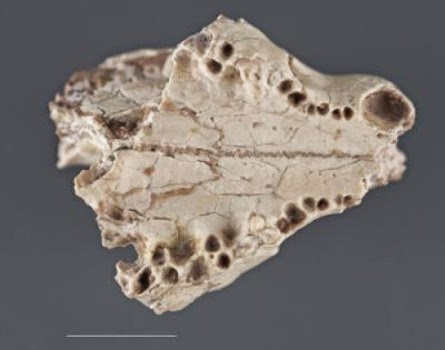
To discover the age of the sediments, Strganac tested 55 fossil shells of ancient oysters and clams from 40 different rock layers on the coast. Testing determined the ratio of stable carbon isotopes, carbon-13 and carbon-12, in each shell. Because these isotopes do not decay with time, the relative abundance of each relates to the ocean when the shells formed. These isotope ratios can be compiled as a sequence with the rock layers, producing a pattern of carbon isotope change in the ancient oceans through millions of years. To accurately date the rocks, Strganac matched the pattern in isotope ratios in the shell record at Angola with the pattern known from ancient geologic events that occurred elsewhere in the world.

Specifically, the red rift-valley layers at Bentiaba were deposited as Africa and South America began to split. Also observed in the layers are a reversal in Earth’s magnetic polarity at 71.4 million to 71.64 million years to delimit the age of marine fossils; rocks deposited in the South Atlantic Ocean 93.9 million years ago during an oceanic anoxic event; and rocks south of Bentiaba that bracket the mass extinction of dinosaurs at 66 million years.

Besides comparing the stable carbon isotopes, other measuring techniques included: magnetostratigraphy, which measures the ancient polarity of Earth’s magnetic field when various sedimentary layers were deposited; and argon-argon radiometric dating of a volcanic basalt layer at the site, which measures the radioactive decay of potassium to argon and dates the cooling of the volcanic lava to 85 million years ago.

“Adding a new ocean to the globe, in this case the South Atlantic, has many long-lasting effects,” said SMU’s Jacobs. “One obvious example is the formation of energy resources found along the coasts of Brazil and Angola.”

Note : The above story is based on materials provided by Southern Methodist University. The original article was written by Margaret Allen.

California mountains rise as groundwater depleted in state’s Central Valley: May trigger small earthquakes

GPS measurements show that the Sierra Nevada and Coast Ranges rise several millimeters per year (red dots) as a result of groundwater pumping in the Central Valley (brown). Blue dots are sites where the ground has subsided. Credit: Image courtesy of UC Berkeley

Winter rains and summer groundwater pumping in California’s Central Valley make the Sierra Nevada and Coast Ranges sink and rise by a few millimeters each year, creating stress on the state’s earthquake faults that could increase the risk of a quake.

Gradual depletion of the Central Valley aquifer because of groundwater pumping also raises these mountain ranges by a similar amount each year — about the thickness of a dime — with a cumulative rise over the past 150 years of up to 15 centimeters (6 inches), according to calculations by a team of geophysicists.

While the seasonal changes in the Central Valley aquifer have not yet been firmly associated with any earthquakes, studies have shown that similar levels of periodic stress, such as that caused by the motions of the moon and sun, increase the number of microquakes on the San Andreas Fault, which runs parallel to the mountain ranges. If these subtle seasonal load changes are capable of influencing the occurrence of microquakes, it is possible that they can sometimes also trigger a larger event, said Roland Bürgmann, UC Berkeley professor of earth and planetary science at UC Berkeley.

“The stress is very small, much less than you need to build up stress on a fault toward an earthquake, but in some circumstances such small stress changes can be the straw that broke the camel’s back; it could just give that extra push to get a fault to fail,” Bürgmann said.

Bürgmann is a coauthor of a report published online this week by the journal Nature. The study, based on detailed global positioning satellite (GPS) measurements from California and Nevada between 2007 and 2010, was led by former UC Berkeley postdoctoral fellows Colin Amos, now at Western Washington University, and Pascal Audet, now of the University of Ottawa. The detailed GPS analysis was performed by William C. Hammond and Geoffrey Blewitt of the University of Nevada, Reno.

Draining of Central Valley

Water has been pumped from California’s Central Valley for more than 150 years, reducing what used to be a marsh and extensive lake, Tulare Lake, into fertile agricultural fields that feed the world. In that time, approximately 160 cubic kilometers (40 cubic miles) of water was removed — the capacity of Lake Tahoe — dropping the water table in some areas more than 120 meters (400 feet) and the ground surface 5 meters (16 feet) or more.

The weight of water removed allowed the underlying crust or lithosphere to rise by so-called isostatic rebound, which has raised the Sierra probably as much as half a foot since about 1860, Bürgmann said.

The same rebound happens as a result of the state’s seasonal rains. Torrential winter storms drop water and snow across the state, which eventually flow into Central Valley streams, reservoirs and underground aquifer, pushing down the crust and lowering the Sierra 1-3 millimeters. In the summer, water flow through the delta into the Pacific Ocean, evaporation and ground water pumping for irrigation, which has accelerated in the past few years because of a drought, allows the crust and surrounding mountains to rise again.

Bürgmann said that the flexing of Earth’s crust downward in winter would clamp the San Andreas Fault tighter, lowering the risk of quakes, while in summer the upward flexure would relieve this clamping and perhaps increase the risk.

“The hazard is ever so slightly higher in the summer than in the wintertime,” he said. “This suggests that climate and tectonics interact; that water changes ultimately affect the deeper Earth too.”

High-resolution mapping with continuous GPS

Millimeter-precision measurements of elevation have been possible only in the last few years, with improved continuous GPS networks — part of the National Science Foundation-funded Plate Boundary Observatory, which operates 1,100 stations around the western U.S. — and satellite-based interferometric synthetic aperture radar (InSAR). Synthetic aperture radar is a form of radar in which phase information is used to map elevation.

These measurements revealed a steady yearly rise of the Sierra of 1-2 millimeters per year, which was initially ascribed to tectonic activity deep underground, even though the rate was unusually high, Bürgmann said. The new study provides an alternative and more reasonable explanation for the rise of the Sierra in historic times.

“The Coast Range is doing the same thing as the Sierra Nevada, which is part of the evidence that this can’t be explained by tectonics,” he said. “Both ranges have uplifted over the last few years and they both exhibit the same seasonal up and down movement in phase. This tells us that something has to be driving the system at a seasonal and long-term sense, and that has to be groundwater recharging and depletion.”

In response to the current drought, about 30 cubic kilometers (7.5 cubic miles) of water were removed from Central Valley aquifers between 2003 and 2010, causing a rise of about 10 millimeters (2/5 inch) in the Sierra over that time.

After the new results were shared with colleagues, Bürgmann said, some geologists suggested that the state could get a better or at least comparable inventory of available water each year by using GPS to measure ground deformation instead of measuring snowpack and reservoir levels.

Other coauthors are Colin B. Amos of Western Washington University in Bellingham, Ingrid A. Johanson of UC Berkeley. Funding for the research came from NSF EarthScope and UC Berkeley’s Miller Institute.

Note : The above story is based on materials provided by University of California – Berkeley. The original article was written by Robert Sanders

Kulanite

Brazilianite, Kulanite, Siderite, Apatite Locality: Big Fish River, Dawson Mining District, Yukon Territory, Canada (Locality at mindat.org) Size: miniature, 5.2 x 3.4 x 1.2 cm © Rob Lavinsky / iRocks

Chemical Formula: Ba(Fe2+,Mn2+,Mg)2(Al,Fe3+)2(PO4)3(OH)3
Locality: Rapid Creek (Cross Cut Creek), Big Fish River, Yukon Territories, Canada.
Name Origin: Named for Alan Kulan (1921-1977), prospector who found the first specimen.

Kulandite is a very rare barium phosphate mineral. It is one of the rare minerals that are making their way out of the Yukon Territory and into the mineral market.

History

Discovery date : 1976
Town of Origin : RAPID CREEK, BIG FISH RIVER/BLOW RIVER AREA, YUKON
Country of Origin : CANADA

Optical properties

Optical and misc. Properties : Transparent to Translucent
Refractive Index : from 1,70 to 1,72
Axial angle 2V: 32°

Physical Properties

Cleavage: {010} Good, {100} Good
Color: Blue, Blue green, Green, Black green.
Density: 3.91
Diaphaneity: Transparent to Translucent
Hardness: 4 – Fluorite
Luminescence: Non-fluorescent.
Luster: Vitreous – Adamantine
Streak: greenish white

Photos :

Kulanite, Quartz 4.8×2.2×2.0 cm Rapid Creek Canada Copyright © David K. Joyce Minerals
Kulanite, Siderite 3.6×3.6×2.0 cm Rapid Creek Yukon, Canada Copyright © David K. Joyce Minerals
Rapid Creek, Dawson Mining District, Yukon Territory, Canada © Tony Peterson

Against the current with lava flows

The gigantic gorge system Noctis Labyrinthus and Valles Marineris were created exclusively through the erosive force of immense lava flows. (Image: google.com/mars)

An Italian astronomer in the 19th century first described them as ‘canali’ – on Mars’ equatorial region, a conspicuous net-like system of deep gorges known as the Noctis Labyrinthus is clearly visible. The gorge system, in turn, leads into another massive canyon, the Valles Marineris, which is 4,000 km long, 200 km wide and 7 km deep. Both of these together would span the US completely from east to west.

As these gorges, when observed from orbit, resemble terrestrial canyons formed by water, most researchers assumed that immense flows of water must have carved the Noctis Labyrinthus and the Valles Marineris into the surface of Mars. Another possibility was that tectonic activity had created the largest rift valley on a planet in our solar system.

Lava flows caused the gorges

These assumptions were far from the mark, says Giovanni Leone, a specialist in planetary volcanism in the research group of ETH professor Paul Tackley. Only lava flows would have had the force and mass required to carve these gigantic gorges into the surface of Mars. The study was recently published in the Journal of Volcanology and Geothermal Research.

In recent years, Leone has examined intensively the structure of these canyons and their outlets into the Ares Vallis and the Chryse Planitia, a massive plain on Mars’ low northern latitude. He examined thousands of high-resolution surface images taken by numerous Mars probes, including the latest from the Mars Reconnaissance Orbiter, and which are available on the image databases of the US Geological Survey.

No discernible evidence of erosion by water

His conclusion is unequivocal: “Everything that I observed on those images were structures of lava flows as we know them on Earth,” he emphasises. “The typical indicators of erosion by water were not visible on any of them.” Leone therefore does not completely rules out water as final formative force. Evidence of water, such as salt deposits in locations where water evaporated from the ground or signs of erosion on the alluvial fans of the landslides, are scarce but still existing. “One must therefore ask oneself seriously how Valles Marineris could have been created by water if one can not find any massive and widespread evidence of it.” The Italian volcanologist similarly could find no explanation as to where the massive amounts of water that would be required to form such canyons might have originated.

Source region of lava flows identified

The explanatory model presented by Leone in his study illustrates the formation history from the source to the outlet of the gorge system. He identifies the volcanic region of Tharsis as the source region of the lava flows and from there initial lava tubes stretched to the edge of the Noctis Labyrinthus. When the pressure from an eruption subsided, some of the tube ceilings collapsed, leading to the formation of a chain of almost circular holes, the ‘pit chains’.

When lava flowed again through the tubes, the ceilings collapsed entirely, forming deep V-shaped troughs. Due to the melting of ground and rim material, and through mechanical erosion, the mass of lava carved an ever-deeper and broader bed to form canyons. The destabilised rims then slipped and subsequent lava flows carried away the debris from the landslides or covered it. “The more lava that flowed, the wider the canyon became,” says Leone.

Leone supported his explanatory model with height measurements from various Mars probes. The valleys of the Noctis Labyrinthus manifest the typical V-shape of ‘young’ lava valleys where the tube ceilings have completely collapsed. The upper rims of these valleys, however, have the same height. If tectonic forces had been at work, they would not be on the same level, he says. The notion of water as the formative force, in turn, is undermined by the fact that it would have taken tens of millions of cubic kilometres of water to carve such deep gorges and canyons. Practically all the atmospheric water of all the ages of Mars should have been concentrated only on Labyrinthus Noctis. Moreover, the atmosphere on Mars is too thin and the temperatures too cold. Water that came to the surface wouldn’t stay liquid, he notes: “How could a river of sufficient force and size even form?”

Life less likely

Leone’s study could have far-reaching consequences. “If we suppose that lava formed the Noctis Labyrinthus and the Valles Marineris, then there has always been much less water on Mars than the research community has believed to date,” he says. Mars received very little rain in the past and it would not have been sufficient to erode such deep and large gorges. He adds that the shallow ocean north of the equator was probably much smaller than imagined – or hoped for; it would have existed only around the North Pole. The likelihood that life existed, or indeed still exists, on Mars is accordingly much lower.

Leone can imagine that the lava tubes still in existence are possible habitats for living organisms, as they would offer protection from the powerful UV rays that pummel the Martian surface. He therefore proposes a Mars mission to explore the lava tubes. He considers it feasible to send a rover through a hole in the ceiling of a tube and search for evidence of life. “Suitable locations could be determined using my data,” he says.

Swimming against the current

With his study, the Italian is swimming against the current and perhaps dismantling a dogma in the process. Most studies of the past 20 years have been concerned with the question of water on Mars and how it could have formed the canyons. Back in 1977, a researcher first posited the idea that the Valles Marineris may have been formed by lava, but the idea failed to gain traction. Leone says this was due to the tunnel vision that the red planet engenders and the prevailing mainstream research. The same story has been told for decades, with research targeted to that end, without achieving a breakthrough. Leone believes that in any case science would only benefit in considering other approaches. “I expect a spirited debate,” he says. “But my evidence is strong.”

Rrference:
Leone G. A network of lava tubes as the origin of Labyrinthus Noctis and Valles Marineris on Mars. Journal of Volcanology and Geothermal Research, 277 (2014), 1-8. Published online 1 Mai 2014. DOI: 10.1016/j.jvolgeores.2014.01.011

Note : The above story is based on materials provided by Eidgenössische Technische Hochschule Zürich

Ancient giant sperm discovered at Riversleigh World Heritage Fossil Site

This is an artist’s impression of Bitesantennary Site 17 million years ago. The cave was in the middle of a vast biologically diverse rainforest in an area that is now part of the Riversleigh World Heritage Fossil Site in northwestern Queensland, Australia. Tiny ostracods lived in a pool of water in the cave that was continually enriched by the droppings of thousands of bats. Artwork by Dorothy Dunphy, from the book Riversleigh, By M.Archer, S.J.Hand and H.Godthelp, published in 1991 by Reed Books. Credit: Credit: Dorothy Dunphy.

Preserved giant sperm from tiny shrimps that lived at least 17 million years ago have been discovered at the Riversleigh World Heritage Fossil Site by a team including UNSW Australia researchers.

The giant sperm are thought to have been longer than the male’s entire body, but are tightly coiled up inside the sexual organs of the fossilised freshwater crustaceans, which are known as ostracods.

“These are the oldest fossilised sperm ever found in the geological record,” says Professor Mike Archer, of the UNSW School of Biological, Earth and Environmental Sciences, who has been excavating at Riversleigh for more than 35 years.

“The Riversleigh fossil deposits in remote northwestern Queensland have been the site of the discovery of many extraordinary prehistoric Australian animals, such as giant, toothed platypuses and flesh-eating kangaroos. So we have become used to delightfully unexpected surprises in what turns up there.

“But the discovery of fossil sperm, complete with sperm nuclei, was totally unexpected. It now makes us wonder what other types of extraordinary preservation await discovery in these deposits.”

The study is published in the journal Proceedings of the Royal Society B.

A UNSW research team led by Professor Archer, Associate Professor Suzanne Hand and Henk Godthelp collected the fossil ostracods from Bitesantennary Site at Riversleigh in 1988.

They were sent to John Neil, a specialist ostracod researcher at La Trobe University, who realised they contained fossilised soft tissues.

He drew this to the attention of European specialists, including the lead author on the paper, Dr Renate Matzke-Karasz, from Ludwig Maximilian University of Munich, Germany, who examined the specimens with Dr Paul Tafforeau at the European Synchrotron Radiation Facility in Grenoble, France.

The microscopic study revealed the fossils contain the preserved internal organs of the ostracods, including their sexual organs. Within these are the almost perfectly preserved giant sperm cells, and within them, the nuclei that once contained the animals’ chromosomes and DNA.

Also preserved are the Zenker organs – chitinous-muscular pumps used to transfer the giant sperm to the female. The researchers estimate the fossil sperm are about 1.3 millimetres long, about the same length or slightly longer than the ostracod itself.

“About 17 million years ago, Bitesantennary Site was a cave in the middle of a vast biologically diverse rainforest. Tiny ostracods thrived in a pool of water in the cave that was continually enriched by the droppings of thousands of bats,” says Professor Archer.

UNSW’s Associate Professor Suzanne Hand, who is a specialist in extinct bats and their ecological role in Riversleigh’s ancient environments, says the bats could have played a role in the extraordinary preservation of the ostracod sperm cells.

The steady rain of poo from thousands of bats in the cave would have led to high levels of phosphorous in the water, which could have aided mineralisation of the soft tissues.

“This amazing discovery at Riversleigh is echoed by a few examples of soft-tissue preservation in fossil bat-rich deposits in France. So the key to eternal preservation of soft tissues may indeed be some magic ingredient in bat droppings,” says Associate Professor Hand.

Previous discoveries of extraordinary preservation at Riversleigh include insects with internal muscles that have been preserved because bacteria became fossilised as they attempted to consume the soft tissues of these creatures.

Perfectly preserved cells of leaves have been found, as well as the preserved soft tissue of eyeballs in the eye sockets of some of the extinct marsupials.

Note : The above story is based on materials provided by University of New South Wales

Krohnkite

Krohnkite Location:  Chiquicamata, Chile. Scale: 3.5 x 2 cm. Copyright: © John Veevaert

Chemical Formula: Na2Cu(SO4)2·2H2O
Locality: Chuquicamata, Calama, Antofagásta Province, Chile.
Name Origin: Named after B. Kroehnke, who was the first person to analyze it.

Kröhnkite ( Na2Cu(SO4)2·2H2O ) is a rare copper sulfate mineral named after B. Kröhnke who first researched it.

Discovery and occurrence

Kröhnkite was first researched after an occurrence in the Chuquicamata Mine, Chile, and has been reported from a number of locations in the Atacama region. Associated minerals in the discovery location include; atacamite, blodite, chalcanthite, antlerite and natrochalcite. It occurs in the oxidized zone of copper deposits in arid environments.

History

Discovery date : 1876
Town of Origin : CHUQUICAMATA, ANTOFAGASTA
Country of Origin: CHILE

Physical Properties

Cleavage: {010} Perfect, {011} Good
Color: Blue, Dark sky blue, Greenish blue, Yellowish green.
Density: 2.06 – 2.9, Average = 2.48
Diaphaneity: Transparent to Translucent
Fracture: Conchoidal – Fractures developed in brittle materials characterized by smoothly curving surfaces, (e.g. quartz).
Hardness: 2.5-3 – Finger Nail-Calcite
Luster: Vitreous (Glassy)
Streak: white

Photos :

Krohnkite from Chuquicamata mine, El Loa Prov., Antofagasta, Chile © Dakota Matrix Minerals, Inc.
Mineral: Kröhnkite Locality: Chuquicamata, Antofagasta, Chile (Type Locality for Krohnkite) Overall Size: 15x6x6 cm Crystals: 1-12 cm © JohnBetts-FineMinerals
Chuquicamata Mine, Chuquicamata District, Calama, El Loa Province, Antofagasta Region, Chile © Rob Lavinsky, IRocks “irocks.com”

Paleontologists discover new fossil organism

This image shows a reconstruction of Plexus ricei. Credit: Droser Lab, UC Riverside.

RIVERSIDE, Calif. — Scientists at the University of California, Riverside have discovered a fossil of a newly discovered organism from the “Ediacara Biota” — a group of organisms that occurred in the Ediacaran period of geologic time.

Named Plexus ricei and resembling a curving tube, the organism resided on the Ediacaran seafloor. Plexus ricei individuals ranged in size from 5 to 80 centimeters long and 5 to 20 millimeters wide. Along with the rest of the Ediacara Biota, it evolved around 575 million years ago and disappeared from the fossil record around 540 million years ago, just around the time the Cambrian Explosion of evolutionary history was getting under way.

“Plexus was unlike any other fossil that we know from the Precambrian,” said Mary L. Droser, a professor of paleontology, whose lab led the research. “It was bilaterally symmetrical at a time when bilaterians—all animals other than corals and sponges—were just appearing on this planet. It appears to have been very long and flat, much like a tapeworm or modern flatworm.”

Study results appeared online last month in the Journal of Paleontology.

“Ediacaran fossils are extremely perplexing: they don’t look like any animal that is alive today, and their interrelationships are very poorly understood,” said Lucas V. Joel, a former graduate student at UC Riverside and the first author of the research paper. Joel worked in Droser’s lab until June 2013.

He explained that during the Ediacaran there was no life on land. All life that we know about for the period was still in the oceans.

“Further, there was a complete lack of any bioturbation in the oceans at that time, meaning there were few marine organisms churning up marine sediments while looking for food,” he said. “Then, starting in the Cambrian period, organisms began churning up and mixing the sediment.”

According to the researchers, the lack of bioturbators during the Ediacaran allowed thick films of (probably) photosynthetic algal mats to accumulate on ocean floors—a very rare environment in the oceans today. Such an environment paved the way for many mat-related lifestyles to evolve, which become virtually absent in the post-Ediacaran world.

“The lack of bioturbation also created a very unique fossil preservational regime,” Joel said. “When an organism died and was buried, it formed a mold of its body in the overlying sediment. As the organism decayed, sediment from beneath moved in to form a cast of the mold the organism had made in the sediment above. What this means is that the fossils we see in the field are not the exact fossils of the original organism, but instead molds and casts of its body.”

Paleontologists have reported that much of the Ediacara Biota was comprised of tubular organisms. The question that Droser and Joel addressed was: Is Plexus ricei a tubular organism or is it an organism that wormed its way through the sand, leaving a trail behind it?

“In the Ediacaran we really need to know the difference between the fossils of actual tubular organisms and trace fossils because if the fossil we are looking at is a trace fossil, then that has huge implications for the earliest origins of bilaterian animals—organisms with bilateral symmetry up and down their midlines and that can move independently of environment forces,” Joel said. “Being able to tell the difference between a tubular organism and a trace fossil has implications for the earliest origins of bilaterian organism, which are the only kinds of creatures that could have constructed a tubular trace fossil. Plexus is not a trace fossil. What our research shows is that the structure we see looks very much like a trace fossil, but is in fact a new Ediacaran tubular organism, Plexus ricei.”

Plexus ricei was so named for plexus, meaning braided in Latin, a reference to the organism’s morphology, and ricei for Rice, the last name of the South Australian Museum’s Dennis Rice, one of the field assistants who helped excavate numerous specimens of the fossil.

“At this time, we don’t know for sure that Plexus ricei was a bilateral but it is likely that it was related to our ancestors,” Droser said.

Note : The above story is based on materials provided by University of California – Riverside

Comet theory false: Doesn’t explain Ice Age cold snap, Clovis changes, animal extinction

New research shows that a comet didn’t spark climate change at the end of the Ice Age, killing the Clovis peoples and causing mass animal extinction. Credit: © underb / Fotolia

Most supposed impact indicators at 29 sites are too old or too young to be remnants of an ancient comet that proponents claim sparked climate change at the end of the Ice Age, killed America’s earliest people and caused a mass animal extinction.

Controversy over what sparked the Younger Dryas, a brief return to near glacial conditions at the end of the Ice Age, includes a theory that it was caused by a comet hitting Earth.

As proof, proponents point to sediments containing deposits they believe could result only from a cosmic impact.

Now a new study disproves that theory, said archaeologist David Meltzer, Southern Methodist University, Dallas. Meltzer is lead author on the study and an expert in the Clovis culture, the peoples who lived in North America at the end of the Ice Age.

Meltzer’s research team found that nearly all sediment layers purported to be from the Ice Age at 29 sites in North America and on three other continents are actually either much younger or much older.

Scientists agree that the brief episode at the end of the Ice Age — officially known as the Younger Dryas for a flower that flourished at that time — sparked widespread cooling of Earth 12,800 years ago and that this cool period lasted for 1,000 years. But theories about the cause of this abrupt climate change are numerous. They range from changes in ocean circulation patterns caused by glacial meltwater entering the ocean to the cosmic-impact theory.

The cosmic-impact theory is said to be supported by the presence of geological indicators that are extraterrestrial in origin. However a review of the dating of the sediments at the 29 sites reported to have such indicators proves the cosmic-impact theory false, said Meltzer.

Meltzer and his co-authors found that only three of 29 sites commonly referenced to support the cosmic-impact theory actually date to the window of time for the Ice Age.

The findings, “Chronological evidence fails to support claim of an isochronous widespread layer of cosmic impact indicators dated to 12,800 years ago,” were reported May 12, 2014, in the Proceedings of the National Academy of Sciences.

Co-authors were Vance T. Holliday and D. Shane Miller, both from the University of Arizona; and Michael D. Cannon, SWCA Environmental Consultants Inc., Salt Lake City, Utah.

“The supposed impact markers are undated or significantly older or younger than 12,800 years ago,” report the authors. “Either there were many more impacts than supposed, including one as recently as 5 centuries ago, or, far more likely, these are not extraterrestrial impact markers.”

Dating of purported Younger Dryas sites proves unreliable

The Younger Dryas Impact Hypothesis rests heavily on the claim that there is a Younger Dryas boundary layer at 29 sites in the Americas and elsewhere that contains deposits of supposed extraterrestrial origin that date to a 300-year span centered on 12,800 years ago.

The deposits include magnetic grains with iridium, magnetic microspherules, charcoal, soot, carbon spherules, glass-like carbon containing nanodiamonds, and fullerenes with extraterrestrial helium, all said to result from a comet or other cosmic event hitting Earth.

Meltzer and his colleagues tested that hypothesis by investigating the existing stratigraphic and chronological data sets reported in the published scientific literature and accepted as proof by cosmic-impact proponents, to determine if these markers dated to the onset of the Younger Dryas.

They sorted the 29 sites by the availability of radiometric or numeric ages and then the type of age control, if available, and whether the age control is secure.

The researchers found that three sites lack absolute age control: at Chobot, Alberta, the three Clovis points found lack stratigraphic context, and the majority of other diagnostic artifacts are younger than Clovis by thousands of years; at Morley, Alberta, ridges are assumed without evidence to be chronologically correlated with Ice Age hills 2,600 kilometers away; and at Paw Paw Cove, Maryland, horizontal integrity of the Clovis artifacts found is compromised, according to that site’s principal archaeologist.

The remaining 26 sites have radiometric or other potential numeric ages, but only three date to the Younger Dryas boundary layer.

At eight of those sites, the ages are unrelated to the supposed Younger Dryas boundary layer, as for example at Gainey, Michigan, where extensive stratigraphic mixing of artifacts found at the site makes it impossible to know their position to the supposed Younger Dryas boundary layer. Where direct dating did occur, it’s sometime after the 16th century A.D.

At Wally’s Beach, Alberta, a radiocarbon age of 10,980 purportedly dates extraterrestrial impact markers from sediment in the skull of an extinct horse. In actuality, the date is from an extinct musk ox, and the fossil yielding the supposed impact markers was not dated, nor is there evidence to suggest that the fossils from Wally’s Beach are all of the same age or date to the Younger Dryas onset.

At nearly a dozen other sites, the authors report, the chronological results are neither reliable nor valid as a result of significant statistical flaws in the analysis, the omission of ages from the models, and the disregard of statistical uncertainty that accompanies all radiometric dates.

For example, Lake Cuitzeo, Mexico, Meltzer and his team used the data of previous researchers and applied a fifth-order polynomial regression, but it returned a different equation that put the cosmic-impact markers at a depth well above that which would mark the Younger Dryas onset.

The authors go on to point out that inferences about the ages of supposed Younger Dryas boundary layers are unsupported by replication in more cases than not.

In North America, the Ice Age was marked by the mass extinction of several dozen genera of large mammals, including mammoths, mastodons, American horses, Western camels, two types of deer, ancient bison, giant beaver, giant bears, sabre-toothed cats, giant bears, American cheetahs, and many other animals, as well as plants.

Note : The above story is based on materials provided by Southern Methodist University.

Krennerite

Krennerite from Nagyág, Hunedoara Co., Romania 2mm striated crystal. © Dakota Matrix Minerals, Inc.

Chemical Formula: (Au,Ag)Te2
Locality: Sacarâmb (Nagyág, Szekerembe), Transylvania, Romania.
Name Origin: Named for Joseph A. Krenner (1839-1920), Hungarian mineralogist.

Krennerite is an orthorhombic gold telluride mineral which can contain a relatively small amount of silver in the structure. The formula is AuTe2 varying to (Au0.8,Ag0.2)Te2. Both of the chemically similar gold-silver tellurides, calaverite and sylvanite, are in the monoclinic crystal system, whereas krennerite is orthorhombic.

The color varies from silver-white to brass-yellow. It has a specific gravity of 8.53 and a hardness of 2.5. It occurs in high temperature, hydrothermal environments.

Krennerite was discovered in 1878 in Sacaramb, Romania, and first described by the Hungarian mineralogist Joseph Krenner (1839–1920).

Physical Properties

Color:  White, Blackish yellow.
Density: 8.53
Diaphaneity: Opaque
Fracture: Conchoidal – Uneven – Uneven fracture producing small, conchoidal fragments.
Hardness: 2.5 – Finger Nail
Luminescence: Non-fluorescent.
Luster: Metallic
Streak: greenish gray

Photos :

Mineral: Calaverite, Krennerite, Sylvanite Locality: El Paso Mine, Cripple Creek District, Teller County, Colorado Overall Size:    5x3x2.5 cm Crystals: 1-3 mm © JohnBetts-FineMinerals
Mineral: Krennerite (rare telluride of gold) Locality: Cripple Creek, Teller County, Colorado Overall Size:    15x10x3 cm Crystals: .5-5 mm © JohnBetts-FineMinerals
Sacarîmb (Nagyag in Hungary), Romania © Dakota Matrix Minerals, Inc.
Cresson Mine, Eclipse Gulch, Cripple Creek District, Teller Co., Colorado, USA © Brent Thorne 2008

Satellite view of volcanoes finds the link between ground deformation and eruption

© Southern Methodist University

Using satellite imagery to monitor which volcanoes are deforming provides statistical evidence of their eruption potential, according to a new study in Nature Communications.

The European Space Agency’s Sentinel satellite, launched April 3, should allow scientists to test this link in greater detail and eventually develop a forecast system for all volcanoes, including those that are remote and inaccessible.

Volcano deformation and, in particular, uplift are often considered to be caused by magma moving or pressurizing underground. Magma rising towards the surface could be a sign of an imminent eruption. On the other hand, many other factors influence volcano deformation and, even if magma is rising, it may stop short, rather than erupting.

Satellite interferometric synthetic aperture radar, called InSAR for short, is a spaceborne imaging technology that will help scientists understand how volcanoes work, according to study co-author and geophysicist Zhong Lu, Southern Methodist University in Dallas.

“InSAR will aid in the prediction of future eruptions,” said Lu, a professor and Shuler-Foscue Chair of geophysics in SMU’s Roy M. Huffington Department of Earth Sciences. “At SMU, we are developing and applying this technique to track motions of volcanic activities, landslide movements, land subsidence and building stability, among other events.”

Juliet Biggs, the University of Bristol in England, led the study. Biggs looked at the archive of satellite data covering more than 500 volcanoes worldwide, many of which have been systematically observed for more than 18 years.

Satellite radar can provide high-resolution maps of deformation, allowing the detection of unrest at many volcanoes that might otherwise go unrecognized. Such satellite data is often the only source of information for remote or inaccessible volcanoes.

The researchers, who included scientists from Cornell University and Oxford University also, applied statistical methods more traditionally used for medical diagnostic testing and found that many deforming volcanoes also erupted (46 percent). Together with the very high proportion of non-deforming volcanoes that did not erupt (94 percent), these jointly represent a strong indicator of a volcano’s long-term eruptive potential.

“The findings suggest that satellite radar is the perfect tool to identify volcanic unrest on a regional or global scale and target ground-based monitoring,” Biggs said.

New technology may improve forecasting of volcanic eruptions

The work was co-funded by the U.K. Centre for Observation and Modelling of Earthquakes, Volcanoes and Tectonics and STREVA, a research consortium aimed at finding ways to reduce the negative consequences of volcanic activity on people and their assets.

“Improving how we anticipate activity using new technology such as this is an important first step in doing better at forecasting and preparing for volcanic eruptions,” said STREVA Principal Investigator Jenni Barclay.

Global studies of volcano deformation using satellite data will increasingly play a part in assessing eruption potential at more and more volcanoes, said researcher Willy Aspinall, University of Bristol, especially in regions with short historical records or limited conventional monitoring.

However, many factors and processes, some observable, but others not, influence deformation to a greater or lesser extent. These include the type of rock that forms the volcano, its tectonic characteristics and the supply rate and storage depth of magma beneath it. Thus deformation can have different implications for different types of volcanoes.

For volcanoes with short eruption cycles the satellite record typically spans episodes that include both deformation and eruption, resulting in a high correlation between the two. For volcanoes with long eruption cycles the satellite record tends to capture either deformation or eruption but rarely both.

Seismological data indicate unrest before eruption may only be a few days

In the past, radar images of the majority of the world’s volcanoes were only acquired a few times a year, but seismological data indicate that the duration of unrest before an eruption might be as short as only a few days.

“This study demonstrates what can be achieved with global satellite coverage even with limited acquisitions,” Biggs said, “so we are looking forward to the step-change in data quantity planned for the next generation of satellites.”

The European Space Agency launched its latest radar mission, Sentinel-1, in early April. The mission is designed for global monitoring and will collect images every six to twelve days. Using this, scientists should be able to test the causal and temporal relationship with deformation on much shorter timescales.

“This study is particularly exciting because Sentinel-1 will soon give us systematic observations of the ups and downs of every volcano on the planet,” said Tim Wright, director of the U.K. Centre for Observation and Modelling of Earthquakes. “For many places, particularly in developing countries, these data could provide the only warning of an impending eruption.”

Note : The above story is based on materials provided by Southern Methodist University

Hydrologists find Mississippi River network’s buffering system for nitrates is overwhelmed

The map shows the fractional amount of surface water that is likely to enter the hyporheic zone, where it can undergo filtration. Orange and red represent areas experiencing a lower fraction of water entering the hyporheic zone. Dark blue areas approach 100 percent likelihood water will enter the zone. Credit: Kiel and Cardenas, Jackson School of Geosciences, The University of Texas at Austin.

A new method of measuring the interaction of surface water and groundwater along the length of the Mississippi River network adds fresh evidence that the network’s natural ability to chemically filter out nitrates is being overwhelmed.

The research by hydrogeologists at The University of Texas at Austin, which appears in the May 11 edition of the journal Nature Geoscience, shows for the first time that virtually every drop of water coursing through 311,000 miles (500,000 kilometers) of waterways in the Mississippi River network goes through a natural filtering process as it flows to the Gulf of Mexico.

The analysis found that 99.6 percent of the water in the network passes through filtering sediment along the banks of creeks, streams and rivers.

Such a high level of chemical filtration might sound positive, but the unfortunate implication is that the river’s natural filtration systems for nitrates appear to be operating at or very close to full capacity. While further research is needed, this would make it unlikely that natural systems can accommodate the high levels of nitrates that have made their way from farmland and other sources into the river network’s waterways.

As a result of its filtration systems being overwhelmed, the river system operates less as a buffer and more as a conveyor belt, transporting nitrates to the Gulf of Mexico. The amount of nitrates flowing into the gulf from the Mississippi has already created the world’s second biggest dead zone, an oxygen-depleted area where fish and other aquatic life can’t survive.

The research, conducted by Bayani Cardenas, associate professor of hydrogeology, and Brian Kiel, a Ph.D. candidate in geology at the university’s Jackson School of Geosciences, provides valuable information to those who manage water quality efforts, including the tracking of nitrogen fertilizers used to grow crops in the Midwest, in the Mississippi River network.

“There’s been a lot of work to understand surface-groundwater exchange,” said Aaron Packman, a professor in the Department of Civil and Environmental Engineering at Northwestern University. “This is the first work putting together a physics-based estimate on the scale of one of these big rivers, looking at the net effect of nitrate removal in big river systems.”

The Mississippi River network includes the Ohio River watershed on the east and the Missouri River watershed in the west as well as the Mississippi watershed in the middle.

Using detailed, ground-level data from the United States Geological Survey (USGS) and Environmental Protection Agency, Cardenas and Kiel analyzed the waterways for sinuosity (how much they bend and curve); the texture of the materials along the waterways; the time spent in the sediment (known as the hyporheic zone); and the rate at which the water flows through the sediment.

The sediment operates as a chemical filter in that microbes in the sand, gravel and mud gobble up compounds such as oxygen and nitrates from the water before the water discharges back into the stream. The more time the water spends in sediment, the more some of these compounds are transformed to potentially more environmentally benign forms.

One compound, nitrate, is a major component of inorganic fertilizers that has helped make the area encompassed by the Mississippi River network the biggest producer of corn, soybeans, wheat, cattle and hogs, in the United States.

But too much nitrogen robs water of oxygen, resulting in algal blooms and dead zones.

While the biggest source of nitrates in the Mississippi River network are industrial fertilizers, nitrates also come from animal manure, urban areas, wastewater treatment and other sources, according to USGS.

Cardenas and Kiel found that despite an image of water flowing freely downstream, nearly each drop gets caught up within the bank at one time or another. But not much of the water—only 24 percent—lingers long enough for nitrate to be chemically extracted.

The “residence times” when water entered the hyporheic zones ranged from less than an hour in the river system’s headwaters to more than a month in larger, meandering channels. A previous, unrelated study of hyporheic zones found that a residence time of about seven hours is required to extract nitrogen from the water.

Cardenas said the research provides a large-scale, holistic view of the river network’s natural buffering mechanism and how it is failing to operate effectively.

“Clearly for all this nitrate to make it downstream tells us that this system is very overwhelmed,” Cardenas said.

The new model, he added, can be a first step to enable a wider analysis of the river system.

When a river system gets totally overwhelmed, “You lose the chemical functions, the chemical buffering,” said Cardenas. “I don’t know whether we’re there already, but we are one big step closer to the answer now.”

Note : The above story is based on materials provided by University of Texas at Austin

Kottigite

Mineral: Köttigite-Parasymplesite Locality: Mina Ojuela, Mapimi, Durango, Mexico Overall Size:    5x3x2 cm Crystals: 3 mm © JohnBetts-FineMinerals

Chemical Formula: Zn3(AsO4)2·8H2O
Locality: Daniel mine, Scheeberg, Saxony, Germany.
Name Origin: Named for Otto Köttig (1824-1892), chemist of Schneeberg, Saxony, Germany.
Köttigite is a rare hydrated zinc arsenate which was discovered in 1849 and named by James Dwight Dana in 1850 in honour of Otto Friedrich Köttig (1824 – 1892), a German chemist from Schneeberg, Saxony, who made the first chemical analysis of the mineral. It has the formula Zn3(AsO4)2·8H2O and it is a dimorph of metaköttigite, which means that the two minerals have the same formula, but a different structure: köttigite is monoclinic and metaköttigite is triclinic. There are several minerals with similar formulae but with other cations in place of the zinc. Iron forms parasymplesite Fe2+3(AsO4)2.8H2O; cobalt forms the distinctively coloured pinkish purple mineral erythrite Co3(AsO4)2.8H2O and nickel forms annabergite Ni3(AsO4)2.8H2O. Köttigite forms series with all three of these minerals and they are all members of the vivianite group.

Physical Properties

Color: Red, Brownish.
Density: 3.33
Diaphaneity: Translucent
Hardness: 2.5-3 – Finger Nail-Calcite
Luster: Silky

Photos :

Parasymplesite with Kottigite Ojuela Mine, Mapimi, Mun. de Mapimi, Durango, Mexico Size: 8.0 x 8.0 x 4.5 cm (small cabinet) danweinrich
Köttigite var. Cobaltoan St. Daniel Mine, Neustädtel, Schneeberg District, Erzgebirge, Saxony, Germany (Type Locality) Specimen weight:36 gr. Crystal size:sub-mm Overall size: 50mm x 26 mm x 26 mm minservice
Kottigite from Mina Ojuela, Mapimi, Durango, Mexico © Dakota Matrix Minerals, Inc.
This sample of kottigite is displayed in the Smithsonian Museum of Natural History. Kottigite The sample is about 4×6 cm and is from Mapimi, Durango, Mexico.
Ojuela Mine, Mapimí, Mun. de Mapimí, Durango, Mexico © Rob Lavinsky

Ice-loss moves the Earth 250 miles down

Antarctic iceberg. Scientists have shown for the first time how the mantle below Earth’s crust in the Antarctic Peninsula is flowing much faster than expected, probably due to subtle changes in temperature or chemical composition. Credit: © Goinyk Volodymyr / Fotolia

An international research team led by Newcastle University, UK, reveal Earth’s mantle under Antarctica is at a lower viscosity and moving at such a rapid rate it is changing the shape of the land at a rate that can be recorded by GPS.

At the surface, Antarctica is a motionless and frozen landscape. Yet hundreds of miles down the Earth is moving at a rapid rate, new research has shown.

The study, led by Newcastle University, UK, and published this week in Earth and Planetary Science Letters, explains for the first time why the upward motion of Earth’s crust in the Northern Antarctic Peninsula is currently taking place so quickly.

Previous studies have shown Earth is ‘rebounding’ due to the overlying ice sheet shrinking in response to climate change. This movement of the land was understood to be due to an instantaneous, elastic response followed by a very slow uplift over thousands of years.

But GPS data collected by the international research team, involving experts from Newcastle University, UK; Durham University; DTU, Denmark; University of Tasmania, Australia; Hamilton College, New York; the University of Colorado and the University of Toulouse, France, has revealed that the land in this region is actually rising at a phenomenal rate of 15mm a year — much greater than can be accounted for by the present-day elastic response alone.

And they have shown for the first time how the mantle below Earth’s crust in the Antarctic Peninsula is flowing much faster than expected, probably due to subtle changes in temperature or chemical composition.

This means it can flow more easily and so responds much more quickly to the lightening load hundreds of miles above it, changing the shape of the land.

Lead researcher, PhD student Grace Nield, based in the School of Civil Engineering and Geosciences at Newcastle University, explains: “You would expect this rebound to happen over thousands of years and instead we have been able to measure it in just over a decade. You can almost see it happening which is just incredible.

“Because the mantle is ‘runnier’ below the Northern Antarctic Peninsula it responds much more quickly to what’s happening on the surface. So as the glaciers thin and the load in that localised area reduces, the mantle pushes up the crust.

“At the moment we have only studied the vertical deformation so the next step is to look at horizontal motion caused by the ice unloading to get more of a 3-D picture of how Earth is deforming, and to use other geophysical data to understand the mechanism of the flow.”

Since 1995 several ice shelves in the Northern Antarctic Peninsula have collapsed and triggered ice-mass unloading, causing the solid Earth to ‘bounce back’.

“Think of it a bit like a stretched piece of elastic,” says Nield, whose project is funded by the Natural Environment Research Council (NERC).

“The ice is pressing down on the Earth and as this weight reduces the crust bounces back. But what we found when we compared the ice loss to the uplift was that they didn’t tally — something else had to be happening to be pushing the solid Earth up at such a phenomenal rate.

“Collating data from seven GPS stations situated across the Northern Peninsula, the team found the rebound was so fast that the upper mantle viscosity — or resistance to flow — had to be at least ten times lower than previously thought for the region and much lower than the rest of Antarctica.

Professor Peter Clarke, Professor of Geophysical Geodesy at Newcastle University and one of the authors of the paper, adds: “Seeing this sort of deformation of the Earth at such a rate is unprecedented in Antarctica. What is particularly interesting here is that we can actually see the impact that glacier thinning is having on the rocks 250 miles down.”

Note : The above story is based on materials provided by Newcastle University.

Researchers examine fate of methane following the Deepwater Horizon spill

Image shows surface oil, emulsions and tar mats. Credit: Samantha Joye

The 2010 Deepwater Horizon blowout discharged roughly five million gallons of oil and up to 500,000 tons of natural gas into Gulf of Mexico offshore waters over a period of 84 days. In the face of a seemingly insurmountable cleanup effort, many were relieved by reports following the disaster that naturally-occurring microbes had consumed much of the gas and oil.

Now, a team of researchers led by University of Georgia marine scientists have published a paper in the journal Nature Geoscience that questions this conclusion and provides evidence that microbes may not be capable of removing contaminants as quickly and easily as once thought.

“Most of the gas injected into the Gulf was methane, a potent greenhouse gas that contributes to global climate change, so we were naturally concerned that this potent greenhouse gas could escape into the atmosphere,” said Samantha Joye, senior author of the paper, director of the study and professor of marine science in UGA’s Franklin College of Arts and Sciences. “Many assumed that methane-oxidizing microbes would simply consume the methane efficiently, but our data suggests that this isn’t what happened.”

Joye and colleagues from other universities and government organizations measured methane concentrations and the activity of methane-consuming bacteria for ten months, starting before the blowout with collection of an invaluable set of pre-discharge samples taken in March 2010.

The abundance of methane in the water allowed the bacteria that feed on the gas to flourish in the first two months immediately following the blowout, but their activity levels dropped abruptly despite the fact that methane was still being released from the wellhead.

This new data suggests the sudden drop in bacterial activity was not due to an absence of methane, but a host of environmental, physiological, and physical constraints that made it difficult or impossible for bacteria to consume methane effectively.

“For these bacteria to work efficiently, they need unlimited access to nutrients like inorganic nitrogen and trace metals, but they also need elevated methane levels to persist long enough to support high rates of consumption,” Joye said. “The bacteria in the Gulf were probably able to consume about half of the methane released, but we hypothesize that an absence of essential nutrients and the dispersal of gas throughout the water column prevented complete consumption of the discharged methane.”

Joye insists that while her group’s conclusions differ from those presented in previous studies, there is no serious conflict between their analyses.

“The issue here was short-term sampling versus long-term time series sampling,” she said. “I hope our paper clearly relays the message that long-term sampling is the only way to capture the evolution of a natural system as it responds to large perturbations like oil well blowouts or any other abrupt methane release.”

Ultimately, scientists need to better understand the behavior of these microbes so that they may better gauge the environmental impacts of future accidents and methane releases due to climate change, she said.

“It’s only a matter of time before we face another serious incident like Deepwater Horizon,” Joye said. “The key is understanding the things that regulate how fast bacteria can consume methane, and that will give us insight into the ultimate fate of this potent greenhouse gas in our oceans.”

Note : The above story is based on materials provided by University of Georgia

Kornerupine

Kornerupine Locality: Mt Riddock Station, Harts Range (Harts Ranges; Hartz Range; Hartz Ranges), Central Desert Shire, Northern Territory, Australia Photo Copyright © John Sobolewski

Chemical Formula: (Mg,Fe2+)4(Al,Fe3+)6(SiO4,BO4)5(O,OH)2
Locality: Fiskernaes, SW Greenland.
Name Origin: Named after the Danish geologist, Andreas Nikolaus Kornerup (1857-1881).

Kornerupine is a rare boro-silicate mineral with the formula (Mg,Fe2+)4(Al,Fe3+)6(SiO4,BO4)5(O,OH)2. It crystallizes in the orthorhombic – dipyramidal crystal system as brown, green, yellow to colorless slender tourmaline like prisms or in massive fibrous forms. It has a Mohs hardness of 7 and a specific gravity of 3.3 to 3.34. Its indices of refraction are nα=1.660 – 1.671, nβ=1.673 – 1.683 and nγ=1.674 – 1.684.

It occurs in boron-rich volcanic and sedimentary rocks which have undergone high grade metamorphism. It is also found in metamorphosed anorthosite complexes.

Kornerupine is valued as a gemstone when it is found in translucent green to yellow shades. The emerald green varieties are especially sought after.

It was first described in 1884 for an occurrence in Fiskernaes in SW Greenland. It was named in honor of the Danish geologist, Andreas Nikolaus Kornerup (1857–1883)

Physical Properties

Cleavage: {110} Indistinct
Color: Brown, Colorless, Green, Greenish yellow, Yellow.
Density: 3.3 – 3.34, Average = 3.32
Diaphaneity: Translucent to opaque
Fracture: Brittle – Uneven – Very brittle fracture producing uneven fragments.
Hardness: 7 – Quartz
Luminescence: Non-fluorescent.
Luster: Vitreous (Glassy)
Streak: white

Photos :

Kornerupine Madagascar Thumbnail, 7.0 mm x 3.2 mm ; 0.51 cts © irocks
Name: Kornerupine Cat’s Eye Locality: Inida Weight: 1.20 carats Size: 6.35 mm © minclassics
Fiskenaes (Fiskenaesset; Qeqertarsuatsiaat), Nuuk (Godthåb), Sermersooq, Greenland © Pavel M. Kartashov

Paleontologists discover new fossil organism

Plexus ricei was a broadly curving tube that resided on the Ediacaran seafloor. Individuals range in size from 5 to 80 cm long and 5 to 20 mm wide, and are comprised of two main components: a rigid median tubular structure and a fragile outer tubular wall. Letters and arrows point to the fossil. Credit: Droser Lab, UC Riverside.

Scientists at the University of California, Riverside have discovered a fossil of a newly discovered organism from the “Ediacara Biota” — a group of organisms that occurred in the Ediacaran period of geologic time.

Named Plexus ricei and resembling a curving tube, the organism resided on the Ediacaran seafloor. Plexus ricei individuals ranged in size from 5 to 80 centimeters long and 5 to 20 millimeters wide. Along with the rest of the Ediacara Biota, it evolved around 575 million years ago and disappeared from the fossil record around 540 million years ago, just around the time the Cambrian Explosion of evolutionary history was getting under way.

“Plexus was unlike any other fossil that we know from the Precambrian,” said Mary L. Droser, a professor of paleontology, whose lab led the research. “It was bilaterally symmetrical at a time when bilaterians — all animals other than corals and sponges — were just appearing on this planet. It appears to have been very long and flat, much like a tapeworm or modern flatworm.”

Study results appeared online last month in the Journal of Paleontology.

“Ediacaran fossils are extremely perplexing: they don’t look like any animal that is alive today, and their interrelationships are very poorly understood,” said Lucas V. Joel, a former graduate student at UC Riverside and the first author of the research paper. Joel worked in Droser’s lab until June 2013.

He explained that during the Ediacaran there was no life on land. All life that we know about for the period was still in the oceans.

“Further, there was a complete lack of any bioturbation in the oceans at that time, meaning there were few marine organisms churning up marine sediments while looking for food,” he said. “Then, starting in the Cambrian period, organisms began churning up and mixing the sediment.”

According to the researchers, the lack of bioturbators during the Ediacaran allowed thick films of (probably) photosynthetic algal mats to accumulate on ocean floors — a very rare environment in the oceans today. Such an environment paved the way for many mat-related lifestyles to evolve, which become virtually absent in the post-Ediacaran world.

“The lack of bioturbation also created a very unique fossil preservational regime,” Joel said. “When an organism died and was buried, it formed a mold of its body in the overlying sediment. As the organism decayed, sediment from beneath moved in to form a cast of the mold the organism had made in the sediment above. What this means is that the fossils we see in the field are not the exact fossils of the original organism, but instead molds and casts of its body.”

Paleontologists have reported that much of the Ediacara Biota was composed of tubular organisms. The question that Droser and Joel addressed was: Is Plexus ricei a tubular organism or is it an organism that wormed its way through the sand, leaving a trail behind it?

“In the Ediacaran we really need to know the difference between the fossils of actual tubular organisms and trace fossils because if the fossil we are looking at is a trace fossil, then that has huge implications for the earliest origins of bilaterian animals — organisms with bilateral symmetry up and down their midlines and that can move independently of environment forces,” Joel said. “Being able to tell the difference between a tubular organism and a trace fossil has implications for the earliest origins of bilaterian organism, which are the only kinds of creatures that could have constructed a tubular trace fossil. Plexus is not a trace fossil. What our research shows is that the structure we see looks very much like a trace fossil, but is in fact a new Ediacaran tubular organism, Plexus ricei.”

Plexus ricei was so named for plexus, meaning braided in Latin, a reference to the organism’s morphology, and ricei for Rice, the last name of the South Australian Museum’s Dennis Rice, one of the field assistants who helped excavate numerous specimens of the fossil.

“At this time, we don’t know for sure that Plexus ricei was a bilateral but it is likely that it was related to our ancestors,” Droser said.

Note : The above story is based on materials provided by University of California – Riverside.

NASA sees system 90E just after earthquake hit Mexico’s Guerrero State

This false-colored infrared image from NASA’s AIRS instrument shows the high, cold cloud tops (purple) associated with the thunderstorms in System 91B as it moves over southern Mexico on May 8 at 20:11 UTC/4:11 p.m. EDT. Credit: NASA JPL, Ed Olsen

As the dissipating tropical low pressure system known as System 90E continued rain on Guerrero State in southern Mexico, the U.S. Geological Survey reported a 6.4 magnitude earthquake occurred there on Thursday, May 8 around noon local time (1 p.m. EDT). NASA’s Aqua satellite captured an infrared image of the low pressure area just three hours after the earthquake.

As showers fell on Guerrero State, USGS noted that the quake’s center was 9.3 miles (5 km) north of Tecpan de Galeana, Mexico. That’s about 60 miles (96.5 km) northwest of Acapulco and 172 miles (276.8 km) southwest of Mexico City. According to USGS, back on April 18, an 7.2 earthquake occurred just 40 miles from yesterday’s epicenter.

A false-colored infrared image from NASA’s Atmospheric Infrared Sounder (AIRS) instrument showed high, cold cloud tops associated with the thunderstorms in System 90E moving over southern Mexico on May 8 at 20:11 UTC/4:11 p.m. EDT. Some of the cloud tops were near -63 F (-52C) indicating some potential for heavy rainfall.

On May 9, the National Hurricane Center (NHC) noted that showers and thunderstorms associated with System 90E continued to become less organized during the early morning hours. The low pressure area is large and centered about 150 miles (241.4 km) southwest of Zihuatenejo, Guerrero State, Mexico.

The NHC discussion on May 9 noted that the upper-level winds have become unfavorable for development and this system, so System 90E now has a very low chance, near 0 percent of becoming a tropical cyclone during the next 48 hours or over the next five days for that matter- which is good news for southwestern Mexico.

Despite not having the potential to develop, however, System 90E is expected to continue to produce locally heavy rainfall and gusty winds over portions of southwestern Mexico during the next day or so, according to NHC. The Mexican Weather Service noted that System 90E has the potential to bring torrential rainfall to Michoacán and Guerrero states totaling between 5.9 to 9.8 inches (150 to 250 mm). These rains could produce life-threatening flash floods and mud slides.

Video :


Note :The above story is based on materials provided by NASA’s Goddard Space Flight Center


Kleinite

Kleinite Humboldt Co., McDermitt, 8.0cm x 5.1cm © tigerminerals

Chemical Formula: (Hg2N)(Cl,SO4)·nH2O
Locality: Terlingua, Brewster Co., Taxas, USA.
Name Origin: Named for Carl Klein (1832-1907), German mineralogist, University of Berlin.

History

Discovery date: 1905
Town of Origin : TERLINGUA, BREWSTER CO., TEXAS
Country of Origin : USA

Optical properties

Optical and misc. Properties : Translucent to subtranslucent
Refractive Index : from 2,19 to 2,21

Physical Properties

Cleavage: {0001} Good
Color: Yellow, Orange.
Density: 8
Diaphaneity: Translucent to subtranslucent
Fracture: Brittle – Generally displayed by glasses and most non-metallic minerals.
Hardness: 3.5 – Copper Penny
Luminescence: Non-fluorescent.
Luster: Adamantine
Magnetism: Nonmagnetic
Streak: yellow

Photos :

Kleinite Origin: McDermitt mine, Humboldt Co., Nevada, U.S.A. Sample size 4 x 3 x 2 cm © John Veevaert, Trinity Mineral Co
Kleinite from McDermitt mine, Humboldt Co., Nevada, United States © Dakota Matrix Minerals, Inc.
Kleinite Locality: McDermitt Mine, Opalite District, Humboldt County, Nevada Overall Size: 30x15x12 mm Crystals: 0.1-0.6 mm © JohnBetts-FineMinerals
Kleinite McDermitt Mine, Opalite District, Humboldt Co., Nevada, USA Small Cabinet, 9.8 x 3.8 x 3.4 cm © irocks
McDermitt Mine (Cordero Mine; Old Cordero Mine), Opalite District, Humboldt Co., Nevada, USA © Stephan Wolfsried

Extinct kitten-sized hunter discovered

This is a view of the palate of the new, small sparassodont from Bolivia. The front end is to the right. The scale bar is 1 cm. Credit: Rick Wherley of the Cleveland Museum of Natural History

A Case Western Reserve University student and his mentor have discovered an ancient kitten-sized predator that lived in Bolivia about 13 million years ago — one of the smallest species reported in the extinct order Sparassodonta.
Third-year undergraduate student Russell Engelman and Case Western Reserve anatomy professor Darin Croft made the finding by analyzing a partial skull that had been in a University of Florida collection more than three decades.

The researchers report their finding in the Journal of Vertebrate Paleontology.

“The animal would have been about the size of a marten, a catlike weasel found in the Northeastern United States and Canada, and probably filled the same ecological niche,” said Engelman, an evolutionary biology major from Russell Township, Ohio.

The researchers refrained from naming the new species mainly because the specimen lacks well-preserved teeth, which are the only parts preserved in many of its close relatives.

The skull, which would have been a little less than 3 inches long if complete, shows the animal had a very short snout. A socket, or alveolus, in the upper jaw shows it had large, canines, that were round in cross-section much like those of a meat-eating marsupial, called the spotted-tailed quoll, found in Australia today, the researchers said.

Although sparassodonts are more closely related to modern opossums than cats and dogs, the group included saber-toothed species that fed on large prey. This small Bolivian species probably fed on the ancient relatives of today’s guinea pigs and spiny rats, the researchers said.

“Most predators don’t go after animals of equal size, but these features indicate this small predator was a formidable hunter,” Croft said.

The specimen had not been studied in detail after being collected. It was provisionally identified as belonging to a particular group of extinct meat-eating opossums, due in part to its small size. Further adding to the identity challenge, almost all small sparassodonts have been identified by their teeth and lower jaws, which this skull lacks.

Croft wanted to study the skull because its age is nearly twice that of the oldest known species of meat-eating opossum. The specimen was found in a mountainous site known as Quebrada Honda, Bolivia, in 1978, in rock layers dated 12 million to 13 million years ago.

Structurally, extinct meat-eating opossums and sparassodont skulls share a number of similarities due to their similar meat-eating diet, Engelman said.

“No single feature found in the skull was so distinctive that we could say one way or the other what it was,” Croft said, “but the combination of features is unique and says this is a sparassodont.”

One key was that a particular bone of the orbit, the boney socket of the eye, does not touch the nasal bone in an opossum but does in a sparassodont.

The short snout was a kind of red herring. While jaguar-sized sparassodonts had them, the smaller members of the order had fox-like faces. And this species was smaller than most of those.

These smaller sparassodonts also have gaps between their teeth that are absent in most larger species. The skull shows no gaps.

Overall, the animal’s features are a mixture of those found in different species of sparassodonts, but are not characteristic of in any one subgroup within the order. That puts this species near the bottom of the family tree, the researchers said.

Croft, who regularly collects from the same site where the skull was found, will return there this summer to gather evidence he hopes will show whether this species lived in an open grassland, forest or mixed habitat.

He also hopes to find the lower jaw, which may enable direct comparisons with known species and provide enough foundation to name the animal.

Note : The above story is based on materials provided by Case Western Reserve University.

New ways for understanding the link between the uplift of the Tibetan Plateau and species diversity

Mountains in Yunnan Province, China. Credit: Copyright Adrien Favre

A team of Austrian, Swiss and German researchers of the Biodiversity and Climate Research Centre (BiK-F), the Senckenberg Gesellschaft für Naturforschung and the German Centre for Integrative Biodiversity Research (iDiv), from the University of Leipzig and the Leibniz-Institute of Freshwater Ecology has summarized the current state of knowledge on the diversification of Tibetan plants and animals. The study focuses in particular on how the geological processes that led to the rise of the Qinghai-Tibetan Plateau and Himalayas affected diversification and speciation directly, and indirectly, e.g. by changing climatic conditions. The paper was recently published in Biological Reviews.

“We believe this paper may become a benchmark for geo-biological studies worldwide. It links the geological, climatic and evolutionary history of one of the most fascinating and biodiverse regions of the world, and builds up a promising framework for more hypothesis-driven and synthetic research,” says Prof. Alexandra Muellner-Riehl, from the Department of Molecular Evolution and Systematics of Plants in Leipzig. She heads the DFG Research Cluster and is also member of the German Centre for Integrative Biodiversity Research (iDiv) Halle-Jena-Leipzig.

Muellner-Riehl and her collaborators found that the link between diversity, speciation and the geological processes was still poorly understood. They identified two main reasons for this: different authors tend to use a different geological framework in their studies, and they apply different analytical approaches and data that are poorly comparable.

The authors show three ways how our understanding of the link between uplift processes of the Qinghai-Tibetan Plateau and the Himalayas and species diversity can be improved: 1) They provide a state-of-the-art scenario how the uplift occurred and how this influenced regional climates over the last 40 million years; this will allow future researchers to formulate clear and comparable hypotheses. 2) They summarize recent analytical developments that allow scientists to make the link between geology and diversification more quantitative and less ad hoc. 3) They propose using meta-analyses of many comparable data sets to help researchers gain a broader understanding of species diversity in the region.

“It is very likely that the uplift of the Qinghai-Tibetan Plateau had different impacts on the evolution of different taxa,” lead author Dr. Adrien Favre, Department of Molecular Evolution and Systematics of Plants, University of Leipzig, Germany, points out. “We wanted to provide details on the criteria that individual data sets should meet to guide future research,” adds co-author Dr. Steffen Pauls, Biodiversity and Climate Research Centre (BiK-F).

Note : The above story is based on materials provided by Forschungsverbund Berlin e.V. (FVB).

Related Articles