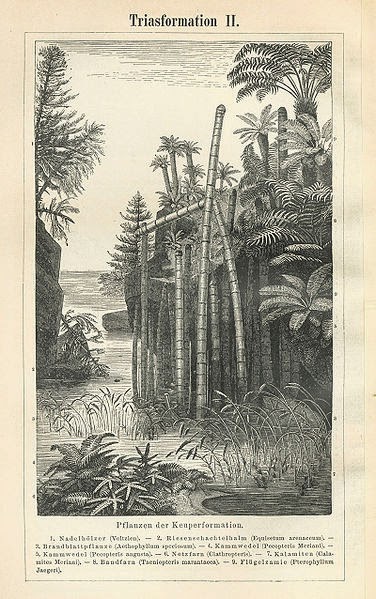
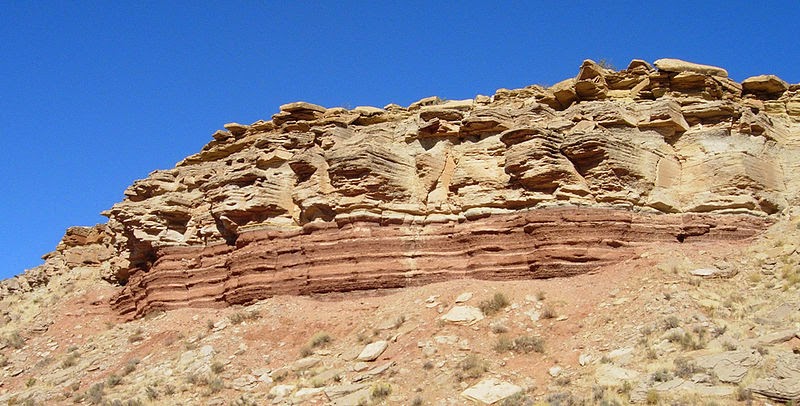
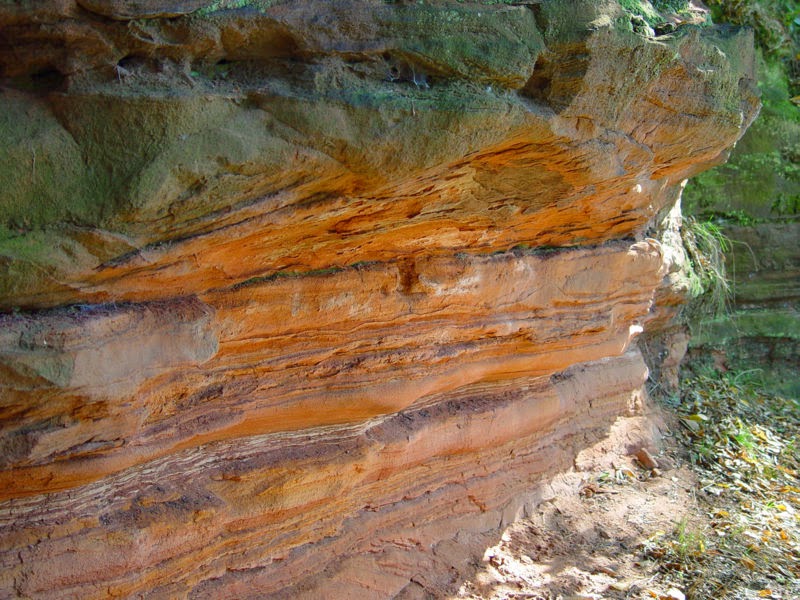
The Triassic /traɪˈæsɪk/ is a geologic period and system that extends from about 250 to 200 Ma (252.2 ± 0.5 to 201.3 ± 0.2 million years ago). It is the first period of the Mesozoic Era, and lies between the Permian and Jurassic periods. Both the start and end of the period are marked by major extinction events. The Triassic was named in 1834 by Friedrich von Alberti, after the three distinct rock layers (tri meaning “three”) that are found throughout Germany and northwestern Europe—red beds, capped by marine limestone, followed by a series of terrestrial mud- and sandstones—called the “Trias.”
The Triassic began in the wake of the Permian–Triassic extinction event, which left the Earth’s biosphere impoverished; it would take well into the middle of the period for life to recover its former diversity. Therapsids and archosaurs were the chief terrestrial vertebrates during this time. A specialized subgroup of archosaurs, dinosaurs, first appeared in the Late Triassic but did not become dominant until the succeeding Jurassic. The first true mammals, themselves a specialized subgroup of Therapsids also evolved during this period, as well as the first flying vertebrates, the pterosaurs, who like the dinosaurs were a specialized subgroup of archosaurs. The vast supercontinent of Pangaea existed until the mid-Triassic, after which it began to gradually rift into two separate landmasses, Laurasia to the north and Gondwana to the south. The global climate during the Triassic was mostly hot and dry, with deserts spanning much of Pangaea’s interior. However, the climate shifted and became more humid as Pangaea began to drift apart. The end of the period was marked by yet another major mass extinction, wiping out many groups and allowing dinosaurs to assume dominance in the Jurassic.
Dating and subdivisions
The Triassic is usually separated into Early, Middle, and Late Triassic Epochs, and the corresponding rocks are referred to as Lower, Middle, or Upper Triassic. The faunal stages from the youngest to oldest are:
- Upper/Late Triassic (Tr3)
- Rhaetian (~208.5 – 201.3 ± 0.2 Mya)
- Norian (~228 – ~208.5 Mya)
- Carnian (~235 – ~228 Mya)
- Middle Triassic (Tr2)
- Ladinian (~242 – ~235 Mya)
- Anisian (247.2 – ~242 Mya)
- Lower/Early Triassic (Scythian)
- Olenekian (251.2 – 247.2 Mya)
- Induan (252.2 ± 0.5 – 251.2 Mya)
Paleogeography
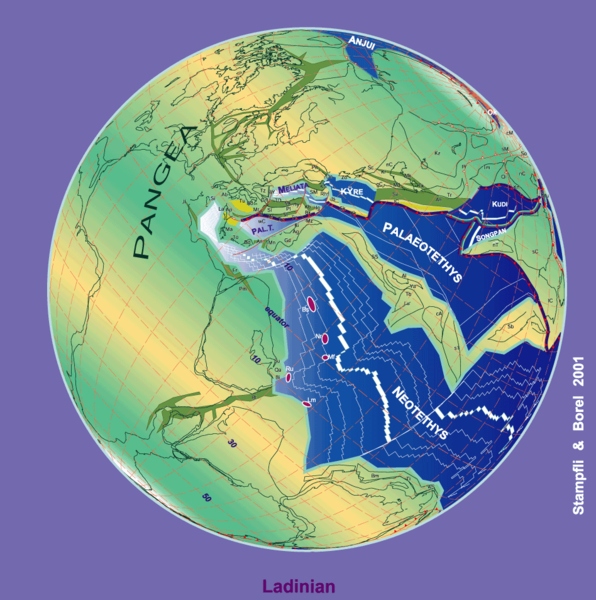
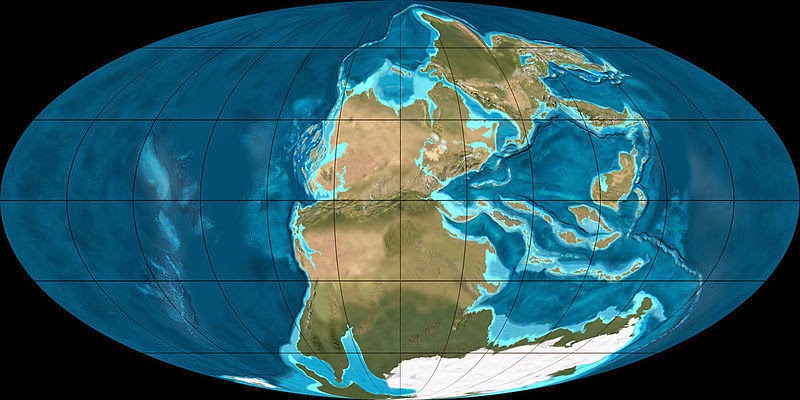
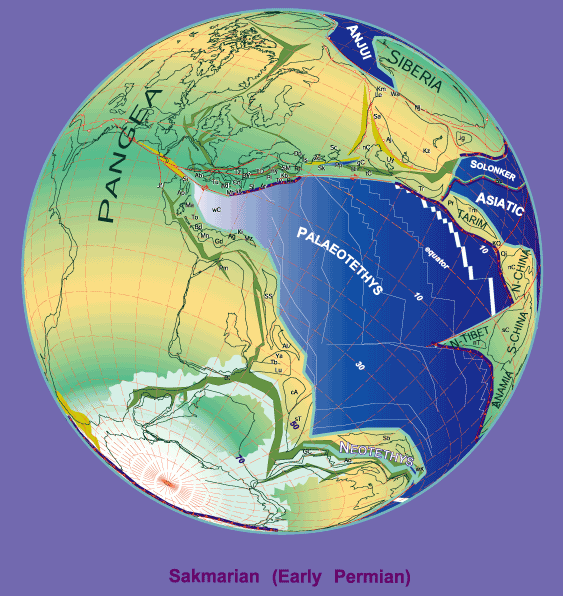
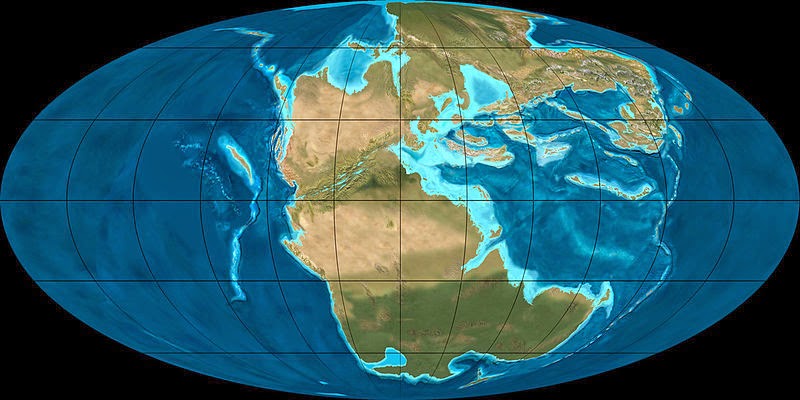
)During the Triassic, almost all the Earth’s land mass was concentrated into a single supercontinent centered more or less on the equator, called Pangaea (“all the land”). From the east a vast gulf entered Pangaea, the Tethys sea. It opened farther westward in the mid-Triassic, at the expense of the shrinking Paleo-Tethys Ocean, an ocean that existed during the Paleozoic. The remaining shores were surrounded by the world-ocean known as Panthalassa (“all the sea”). All the deep-ocean sediments laid down during the
Triassic have disappeared through subduction of oceanic plates; thus, very little is known of the Triassic open ocean. The supercontinent Pangaea was rifting during the Triassic—especially late in the period—but had not yet separated. The first nonmarine sediments in the rift that marks the initial break-up of Pangaea—which separated New Jersey from Morocco—are of Late Triassic age; in the U.S., these thick sediments comprise the Newark Group. Because of the limited shoreline of one super-continental mass, Triassic marine deposits are globally relatively rare, despite their prominence in Western Europe, where the Triassic was first studied. In North America, for example, marine deposits are limited to a few exposures in the west. Thus Triassic stratigraphy is mostly based on organisms living in lagoons and hypersaline environments, such as Estheria crustaceans.
Africa
At the beginning of the Mesozoic Era, Africa was joined with Earth’s other continents in Pangaea. Africa shared the supercontinent’s relatively uniform fauna which was dominated by theropods, prosauropods and primitive ornithischians by the close of the Triassic period. Late Triassic fossils are found throughout Africa, but are more common in the south than north. The boundary separating the Triassic and Jurassic marks the advent of an extinction event with global impact, although African strata from this time period have not been thoroughly studied.
South America
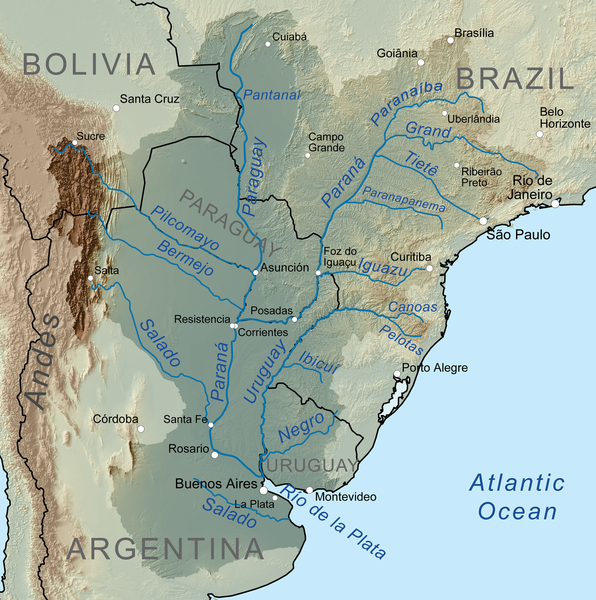
At Paleorrota geopark, located in Rio Grande do Sul, Brazil, the Santa Maria Formation and Caturrita Formations are exposed. In these formations, one of the earliest dinosaurs, Staurikosaurus, as well as the mammal ancestors Brasilitherium and Brasilodon have been discovered.
Climate
The Triassic climate was generally hot and dry, so that typical deposits are red bed sandstones and evaporites. There is no evidence of glaciation at or near either pole; in fact, the polar regions were apparently moist and temperate, a climate suitable for forests and vertebrates, including reptiles. Pangaea’s large size limited the moderating effect of the global ocean; its continental climate was highly seasonal, with very hot summers and cold winters. The strong contrast between the Pangea supercontinent and the global ocean triggered intense cross-equatorial monsoons.
Although the Triassic may have mostly been a dry period, at least at tropical and subtropical latitudes in the Tethys and surrounding lands, evidence exists that it was punctuated by several episodes of increased rainfall. Sediments and fossils suggestive of a more humid climate are known from the Anisian to Ladinian of the Tethysian domain, and from the Carnian and Rhaetian of a larger area that includes also the Boreal domain (e.g., Svalbard Islands), the North American continent, the South China block and Argentina.
The best studied of such episodes of humid climate, and probably the most intense and widespread, was the Carnian Pluvial Event
Life
Three categories of organisms can be distinguished in the Triassic record: holdovers from the Permian-Triassic extinction, new groups which flourished briefly, and other new groups which went on to dominate the Mesozoic world.
Flora
On land, the holdover plants included the lycophytes, the dominant cycads, ginkgophyta (represented in modern times by Ginkgo biloba) and glossopterids. The spermatophytes, or seed plants came to dominate the terrestrial flora: in the northern hemisphere, conifers flourished. Glossopteris (a seed fern) was the dominant southern hemisphere tree during the Early Triassic period.
Marine fauna
In marine environments, new modern types of corals appeared in the Early Triassic, forming small patches of reefs of modest extent compared to the great reef systems of Devonian times or modern reefs. Serpulids appeared in the Middle Triassic. Microconchids were abundant. The shelled cephalopods called ammonites recovered, diversifying from a single line that survived the Permian extinction. The fish fauna was remarkably
uniform, reflecting the fact that very few families survived the Permian extinction. There were also many types of marine reptiles. These included the Sauropterygia, which featured pachypleurosaurs and nothosaurs (both common during the Middle Triassic, especially in the Tethys region), placodonts, and the first plesiosaurs; the first of the lizardlike Thalattosauria (askeptosaurs); and the highly successful ichthyosaurs, which appeared in Early Triassic seas and soon diversified, some eventually developing to huge size during the late Triassic.
Terrestrial fauna
Important groups of terrestrial fauna, newly in the triassic period or achieving a new level of evolutionary success during the triassic include:
- Temnospondyls
One of the largest and most important groups of early amphibians, temnospondyls originated during the Carboniferous but flourished during the Triassic. They lived across the globe, ranged in size from tiny to enormous and prospered both on land and in the water. The largest temnospondyls, such as the Mastodonsaurus were up to 13ft in length.
- Rhynchosaurs
These barrel-gutted herbivores thrived for only a short period of time, becoming extinct about 220 million years ago, but they were exceptionally abundant and were the primary large herbivores in many ecosystems. They sheared plants with their beaks and several rows of teeth on the roof of the mouth.
- Phytosaurs
One of the most familiar of the crocodile-line archosaurs, phytosaurs prospered during the late Triassic. These long-snouted and semiaquatic predators resemble living crocodiles and probably had a similar lifestyle, hunting for fish and small reptiles around the water’s edge. However this resemblance is only superficial and is a prime-case of convergent evolution.
- Aetosaurs
Like the phytosaurs, aetosaurs were exceptionally common during the last 30 million years of the late Triassic but died out at the Triassic-Jurassic extinction. Aetosaurs were heavily armored and resembled giant military tanks. Most aetosaurs were herbivorous, and fed on low-growing plants but some may have eaten meat.
- Rauisuchians
The rauisuchians, yet another group of crocodile-line archosaurs, were the keystone predators of most Triassic terrestrial ecosystems. Over 25 species have been found, and include giant quadripedal hunters, sleeks bipedal omnivores, and lumbering beasts with deep sails on their backs. They probably occupied the large-predator niche later filled by theropods.
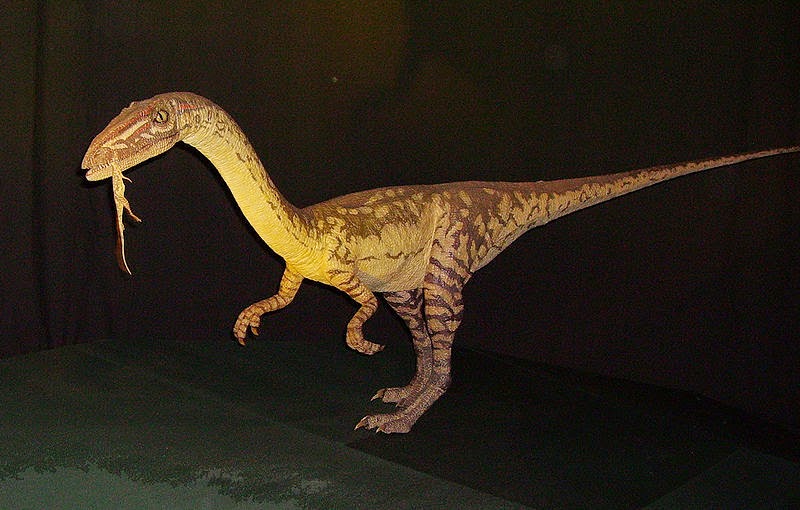
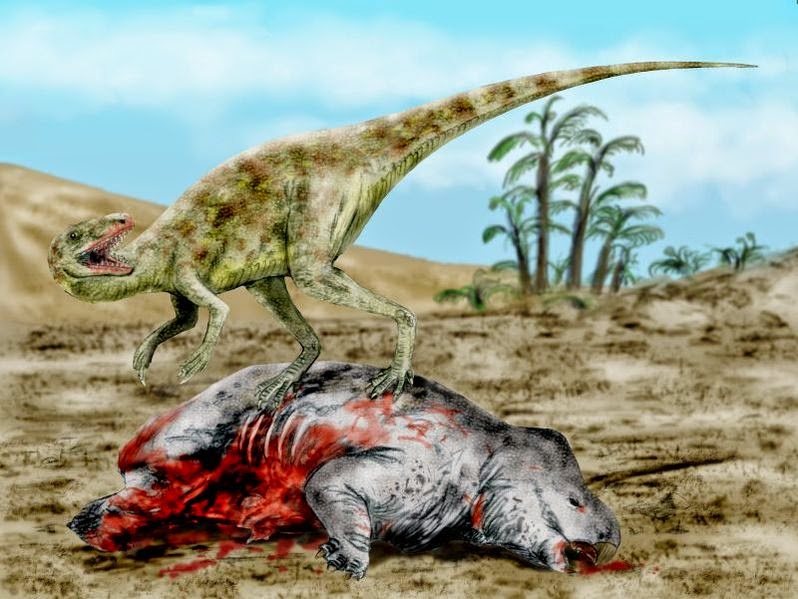
- Theropods
Perhaps the most recognizable group of dinosaurs, the therapods include predators such as the Tyrannosaurus, Allosaurus, and Velociraptor. Theropods first evolved in the Triassic period but did not evolve into giant sizes until later, during the Jurassic. Most Triassic theropods, such as the Coelophysis, were only several feet long and hunted small prey in the shadow of the giant Rauisuchians.
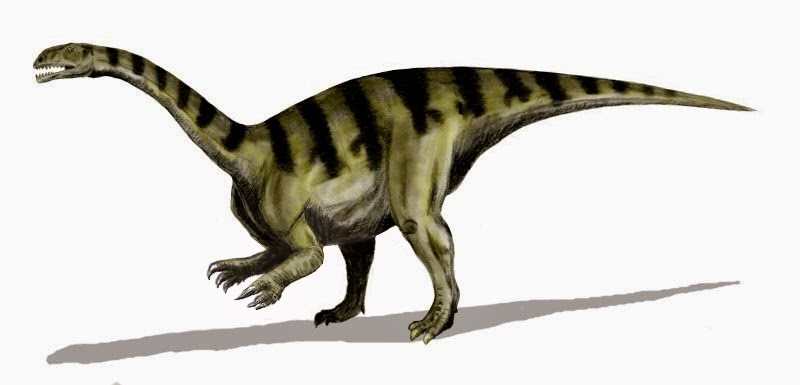
- Cynodonts
Cynodonts are a large group that includes true mammals. The first cynodonts evolved in the Permian, but many groups prospered during the Triassic. Their characteristic mammalian features included hair, a large brain, and upright posture. Many were small but some were enormous and filled a large herbivore niche before the evolution of sauropodomorph dinosaurs.
The Permian-Triassic extinction devastated terrestrial life. Biodiversity rebounded with the influx of pioneer organisms, but these were short lived. Diverse communities with complex trophic structures took 30 million years to reestablish.
Temnospondyl amphibians were among those groups that survived the Permian-Triassic extinction, some lineages (e.g. trematosaurs) flourishing briefly in the Early Triassic, while others (e.g. capitosaurs) remained successful throughout the whole period, or only came to prominence in the Late Triassic (e.g. plagiosaurs, metoposaurs). As for other amphibians, the first Lissamphibia, characterized by the first frogs, are known from the Early Triassic, but the group as a whole did not become common until the Jurassic, when the temnospondyls had become very rare. Other survivors were the Chroniosuchia and Embolomeri, more closely related to amniotes than temnospondyls, but went extinct after some million years.
Archosauromorph reptiles—especially archosaurs—progressively replaced the synapsids that had dominated the Permian, although Cynognathus was a characteristic top predator in earlier Triassic (Olenekian and Anisian) Gondwana, and both kannemeyeriid dicynodonts and gomphodont cynodonts remained important herbivores during much of the period. By the end of the Triassic, synapsids played only bit parts. During the Carnian (early part of the Late Triassic), some advanced cynodont gave rise to the first mammals. At the same time the Ornithodira, which until then had been small and insignificant, evolved into pterosaurs and a variety of dinosaurs. The Crurotarsi were the other important archosaur clade, and during the Late Triassic these also reached the height of their diversity, with various groups including the phytosaurs, aetosaurs, several distinct lineages of Rauisuchia, and the first crocodylians (the Sphenosuchia). Meanwhile the stocky herbivorous rhynchosaurs and the small to medium-sized insectivorous or piscivorous Prolacertiformes were important basal archosauromorph groups throughout most of the Triassic.
Among other reptiles, the earliest turtles, like Proganochelys and Proterochersis, appeared during the Norian (middle of the Late Triassic). The Lepidosauromorpha—specifically the Sphenodontia—are first known in the fossil record a little earlier (during the Carnian). The Procolophonidae were an important group of small lizard-like herbivores.
In the Triassic, archosaurs displaced therapsids as the dominant amniotes. This “Triassic Takeover” may have contributed to the evolution of mammals by forcing the surviving therapsids and their mammaliaform successors to live as small, mainly nocturnal insectivores; nocturnal life may have forced the mammaliaforms to develop fur and higher metabolic rates.
Coal
At the start of the Triassic period coal is noticeable by geologists today as being absent throughout the world. This is known as the “coal gap” and can be seen as part of the Permian–Triassic extinction event.Sharp drops in sea level across the Permo Triassic boundary may be the proper explanation for the coal gap. However, theories are still speculative as to why it is missing. During the preceding Permian period the arid desert conditions contributed to the evaporation of many inland seas and the inundation of these seas, perhaps by a number of tsunami events that may have been responsible for the drop in sea level. This due to the finding of large salt basins in the southwest United States and a very large basin in central Canada.
Immediately above the boundary the glossopteris flora was suddenly largely displaced by an Australia wide coniferous flora containing few species and containing a lycopod herbaceous under story. Conifers also became common in Eurasia. These groups of conifers arose from endemic species because of the ocean barriers that prevented seed crossing for over one hundred million years. For instance, Podocarpis was located south and Pines, Junipers, and Sequoias were located north. The dividing line ran through the Amazon Valley, across the Sahara, and north of Arabia, India, Thailand, and Australia. It has been suggested that there was a climate barrier for the conifers. although water barriers are more plausible. If so, something that can cross at least short water barriers must have been involved in producing the coal hiatus. Hot climate could have been an important auxiliary factor across Antarctica or the Bering Strait, however. There was a spike of fern and lycopod spores immediately after the close of the Permian. In addition there was also a spike of fungal spores immediately after the Permian-Triassic boundary. This spike may have lasted 50,000 years in Italy and 200,000 years in China and must have contributed to the climate warmth.
An event excluding a catastrophe must have been involved to cause the coal hiatus due to the fact that fungi would have removed all dead vegetation and coal forming detritus in a few decades in most tropical places. In addition, fungal spores rose gradually and declined similarly along with a prevalence of woody debris. Each phenomenon would hint at widespread vegetative death. Whatever the cause of the coal hiatus must have started in North America approximately 25 million years sooner.
Lagerstätten
The Monte San Giorgio lagerstätte, now in the Lake Lugano region of northern Italy and Switzerland, was in Triassic times a lagoon behind reefs with an anoxic bottom layer, so there were no scavengers and little turbulence to disturb fossilization, a situation that can be compared to the better-known Jurassic Solnhofen limestone lagerstätte. The remains of fish and various marine reptiles (including the common pachypleurosaur Neusticosaurus, and the bizarre long-necked archosauromorph Tanystropheus), along with some terrestrial forms like Ticinosuchus and Macrocnemus, have been recovered from this locality. All these fossils date from the Anisian/Ladinian transition (about 237 million years ago).
Triassic-Jurassic extinction event
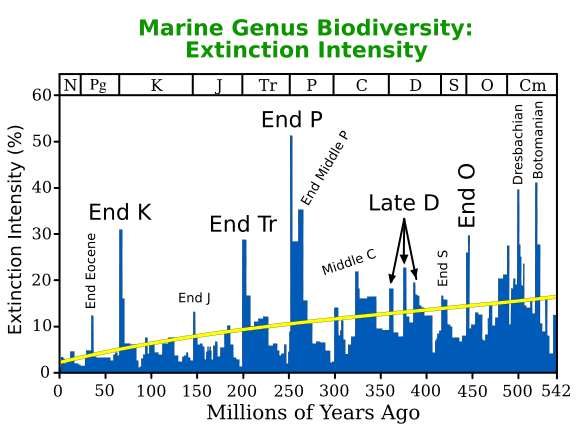
The Triassic period ended with a mass extinction, which was particularly severe in the oceans; the conodonts disappeared, as did all the marine reptiles except ichthyosaurs and plesiosaurs. Invertebrates like brachiopods, gastropods, and molluscs were severely affected. In the oceans, 22% of marine families and possibly about half of marine genera went missing according to University of Chicago paleontologist Jack Sepkoski.
Though the end-Triassic extinction event was not equally devastating everywhere in terrestrial ecosystems, several important clades of crurotarsans (large archosaurian reptiles previously grouped together as the thecodonts) disappeared, as did most of the large labyrinthodont amphibians, groups of small reptiles, and some synapsids (except for the proto-mammals). Some of the early, primitive dinosaurs also went extinct, but other more adaptive dinosaurs survived to evolve in the Jurassic. Surviving plants that went on to dominate the Mesozoic world included modern conifers and cycadeoids.
What caused this Late Triassic extinction is not known with certainty. It was accompanied by huge volcanic eruptions that occurred as the supercontinent Pangaea began to break apart about 202 to 191 million years ago 40Ar/39Ar dates,forming the CAMP, one of the largest known inland volcanic events since the planet cooled and stabilized. Other possible but less likely causes for the extinction events include global cooling or even a bolide impact, for which an impact crater containing Manicouagan Reservoir in Quebec, Canada, has been singled out. At the Manicouagan impact crater, however, recent research has shown that the impact melt within the crater has an age of 214±1 Mya. The date of the Triassic-Jurassic boundary has also been more accurately fixed recently, at 201.3 ± 0.2 Mya. Both dates are gaining accuracy by using more accurate forms of radiometric dating, in particular the decay of uranium to lead in zircons formed at the impact. So the evidence suggests the Manicouagan impact preceded the end of the Triassic by approximately 10±2 Ma. Therefore it could not be the immediate cause of the observed mass extinction.
The number of Late Triassic extinctions is disputed. Some studies suggest that there are at least two periods of extinction towards the end of the Triassic, between 12 and 17 million years apart. But arguing against this is a recent study of North American faunas. In the Petrified Forest of northeast Arizona there is a unique sequence of latest Carnian-early Norian terrestrial sediments. An analysis in 2002 found no significant change in the paleoenvironment. Phytosaurs, the most common fossils there, experienced a change-over only at the genus level, and the number of species remained the same. Some aetosaurs, the next most common tetrapods, and early dinosaurs, passed through unchanged. However, both phytosaurs and aetosaurs were among the groups of archosaur reptiles completely wiped out by the end-Triassic extinction event.
It seems likely then that there was some sort of end-Carnian extinction, when several herbivorous archosauromorph groups died out, while the large herbivorous therapsids— the kannemeyeriid dicynodonts and the traversodont cynodonts—were much reduced in the northern half of Pangaea (Laurasia).
These extinctions within the Triassic and at its end allowed the dinosaurs to expand into many niches that had become unoccupied. Dinosaurs became increasingly dominant, abundant and diverse, and remained that way for the next 150 million years. The true “Age of Dinosaurs” is the Jurassic and Cretaceous, rather than the Triassic.
Note : The above story is based on materials provided by Wikipedia