back to top
27.8 C
New York
Sunday, April 6, 2025
Home Blog Page 307

US earthquake fault zone alive and active, study finds

Aerial photo of the San Andreas Fault in the Carrizo Plain, northwest of Los Angeles. Credit: Wikipedia.

The New Madrid fault zone in the United States’ midsection is active and could spawn future large earthquakes, scientists reported Thursday.


It’s “not dead yet,” said U.S. Geological Survey seismologist Susan Hough, who was part of the study published online by the journal Science.
Researchers have long debated just how much of a hazard New Madrid poses. The zone stretches 150 miles (250 kilometers), crossing parts of Arkansas, Illinois, Indiana, Kentucky, Mississippi, Missouri and Tennessee.

In 1811 and 1812, it unleashed a trio of powerful jolts—measuring magnitudes 7.5 to 7.7—that rattled the central Mississippi River valley. Chimneys fell and boats capsized. Farmland sank and turned into swamps. The death toll is unknown, but experts don’t believe there were mass casualties because the region was sparsely populated then.

Unlike California’s San Andreas and other faults that occur along boundaries of shifting tectonic plates, New Madrid is less understood since it’s in the middle of the continent, far from plate boundaries.

Previous studies have suggested that it may be shutting down, based on GPS readings that showed little strain accumulation at the surface. Other research came to the same conclusion by blaming ongoing quake activity on aftershocks from the 1800s, which would essentially relieve strain on the fault.

The latest study suggests otherwise. Hough and USGS geophysicist Morgan Page in Pasadena, California, analyzed past quakes in the New Madrid region and used computer modeling to determine that the continuing tremors are not related to the big quakes two centuries ago.

“Our new results tell us that something is going on there, and therefore a repeat of the 1811-1812 sequence is possible,” Hough said.

The USGS estimates there’s a 7 to 10 percent chance of that happening in the next 50 years.

Arthur Frankel, a seismologist with the USGS in Seattle who had no role in the study, said the latest results seem plausible. His recent field work using GPS shows significant movement of land along the fault in the past decade, indicating a buildup of strain that could lead to potentially dangerous quakes.

Others said this won’t end the debate about the hazards on the New Madrid seismic zone.

Andrew Newman, a geophysicist at the Georgia Institute of Technology, said the method used in the study works well for faults along plate boundaries, but he’s unsure if it applies to enigmatic faults like New Madrid.

Note :The above story is based on materials provided by © 2014 The Associated Press. All rights reserved.

Enigmatic methane: Study solves a biogeochemical riddle from the ocean floor

Marine researchers from Bremen, along with a U.S. colleague, discovered the potential reasons for an unsolved mystery from beneath the seafloor – the study appeared online yesterday in Nature Geoscience. Their findings provide an explanation as to why methane in zones of turnover in the seafloor displays unusual isotopic signatures that have long puzzled researchers. The authors attribute the enigma to the process of methane oxidation by microorganisms, and suggest that this phenomenon may apply to other low-energy biogeochemical reactions that prevail in the marine realm.

Analyzing the carbon isotopic composition of methane within the seafloor, researchers from the MARUM and the Max-Planck-Institute for Marine Microbiology in Bremen came across an unusual phenomenon: In the zone where microorganisms oxidize methane along with reducing sulfate, there is no accumulation of the heavy isotope, 13C, in the remaining methane, as expected from traditional isotope behavior. Instead, they repeatedly find isotopically “light” methane – enriched in 12C – from a variety of such zones around the world. “These “light” methane signatures were previously interpreted as a fingerprint for methane production”, says Marcos Yoshinaga, first-author and currently a guest investigator at the School of Arts, Sciences and Humanities, University of São Paulo. “In this zone of methane oxidation, however, we could not think of any other biogeochemical process supporting this production”, adds senior-author Marcus Elvert from MARUM.

As a general rule, it has been proposed that during the process of methane oxidation there is a preferential loss of the lighter isotope from the starting reactant, with the remaining pool becoming isotopically “heavy” or enriched in 13C. The researchers used laboratory experiments to simulate microbial methane oxidation under similar conditions encountered in the seafloor. “The microbial collection of our Max-Planck-Institute with cultures of methane oxidizers from all over the world offers the possibility to faithfully reproduce the conditions found in nature” says Thomas Holler. And effectively: under low sulfate concentrations, as generally observed at methane oxidation zones in the seafloor, the formation of light, 12C-enriched methane occurred.

Methane possesses two major facets. Consisting of carbon and hydrogen atoms, it not only serves as energy source for microorganisms, but also plays a major role as a greenhouse gas. Marine sediments contain about 500–10,000 Gt of methane carbon. This reservoir is comparable in size to the amount of carbon in land biota, terrestrial soils, atmosphere and seawater combined, but thanks to the microbial methane oxidation in sediments devoid of oxygen, the oceans are responsible for less than two percent of the atmospheric emissions. “We have analyzed the stable carbon isotopic composition of methane in worldwide marine sediments” says John Pohlman from the US Geological Survey. Stable isotopes such as those of carbon contain the same number of protons but are distinct in the number of neutrons and thus have different masses. They show no difference in the chemical behavior during reactions, however, in chemical reactions, a preferential turnover of the lighter isotope 12C is observed during biogeochemical processes.

In addition to the environmental data, the researchers tried to answer the question why methane enriched in the lighter isotope 12C forms at low sulfate contents. Operating close to the energetic limit of life, all components of the methane oxidation reaction are close to isotope equilibrium. “As a consequence, the lighter isotope 12C is channeled back to methane”, says Gunter Wegener from the Max-Planck-Institute. “This result could be constrained by our biogeochemical model”, adds Tobias Goldhammer from MARUM. The researchers concluded that such low-energy reactions may also occur in the cycling of other elements within the Ocean’s interior. “This study highlights a novel insight into how certain Archaea adjust their metabolism to live under strong energy limitation in the deep-biosphere, and at the same time answers a central question of our project”, says Kai-Uwe Hinrichs, co-author and leader of the European Research Council-funded Project DARCLIFE that supported this study.

Note :The above story is based on materials provided by MARUM

Diaboleite

Locality: Thorikos Bay slag locality, Thorikos area, Lavrion District slag localities, |Lavrion District (Laurion; Laurium), Attikí Prefecture (Attica; Attika), Greece Picture width 0.8 mm Photo Copyright © Christian Rewitzer

Chemical Formula: Pb2CuCl2(OH)4
Locality: Higher Pitts, Mendip Hills, Somersetshire, England.
Name Origin: From the Greek dia, “difference” and the mineral Boleite.

Diaboleite is a blue-colored mineral with formula Pb2CuCl2(OH)4. It was discovered in England in 1923 and named diaboleite, from the Greek word διά and boleite, meaning “distinct from boleite”. The mineral has since been found in a number of countries.

Description

Diaboleite is deep blue in color and pale blue in transmitted light. The mineral occurs as tabular crystals up to 2 cm (0.8 in) in size, as subparallel aggregates, or it has massive habit. Vicinal forms of the tabular crystals have a square or octagonal outline and rarely exhibit pyramidal hemihedralism.

Physical Properties of Diaboleite

Cleavage: {001} Perfect
Color: Dark blue, Bright sky blue.
Density: 5.48 – 6.41, Average = 5.94
Diaphaneity: Transparent to Translucent
Fracture: Conchoidal – Fractures developed in brittle materials characterized by smoothly curving surfaces, (e.g. quartz).
Hardness: 2.5 – Finger Nail
Luster: Adamantine
Streak: blue

Photos :

DIABOLEITE and WHERRYITE Mammoth-St. Anthony Mine, Tiger, Pinal Co., Arizona, USA, North America Size: 8 x 5 x 3 cm (Small Cabinet) Owner: Kristalle and Crystal Classics
Diaboleite Mammoth-St. Anthony Mine, Tiger, Pinal County, Arizona, USA Thumbnail, 1.7 x 1.4 x 0.6 cm © irocks
Mammoth-Saint Anthony Mine (Mammoth-St Anthony Mine; Mammoth Mine; St. Anthony Mine), St. Anthony deposit, Tiger, Mammoth District, Pinal Co., Arizona, USA

Stanford scientists use ‘virtual earthquakes’ to forecast Los Angeles quake risk

This screenshot from a supercomputer simulation shows the waveguide-to-basin effect in Southern California. First predicted in 2006, this effect has remained untested because a large earthquake has not occurred in the region in more than 150 years. Stanford scientists recently confirmed the effect using the virtual earthquake approach. (Credit: Courtesy of Southern California Earthquake Center)

Stanford scientists are using weak vibrations generated by Earth’s oceans to produce “virtual earthquakes” that can be used to predict the ground movement and shaking hazard to buildings from real quakes.

The new technique, detailed in the Jan. 24 issue of the journal Science, was used to confirm a prediction that Los Angeles will experience stronger-than-expected ground movement if a major quake occurs south of the city.

“We used our virtual earthquake approach to reconstruct large earthquakes on the southern San Andreas Fault and studied the responses of the urban environment of Los Angeles to such earthquakes,” said lead author Marine Denolle, who recently received her PhD in geophysics from Stanford and is now at the Scripps Institution of Oceanography in San Diego.

The new technique capitalizes on the fact that earthquakes aren’t the only sources of seismic waves. “If you put a seismometer in the ground and there’s no earthquake, what do you record? It turns out that you record something,” said study leader Greg Beroza, a geophysics professor at Stanford.

What the instruments will pick up is a weak, continuous signal known as the ambient seismic field. This omnipresent field is generated by ocean waves interacting with the solid Earth. When the waves collide with each other, they generate a pressure pulse that travels through the ocean to the sea floor and into Earth’s crust. “These waves are billions of times weaker than the seismic waves generated by earthquakes,” Beroza said.

Scientists have known about the ambient seismic field for about 100 years, but it was largely considered a nuisance because it interferes with their ability to study earthquakes. The tenuous seismic waves that make up this field propagate every which way through the crust. But in the past decade, seismologists developed signal-processing techniques that allow them to isolate certain waves; in particular, those traveling through one seismometer and then another one downstream.

Denolle built upon these techniques and devised a way to make these ambient seismic waves function as proxies for seismic waves generated by real earthquakes. By studying how the ambient waves moved underground, the researchers were able to predict the actions of much stronger waves from powerful earthquakes.

She began by installing several seismometers along the San Andreas Fault to specifically measure ambient seismic waves.

Employing data from the seismometers, the group then used mathematical techniques they developed to make the waves appear as if they originated deep within Earth. This was done to correct for the fact that the seismometers Denolle installed were located at Earth’s surface, whereas real earthquakes occur at depth.

In the study, the team used their virtual earthquake approach to confirm the accuracy of a prediction, made in 2006 by supercomputer simulations, that if the southern San Andreas Fault section of California were to rupture and spawn an earthquake, some of the seismic waves traveling northward would be funneled toward Los Angeles along a 60-mile-long (100-kilometer-long) natural conduit that connects the city with the San Bernardino Valley. This passageway is composed mostly of sediments, and acts to amplify and direct waves toward the Los Angeles region.

Until now, there was no way to test whether this funneling action, known as the waveguide-to-basin effect, actually takes place because a major quake has not occurred along that particular section of the San Andreas Fault in more than 150 years.

The virtual earthquake approach also predicts that seismic waves will become further amplified when they reach Los Angeles because the city sits atop a large sedimentary basin. To understand why this occurs, study coauthor Eric Dunham, an assistant professor of geophysics at Stanford, said to imagine taking a block of plastic foam, cutting out a bowl-shaped hole in the middle, and filling the cavity with gelatin. In this analogy, the plastic foam is a stand-in for rocks, while the gelatin is like sediments, or dirt. “The gelatin is floppier and a lot more compliant. If you shake the whole thing, you’re going to get some motion in the Styrofoam, but most of what you’re going to see is the basin oscillating,” Dunham said.

As a result, the scientists say, Los Angeles could be at risk for stronger, and more variable, ground motion if a large earthquake — magnitude 7.0 or greater — were to occur along the southern San Andreas Fault, near the Salton Sea.

“The seismic waves are essentially guided into the sedimentary basin that underlies Los Angeles,” Beroza said. “Once there, the waves reverberate and are amplified, causing stronger shaking than would otherwise occur.”

Beroza’s group is planning to test the virtual earthquake approach in other cities around the world that are built atop sedimentary basins, such as Tokyo, Mexico City, Seattle and parts of the San Francisco Bay area. “All of these cities are earthquake threatened, and all of them have an extra threat because of the basin amplification effect,” Beroza said.

Because the technique is relatively inexpensive, it could also be useful for forecasting ground motion in developing countries. “You don’t need large supercomputers to run the simulations,” Denolle said.

In addition to studying earthquakes that have yet to occur, the technique could also be used as a kind of “seismological time machine” to recreate the seismic signatures of temblors that shook Earth long ago, according to Beroza.

“For an earthquake that occurred 200 years ago, if you know where the fault was, you could deploy instruments, go through this procedure, and generate seismograms for earthquakes that occurred before seismographs were invented,” he said.

German Prieto, an assistant professor of geophysics at the Massachusetts Institute of Technology and a Stanford alumnus, also contributed to the research.

Video :

Note :The above story is based on materials provided by Stanford University. The original article was written by Ker Than.

Changing Climate: How Dust Changed the Face of Earth

Polarstern. In spring 2010, the research icebreaker Polarstern returned from the South Pacific with a scientific treasure — ocean sediments from a previously almost unexplored part of the South Polar Sea. (Credit: Martin Schiller, Alfred Wegener Institute)

In spring 2010, the research icebreaker Polarstern returned from the South Pacific with a scientific treasure — ocean sediments from a previously almost unexplored part of the South Polar Sea. What looks like an inconspicuous sample of mud to a layman is, to geological history researchers, a valuable archive from which they can reconstruct the climatic history of the polar areas over many years of analysis. This, in turn, is of fundamental importance for understanding global climatic development.

With the help of the unique sediment cores from the Southern Ocean, it is now possible to provide complete evidence of how dust has had a major influence on the natural exchange between cold and warm periods in the southern hemisphere. An international research team under the management of the Alfred Wegener Institute in Bremerhaven was able to prove that dust infiltrations there were 2 to 3 times higher during all the ice ages in the last million years than in the warm phases in climatic history.

“High large-area dust supply can have an effect on the climate for two major reasons,” explained Dr. Frank Lamy, geoscientist at the Alfred Wegener Institute, Helmholtz Centre for Polar and Marine Research, about the findings. “Trace substances such as iron, which are essential for life, can be incorporated into the ocean through dust. This stimulates biological production and increases the sea’s capacity to bind carbon. The result is that the greenhouse gas carbon dioxide is taken out of the atmosphere. In the atmosphere itself, dust reflects the sun’s radiation and purely due to this it reduces the heat input into Earth’s system. Both effects lead to the fact that the Earth cools down.” Lamy is the main author of the study which will be published in the journal Science on the 24th January 2014. Other participants included geochemist Gisela Winckler from the US Lamont-Doherty Earth Observatory and the Bremen Centre for Marine Environmental Sciences MARUM.

The influence of dust supply on the climate changes between ice ages and warm periods has long been suspected. Climatic researchers always found particularly high dust content containing iron when Earth was going through an ice age, both in Antarctic ice cores and in sediment cores from the Atlantic part of the Southern Ocean. However, up to now there was no data available for the Pacific section, which covers 50% of the Southern Ocean. “We can now close this central gap” is how Lamy underlines the importance of the new study. “The result is that we are now finding the same patterns in the South Pacific that we found in cores from the South Atlantic and the Antarctic ice. Therefore, the increased dust input was a phenomenon affecting the southern hemisphere during colder periods. This means that they now have to be considered differently when assessing the complex mechanisms which control natural climate changes.”

What sounds almost incidental in Lamy’s words is something of considerable relevance for research. This is because up to now many scientists were convinced that dust supply to the Pacific area could not have been higher during the ice ages than during warmer periods of Earth’s climate history. Where could larger dust quantities in this area of Earth’s oceans come from? Up to now, South Patagonia was suspected as a geological dust source since it is the only landmass in the Southern Ocean, intruding into it like a huge finger. However, since the wind predominating in this part of the world comes from the West, any dust particles in the air originating from South America mostly drift towards the Atlantic. For this reason, data from the South Pacific has been on scientists’ wishlists for a long time.

However, the Pacific section of the Southern Ocean has remained something of a “terra incognita” for researchers despite modern technology. It is considered to be one of the most remote parts of the world’s oceans. “The region is influenced by extreme storms and swells in which wave heights of 10 m or more are not uncommon. The area is also complicated from logistic point of view due to the huge distance between larger harbours” is how AWI scientist Dr. Rainer Gersonde, co-author and at the time leader of the Polarstern expedition, explains the extraordinary challenges faced by the research voyage. The Polarstern made a voyage of 10,000 nautical miles or 18,500 km through this particularly inhospitable part of the Antarctic Ocean in order to obtain high quality and sufficiently long sediment cores.

The question is, however, where did the historic dust freight towards the South Pacific come from, and why did the phases of increased input take place at all? Frank Lamy believes that one of the causes is the relocation or extension of the exceptionally strong wind belts prevalent in this region towards the Equator. The entire Southern Ocean is notorious amongst sailors for its powerful westerly winds — the “Roaring Forties” and the “Furious Fifties.” It is considered to be one of the windiest regions in the world. The scientists’ theory is that a relocation or extension of this powerful westerly wind belt towards the North could have caused the extended dry areas on the Australian continent to be influenced by stronger wind erosion. The result was higher dust infiltration into the Pacific Ocean — with the consequences described above. On top of this, New Zealand was an additional dust source. The extended glaciation of the mountains there during the ice age provided considerable quantities of fine-grained material which was then blown far out into the South Pacific by the winds.

“Our investigations have now proved without a doubt that colder periods in the southern hemisphere over a period of 1 million years always and almost everywhere coincided, , with lower carbon dioxide content in the atmosphere and higher dust supply from the air. The climatic history of the Earth was, therefore, written in dust.”

Note : The above story is based on materials provided by Alfred Wegener Institute, Helmholtz Centre for Polar and Marine Research, via EurekAlert!, a service of AAAS. 

Interplanetary Dust Particles Could Deliver Water and Organics to Jump-Start Life On Earth

The surfaces of tiny interplanetary dust particles are space-weathered by the solar wind, causing amorphous rims to form on their surfaces. Hydrogen ions in the solar wind react with oxygen in the rims to form tiny water-filled vesicles (blue). This mechanism of water formation almost certainly occurs in other planetary systems with potential implications for the origin of life throughout the galaxy. (Credit: John Bradley, UH SOEST/ LLNL)

Researchers from the University of Hawaii — Manoa (UHM) School of Ocean and Earth Science and Technology (SOEST), Lawrence Livermore National Laboratory, Lawrence Berkeley National Laboratory, and University of California — Berkeley discovered that interplanetary dust particles (IDPs) could deliver water and organics to Earth and other terrestrial planets.

Interplanetary dust, dust that has come from comets, asteroids, and leftover debris from the birth of the solar system, continually rains down on Earth and other Solar System bodies. These particles are bombarded by solar wind, predominately hydrogen ions. This ion bombardment knocks the atoms out of order in the silicate mineral crystal and leaves behind oxygen that is more available to react with hydrogen, for example, to create water molecules.

“It is a thrilling possibility that this influx of dust has acted as a continuous rainfall of little reaction vessels containing both the water and organics needed for the eventual origin of life on Earth and possibly Mars,” said Hope Ishii, new Associate Researcher in the Hawaii Institute of Geophysics and Planetology (HIGP) at UHM SOEST and co-author of the study. This mechanism of delivering both water and organics simultaneously would also work for exoplanets, worlds that orbit other stars. These raw ingredients of dust and hydrogen ions from their parent star would allow the process to happen in almost any planetary system.

Implications of this work are potentially huge: Airless bodies in space such as asteroids and the Moon, with ubiquitous silicate minerals, are constantly being exposed to solar wind irradiation that can generate water. In fact, this mechanism of water formation would help explain remotely sensed data of the Moon, which discovered OH and preliminary water, and possibly explains the source of water ice in permanently shadowed regions of the Moon.

“Perhaps more exciting,” said Ishii, “interplanetary dust, especially dust from primitive asteroids and comets, has long been known to carry organic carbon species that survive entering the Earth’s atmosphere, and we have now demonstrated that it also carries solar-wind-generated water. So we have shown for the first time that water and organics can be delivered together.”

It has been known since the Apollo-era, when astronauts brought back rocks and soil from the Moon, that solar wind causes the chemical makeup of the dust’s surface layer to change. Hence, the idea that solar wind irradiation might produce water-species has been around since then, but whether it actually does produce water has been debated. The reasons for the uncertainty are that the amount of water produced is small and it is localized in very thin rims on the surfaces of silicate minerals so that older analytical techniques were unable to confirm the presence of water.

Using a state-of-the-art transmission electron microscope, the scientists have now actually detected water produced by solar-wind irradiation in the space-weathered rims on silicate minerals in interplanetary dust particles. Futher, on the bases of laboratory-irradiated minerals that have similar amorphous rims, they were able to conclude that the water forms from the interaction of solar wind hydrogen ions (H+) with oxygen in the silicate mineral grains.

This recent work does not suggest how much water may have been delivered to Earth in this manner from IDPs.

“In no way do we suggest that it was sufficient to form oceans, for example,” said Ishii. “However, the relevance of our work is not the origin of the Earth’s oceans but that we have shown continuous, co-delivery of water and organics intimately intermixed.”

In future work, the scientists will attempt to estimate water abundances delivered to Earth by IDPs. Further, they will explore in more detail what other organic (carbon-based) and inorganic species are present in the water in the vesicles in interplanetary dust rims.

Note : The above story is based on materials provided by University of Hawaii. 

Devilline

Richtárová, Staré Hory, Banská Bystrica Co., Banská Bystrica Region, Slovakia Photo Copyright © tomas bancik

Chemical Formula: CaCu4(SO4)2(OH)6 · 3H2O
Locality: Cornwall, England, UK
Name Origin: Named after the French chemist, H. E. S. C. Deville (1818-1881). Named from its occurrence at Herrengrund, north of Neusohl, in Slovakia of Czechoslovakia.

Devilline is a sulfate mineral with the chemical formula CaCu4(SO4)2(OH)6 · 3H2O. The name originates from the French chemist’s name, Henri Etienne Sainte-Claire Deville (1818–1881).

Devilline crystallizes in the monoclinic system. Crystallographically, it contains three vectors of unequal lengths and two pairs of vectors are perpendicular while the other pair makes an angle other than 90°. Devilline is prismatic and belongs to the crystal class 2/m. This mineral belongs to the space group P 21/c. Devilline is an anisotropic mineral, meaning that the mineral has different properties in different directions. Optically, this mineral is biaxial negative, meaning that it contains two optic axes. Devilline has a moderate mineral relief. Mineral relief refers to the way a mineral appears to stand out when viewed under polarized light and it is dependent on the mineral’s index of refraction.

Devilline is a rare and unusual secondary mineral found in the oxidized portions of copper sulfide ore deposits. Because Devilline occurs in such oxidation zones, this mineral often is of post-mining origin. Devilline is found in mines all around the world.

Physical Properties of Devilline

Cleavage: {001} Perfect, {110} Distinct
Color: Blue, Blue green, Blue white, White, Dark green.
Density: 3.1 – 3.13, Average = 3.11
Diaphaneity: Transparent
Fracture: Uneven – Flat surfaces (not cleavage) fractured in an uneven pattern.
Hardness: 2.5 – Finger Nail
Luster: Vitreous – Pearly
Streak: light green

Photos :

LAVENDULAN, SERPIERITE and DEVILLINE Tsumeb Mine, Tsumeb, Otjikoto Region, Namibia, Africa Size: 3.8 x 3.2 x 0.6 cm (Miniature) Owner: Kristalle and Crystal Classics
SERPIERITE and DEVILLINE Tsumeb Mine, Tsumeb, Otjikoto Region, Namibia, Africa Size: 3.8 x 3 x 2 cm (Miniature) Owner: Kristalle and Crystal Classics
DEVILLINE Spania Dolina Ore Belt, Banska Bystrica Region, Slovakia, Europe Size: 6 x 4 x 3 cm (Small Cabinet) Owner: Kristalle and Crystal Classics

“Sedimentary Bathtub” Amplifies Earthquakes

Multiple scenarios for earthquakes within the Georgia Basin underneath Vancouver indicate that earthquakes would be amplified. (Credit: Sheri Molnar and Kim Olsen)

Like an amphitheater amplifies sound, the stiff, sturdy soil beneath the Greater Vancouver metropolitan area could greatly amplify the effects of an earthquake, pushing the potential devastation past what building codes in the region are prepared for. That’s the conclusion behind a pair of studies recently coauthored by San Diego State University seismologist Kim Olsen.

Greater Vancouver sits atop a tectonic plate known as the Juan de Fuca Plate, which extends south to encompass Washington and Oregon states. The subterranean region of this plate beneath Vancouver is a bowl-shaped mass of rigid soil called the Georgia Basin. Earthquakes can and do occur in the Georgia Basin and can originate deep within the earth, between 50 and 70 kilometers down, or as shallow as a couple kilometers.

While earthquake researchers have long known that the region is tectonically active and policymakers have enforced building codes designed to protect against earthquakes, those codes aren’t quite strict enough because seismologists have failed to account for how the Georgia Basin affects a quake’s severity, Olsen said. In large part, that’s because until recently the problem has been too computationally complex, he said.

“People have neglected the effects of stiffer soil,” Olsen said. “They haven’t been able to look at the basin as a three-dimensional object.”

The idea to investigate the basin’s effect on earthquakes originated with Sheri Molnar, a postdoctoral researcher at the University of British Columbia. She reached out to Olsen, an expert in earthquake simulation, for help modeling the problem. Using supercomputer technology, Olsen has previously simulated the potential effects of a supermassive magnitude 8.0 quake in Southern California.

Using the same technology, Molnar and Olsen coded an algorithm to take into account the stiff-soil geography of the Georgia Basin to see how it would influence the surface effects of a magnitude 6.8 earthquake. They then ran the simulation for both a shallow and a deep quake.

In both simulations they found that the basin had an amplifying effect on motion on the surface, but the amplification was especially pronounced in shallow earthquakes. In the latter scenario, their model predicts that the sedimentary basin would cause the surface to shake for approximately 22 seconds longer than normal.

“The deep structure of the Georgia Basin can amplify the ground motion of an earthquake by a factor of three or more,” Olsen said. “It’s an irregularly shaped bathtub of sediments that can trap and amplify the waves.”

The deep and shallow studies were published today in the Bulletin of the Seismological Society of America.

Current building codes in Vancouver don’t take into account this amplification, Olsen added, meaning many buildings in the region would be in danger if a large earthquake were to hit.

Vancouver isn’t the only large metropolis built atop sedimentary basins. Los Angeles and San Francisco, too, sit on basins similar to the Georgia Basin. Olsen is currently investigating how major earthquakes along the San Andreas Fault would be affected by these basins.

He hopes that city planners can use this knowledge to update their building codes to reflect the amplifying geography beneath their feet.

“That’s always going to be the goal, to make structures safer and to mitigate the damage in the future,” Olsen said.

Note : The above story is based on materials provided by  Michael Price for Seismological Society of America

Source of Galapagos Eruptions Not Where Models Place It

Birds flock not far from a volcano on Isabella Island, where two still active volcanoes are located. The location of the mantle plume, to the southeast of where computer modeling had put it, may explain the continued activity of volcanoes on the various Galapagos Islands. (Credit: Douglas Toomey)

Images gathered by University of Oregon scientists using seismic waves penetrating to a depth of 300 kilometers (almost 200 miles) report the discovery of an anomaly that likely is the volcanic mantle plume of the Galapagos Islands. It’s not where geologists and computer modeling had assumed.

The team’s experiments put the suspected plume at a depth of 250 kilometers (155 miles), at a location about 150 kilometers (about 100 miles) southeast of Fernandina Island, the westernmost island of the chain, and where generations of geologists and computer-generated mantle convection models have placed the plume.

The plume anomaly is consistent with partial melting, melt extraction, and remixing of hot rocks and is spreading north toward the mid-ocean ridge instead of, as projected, eastward with the migrating Nazca plate on which the island chain sits, says co-author Douglas R. Toomey, a professor in the UO’s Department of Geological Sciences.

The findings — published online Jan. 19 ahead of print in the February issue of the journal Nature Geoscience — “help explain why so many of the volcanoes in the Galapagos are active,” Toomey said.

The Galapagos chain covers roughly 3,040 square miles of ocean and is centered about 575 miles west of Ecuador, which governs the islands. Galapagos volcanic activity has been difficult to understand, Toomey said, because conventional wisdom and modeling say newer eruptions should be moving ahead of the plate, not unlike the long-migrating Yellowstone hotspot.

The separating angles of the two plates in the Galapagos region cloud easy understanding. The leading edge of the Nazca plate is at Fernandina. The Cocos plate, on which the islands’ some 1,000-kilometer-long (620-miles) hotspot chain once sat, is moving to the northeast.

The suspected plume’s location is closer to Isabella and Floreana islands. While a dozen volcanoes remain active in the archipelago, the three most volatile are Fernandina’s and the Cerro Azul and Sierra Negra volcanoes on the southwest and southeast tips, respectively, of Isabella Island, the archipelago’s largest landmass.

The plume’s more southern location, Toomey said, adds fuel to his group’s findings, at three different sites along the globe encircling mid-ocean ridge (where 85 percent of Earth’s volcanic activity occurs), that Earth’s internal convection doesn’t always adhere to modeling efforts and raises new questions about how ocean plates at Earth’s surface — the lithosphere — interact with the hotter, more fluid asthenosphere that sits atop the mantle.

“Ocean islands have always been enigmatic,” said co-author Dennis J. Geist of the Department of Geological Sciences at the University of Idaho. “Why out in the middle of the ocean basins do you get these big volcanoes? The Galapagos, Hawaii, Tahiti, Iceland — all the world’s great ocean islands — they’re mysterious.”

The Galapagos plume, according to the new paper, extends up into shallower depths and tracks northward and perpendicular to plate motion. Mantle plumes, such as the Galapagos, Yellowstone and Hawaii, generally are believed to bend in the direction of plate migration. In the Galapagos, however, the volcanic plume has decoupled from the plates involved.

“Here’s an archipelago of volcanic islands that are broadly active over a large region, and the plume is almost decoupled from the plate motion itself,” Toomey said. “It is going opposite than expected, and we don’t know why.”

The answer may be in the still unknown rheology of the gooey asthenosphere on which Earth’s plates ride, Toomey said. In their conclusion, the paper’s five co-authors theorize that the plume material is carried to the mid-ocean ridge by a deep return flow centered in the asthenosphere rather than flowing along the base of the lithosphere as in modeling projections.

“Researchers at the University of Oregon are using tools and technologies to yield critical insights into complex scientific questions,” said Kimberly Andrews Espy, vice president for research and innovation and dean of the UO Graduate School. “This research by Dr. Toomey and his team sheds new light on the volcanic activity of the Galapagos Islands and raises new questions about plate tectonics and the interaction between the zones of Earth’s mantle.”

Note : The above story is based on materials provided by University of Oregon. 

Organic Chemical Origins in Hydrothermal Systems

Geological map of the western Shiroumadake area. Circles and star indicate the studied hot springs. The star represents the location of the Hakuba Happo hot spring. (Credit: Image courtesy of Tokyo Institute of Technology)

Serpentinite-hosted hydrothermal systems have been suggested as likely sites for the formation of organic compounds in the abiotic conditions of early Earth, that is, in the absence of living organisms.

“Such compounds were likely crucial for the chemical evolution of life,” explain Konomi Suda and colleagues at Tokyo Institute of Technology, Japan Agency of Marine-Earth Science and Technology and the Open University of Japan. Their latest research identifies mechanisms in the abiotic formation of the organic compound methane in serpentinite-hosted hydrothermal systems, a process that so far has not been satisfactorily understood.

The researchers compared water samples from a series of hot springs in the Shiroumadake area in Japan. Here due to recent volcanic activity they could study ongoing serpentinisation processes.

They measured the pH and temperature as well as the gas and ion content of the water samples in terms of both concentration and the ratio of different isotopes of the chemical constituents. Different isotopes of the same chemical differ in the number of neutrons in the nucleus. Each reaction yield characteristic isotope ratio because reaction rate of each isotopes are slightly different depending on processes.

Suda and colleagues found unexpected values for the ratio of different isotopes in the methane (CH4) and molecular hydrogen (H2) dissolved in the water, and the water itself (H2O) at the hot spring Hakuba Happo. In serpentinite-hosted hydrothermal systems methane was thought to form from synthesis with molecular hydrogen.

However the researchers found that the ratio of different isotopes and chemicals could not be explained for this process in the temperature and pH conditions they had measured. They conclude,

“Based on a comparison of the hydrogen isotope systematics of our results with those of other serpentinite-hosted hydrothermal systems, we suggest that abiotic CH4 production directly from H2O (without mediation by H2) may be more common in serpentinite-hosted systems.”

Background

Methane and organic compounds

Organic compounds are carbon based chemicals. The simplest organic compounds are strings of carbon atoms bonded to hydrogen. These hydrogen bonds can substitute with other atoms and molecules to provide the wide ranging organic chemicals that are found in living organisms.

Methane is the simplest organic compound comprising just one carbon atom bonded to four hydrogens. In the absence of living organisms methane synthesis can occur through abiotic mechanisms, which likely played a significant role in the early Earth environment. Possible abiotic mechanisms include the formation of methane directly from H2O or H2. The formation mechanism and conditions such as temperature and pH determine the relative levels of different isotopes.

The hot spring Hakuba Happo

The researchers compared water samples from five hot springs in the Shiroumadake area in Japan. One of these sites is Hakuba Happo, a newly discovered serpentinite-hosted system. Serpentinite is a rock that results from the geochemical processes of hydration and metamorphic transformation of ultramafic rock from Earth’s mantle.

The water at Hakuba Happo is pumped up from two drilling wells Happo #1 and Happo #3. It is one of the most alkaline hot springs in Japan and the concentration of CH4 was 10-100 times that of the other hot springs.

Isotopic fractionation and fractionation equilibrium

Different chemical isotopes that differ by the number of neutrons in the atomic nuclei form the same chemical compounds. For example both hydrogen (no neutrons in the nucleus) and deuterium (one neutron in the nucleus) can form molecular hydrogen (H2), water (H2O) and methane (CH4).

Processes described as ‘fractionation’ affect the relative abundance of different isotopes in the chemical compounds in a given system. Fractionation equilibrium describes the system when the abundance of isotopes in the different chemicals no longer changes with time. Comparing known fractionation equilibrium values with the measured isotopic abundance provides clues of processes that have taken place in the system.

Note : The above story is based on materials provided by Tokyo Institute of Technology, via ResearchSEA. 

Descloizite

Berg Aukas (Berg Aukus), Grootfontein District, Otjozondjupa Region, Namibia © Rob Lavinsky

Chemical Formula: Pb(Zn,Cu)(VO4)(OH)
Locality: Sierra de Córdoba, Punilla Department, Córdoba, Argentina
Name Origin: Named after the French mineralogist, Alfred Des Closzeaux (1817-1897).

Descloizite is a rare mineral species consisting of basic lead and zinc vanadate, Pb(Zn,Cu)(VO4)(OH), crystallizing in the orthorhombic crystal system and isomorphous with olivenite. Appreciable gallium and germanium may also be incorporated into the crystal structure.

The color is deep cherry-red to brown or black, and the crystals are transparent or translucent with a greasy lustre; the streak is orange-yellow to brown; specific gravity 5.9 to 6.2; hardness 31/2. A variety known as cuprodescloizite is dull green in color; it contains a considerable amount of copper replacing zinc and some arsenic replacing vanadium. There is also an arsenate analogue called arsendescloizite.

Discovery and occurrence

It was discovered in the Sierra de Córdoba deposit in Córdoba, Argentina in 1854 and named in honor of the French mineralogist Alfred Des Cloizeaux (1817–1897). It occurs as small prismatic or pyramidal crystals, usually forming drusy crusts and stalactitic aggregates; also as fibrous encrusting masses with a mammillary surface.

Descloizite occurs in oxidised portions of veins of lead ores in association with pyromorphite, vanadinite, wulfenite, mottramite, mimetite and cerussite.

The Otavi (“O-tarvi”) Mountainland of northern Namibia was once considered home to the greatest vanadium deposits in the world, including those at Berg Aukas (“OW-cuss”), Abenab (“UB-en-ub”), Baltika (“BUL-tika”) and Uitsab (“ATE-sub”). Descloizite and mottramite were the main ore minerals in each of these deposits, which are now exhausted. Other localities are the Sierra de Cordoba in Argentina; Lake Valley in Sierra County, New Mexico; Arizona; Phoenixville in Pennsylvania and Obir, Carinthia Austria.

Physical Properties of Descloizite

Cleavage: None
Color: Dark brownish black, Dark reddish brown, Orange red, Reddish brown, Black.
Density: 6.1 – 6.2, Average = 6.15
Diaphaneity: Transparent to Opaque
Fracture: Brittle – Generally displayed by glasses and most non-metallic minerals.
Hardness: 3.5 – Copper Penny
Luminescence: Non-fluorescent.
Luster: Greasy (Oily)
Streak: light brownish green

Photos :

Descloizite Berg Aukas, Grootfontein District, Otjozondjupa Region, Namibia Size: 8.5 x 6.5 x 5.5 cm © danweinrich
Descloizite Berg Aukas, Grootfontein District, Otjozondjupa Region, Namibia Size: 10.0 x 7.5 x 5.0 cm © danweinrich
Descloizite Mina da Preguiça, Sobral da Adiça, Moura, Beja  Portugal (2005-2006) Specimen size: 10.3 × 6.5 × 4.2 cm = 4.1” × 2.6” × 1.7” Main crystal size: 0.1 × 0.1 cm = 0.0” × 0.0” © Fabre Minerals
This sample of descloizite is displayed in the Smithsonian Museum of Natural History. The sample at left is about 10 cm across and is from Grootfontein, Namibia.

Neoarchean Era

The Neoarchean is a geologic era within the Archaean. It spans the period of time from 2,800 to 2,500 million years ago—the period being defined chronometrically and not referenced to a specific level in a rock section on Earth. Oxygenic photosynthesis first evolved in this era and was accountable for the oxygen catastrophe which was to happen later in the Paleoproterozoic from a poisonous buildup of oxygen in the atmosphere, produced by these oxygen producing photoautotrophs, which evolved earlier in the Neoarchean. The supercontinent Kenorland formed during this period, about 2,700 million years ago.

Note : The above story is based on materials provided by Wikipedia

Mesoarchean Era

The Mesoarchean  is a geologic era within the Archean, spanning 3,200 to 2,800 million years ago. The period is defined chronometrically and is not referenced to a specific level in a rock section on Earth. Fossils from Australia show that stromatolites have lived on Earth since the Mesoarchean. The Pongola glaciation occurred at 2,900 million years ago. The first supercontinent Vaalbara broke up during this time around 2,800 million years ago.

Note : The above story is based on materials provided by Wikipedia

Paleoarchean Era

The Paleoarchean (/ˌpeɪlɪ.oʊ.ɑrˈkiːən/; also spelled Palaeoarchaean (Formerly known as early Archean)) is a geologic era within the Archaean. It spans the period of time 3,600 to 3,200 million years ago—the period being defined chronometrically and not referenced to a specific level in a rock section on Earth. The name derives from Greek “Palaios” ancient.
The oldest ascertained life form (well-preserved bacteria older than 3,460 million years found in Western Australia) is from this period. The 1st supercontinent Vaalbara formed during this period.

Stromatolites – Pilbara craton Western Australia

Note : The above story is based on materials provided by Wikipedia

Jefferson River

Confluence of Beaverhead and Big Hole Rivers forming the Jefferson near Twin Bridges, Montana

Table of Contents

The Jefferson River is a tributary of the Missouri River, approximately 83 miles (134 km) long, in the U.S. state of Montana. The Jefferson River and the Madison River form the official beginning of the Missouri at Missouri Headwaters State Park near Three Forks. It is joined 0.6 miles (1.0 km) downstream (northeast) by the Gallatin.

From broad valleys to a narrow canyon, the Jefferson River passes through a region of significant geological diversity, with some of the oldest and youngest rocks of North America and a diversity of igneous, metamorphic, and sedimentary formations.

The region was only intermittently inhabited by Native Americans until relatively recent times, and no single tribe had exclusive use of the Jefferson River when the Lewis and Clark Expedition first ascended the river in 1805. Today, the Jefferson River retains much of its scenic beauty and wildlife diversity from the days of Lewis and Clark, yet is threatened by water use issues and encroaching development. The Jefferson is a segment of the Lewis and Clark National Historic Trail, administered by the National Park Service.

Course

Jefferson River near Parrot Castle, October 2007

From the Rocky Mountains of southwestern Montana, three small rivers converge to form the headwaters of the Jefferson River. The longest begins at Brower’s Spring, 9,030 feet (2,750 m) above sea level, on the northern flank of the Centennial Mountains. The site is marked by pile of rocks. The water flows west then north as Hell Roaring Creek before merging with Rock Creek and flowing west through Upper and Lower Red Rock Lakes. Here it becomes the Red Rock River, flowing west through Lima Reservoir and then northwest into Clark Canyon Reservoir near Dillon. Below the dam, the river is known as the Beaverhead River. It is joined by the Ruby River above the town of Twin Bridges and converges with the Big Hole River to form the Jefferson about two miles downstream from town.

The Jefferson River flows north through the Jefferson Valley towards Whitehall and then east, where it is joined by the Boulder River before passing through the narrow Jefferson River canyon near Lewis and Clark Caverns State Park. After the canyon, the river passes into a broad valley again near Willow Creek. The Jefferson converges with the Madison River at Missouri Headwaters State Park near Three Forks to form the Missouri River, joined a short distance downstream by the Gallatin River.

Geology

The geology of the Jefferson River and the surrounding mountain ranges includes some of the oldest rocks found in North America, dating back to the Archean Eon, 2.7 billion years ago. Found primarily in the Tobacco Root and Ruby ranges, these ancient rocks are metamorphic, having been highly compressed and nearly re-melted by geologic forces over eons of time. Frequently found along the Jefferson River, these rocks include layered feldspars, gneiss, glassy quartz, heavy dark amphibolite, and sometimes marble.
Small marine fossils can be found in the Madison Group limestone that makes up the steep, narrow section of the Jefferson River canyon.
About a billion years ago, the Willow Creek Fault, north of the Jefferson River canyon, dropped down deeply and filled with seawater, stretching north to Alberta and British Columbia. Eventually, the sea receded and erosion wore away intervening geologic history until about 530 million years ago, during the Cambrian Period of the Paleozoic Era.

A new sea encroached on the land, depositing sedimentary layers of limestone, dolomite, shale, and sandstone over several hundred million years. Limestone is generally made of calcium from marine animals that have been compacted and cemented together. Dolomite is similar but has more magnesium. Shale is formed from fine-grained mud, silts, and clays that have been compacted and cemented together. The sandstone is made up of quartz and feldspar.By the Mississippian Period, 340 million years ago, much of western North America was covered with a warm, shallow sea, much like the Gulf Coast of Florida today. Small marine fossils can be found in the Madison Group limestone that makes up the steep, narrow section of the Jefferson River canyon today.

Gentle uplift eventually raised the region above sea level again. Rainwater percolated down through cracks in the limestone, dissolving rock and creating caves such as those found at Lewis and Clark Caverns State Park.

Local mountains, such as the Tobacco Roots were formed from the Boulder Batholith. The batholith is composed of at least seven, and possibly as many as fourteen, discrete igneous rock masses called plutons, which formed beneath the Earth’s surface during a period of magma intrusion about 73 to 78 million years ago during the Late Cretaceous. The rising buoyant plutons resulted from subduction along what was then the west coast of North America. Regional uplift brought the deep-seated granite to the surface, where erosion exposed the rocks and the mineral veins they contained. The granite generally consists of quartz, hornblende, and feldspars. Gold, silver, and other semi precious minerals are also associated with batholiths.

The ancient metamorphic and more recent sedimentary layers above the batholiths eroded away as the magma pushed up through the crust. Thus, the granite batholiths are typically found at the center of local mountain ranges, while the much older metamorphic gneiss is usually found lower in the mountains, and limestone layers are mostly found in the foothills nearest the Jefferson River.

The Rocky Mountains began a new and continuing phase of crustal stress 5 to 10 million years ago as tectonic forces began to pull the region apart. Blocks of earth dropped down to form valleys, and the Jefferson River eroded a channel through rock to form the Jefferson River canyon.

Note : The above story is reprinted from materials provided by Wikipedia

Delafossite

Locality: Clara Mine, Rankach valley, Oberwolfach, Wolfach, Black Forest, Baden-Württemberg, Germany Field of view: 2.12 mm Copyright © Gerhard Niceus

Chemical Formula: CuFeO2
Locality: Calumet and Arizona mine, Bisbee, Cochise Co., Arizona, USA.
Name Origin: Named for Gabrial Delafosse (1796-1878), French mineralogist and crystallographer.

Delafossite is a copper iron oxide mineral with formula CuFeO2 or Cu1+Fe3+O2. It is member of the delafossite mineral group with a general formula ABO2, a group characterized by a sheet of linearly coordinated A cations stacked between edge-shared octahedral layers (BO6).

Delafossite along with other minerals of the ABO2 group has been recognized for its electrical properties from insulation to metallic conduction. Delafossite is usually a secondary mineral that crystallizes near oxidized copper and is rarely a primary mineral.

Geologic occurrence

In 1873, delafossite was discovered by Charles Friedel in a region of Ekaterinbug, Siberia. Since its discovery it has been identified as a fairly common mineral found in such places as the copper mines of in Bisbee, Arizona. Delafossite is usually a secondary mineral often found in oxidized areas of copper deposits although it can be a primary mineral as well. Delafossite can be found as massive, relatively distinct crystals on hematite. Delafossite has since been found in mines around the world from Germany to Chile.

Physical Properties of Delafossite

Cleavage: {1010} Indistinct
Color: Black.
Density: 5.41
Diaphaneity: Opaque
Fracture: Brittle – Generally displayed by glasses and most non-metallic minerals.
Hardness: 5.5 – Knife Blade
Luminescence: Non-fluorescent.
Luster: Metallic
Magnetism: Magnetic after heating
Streak: black

Photo :

This sample of delafossite is displayed in the Smithsonian Museum of Natural History. This sample is about 10×10 cm overall. It is from Calumet and Arizona Mine, Cochise County, Arizona.
Delafossite, Cuprite Locality: Le Moulinal Mine, Saint-Jean-de-Jeannes, Paulinet, Alban, Tarn, Midi-Pyrénées, France Dimensions: 41 mm x 35 mm x 31 mm Field of View: 9 mm Copyright © Pascale & Daniel Journet
Delafossite, Copper Locality: Clara Mine, Rankach valley, Oberwolfach, Wolfach, Black Forest, Baden-Württemberg, Germany FOV: 3 mm. Copyright © Stephan Wolfsried

Megafloods: What They Leave Behind

Stubby Canyon, Malad Gorge State Park, Idaho. (Credit: Michael Lamb)

South-central Idaho and the surface of Mars have an interesting geological feature in common: amphitheater-headed canyons. These U-shaped canyons with tall vertical headwalls are found near the Snake River in Idaho as well as on the surface of Mars, according to photographs taken by satellites. Various explanations for how these canyons formed have been offered — some for Mars, some for Idaho, some for both — but in a paper published the week of December 16 in the online issue of Proceedings of the National Academy of Sciences, Caltech professor of geology Michael P. Lamb, Benjamin Mackey, formerly a postdoctoral fellow at Caltech, and W. M. Keck Foundation Professor of Geochemistry Kenneth A. Farley offer a plausible account that all these canyons were created by enormous floods.

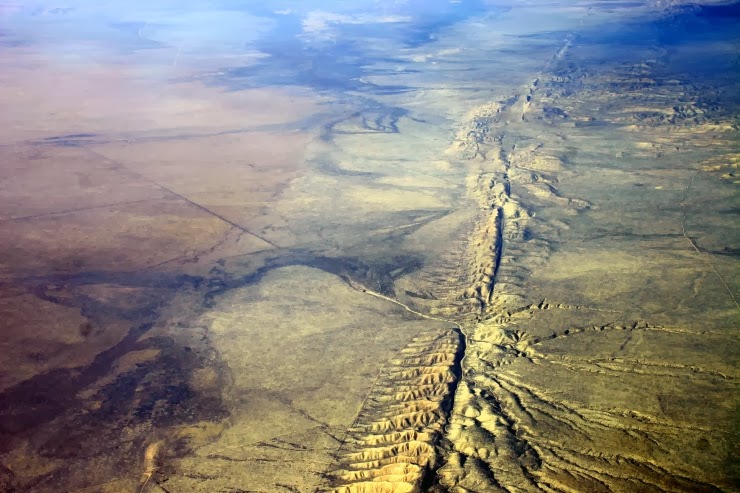
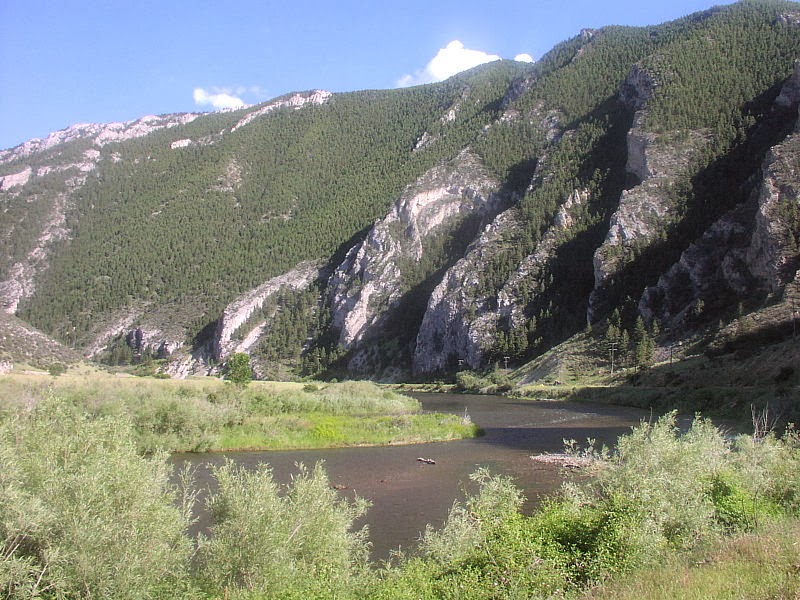
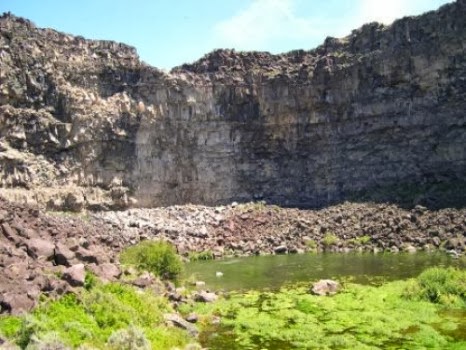
Canyons in Malad Gorge State Park, Idaho, are carved into a relatively flat plain composed of a type of volcanic rock known as basalt. The basalt originated from a hotspot, located in what is now Yellowstone Park, which has been active for the last few million years. Two canyons in Malad Gorge, Woody’s Cove and Stubby Canyon, are characterized by tall vertical headwalls, roughly 150 feet high, that curve around to form an amphitheater. Other amphitheater-headed canyons can be found nearby, outside the Gorge — Box Canyon, Blue Lakes Canyon, and Devil’s Corral — and also elsewhere on Earth, such as in Iceland.

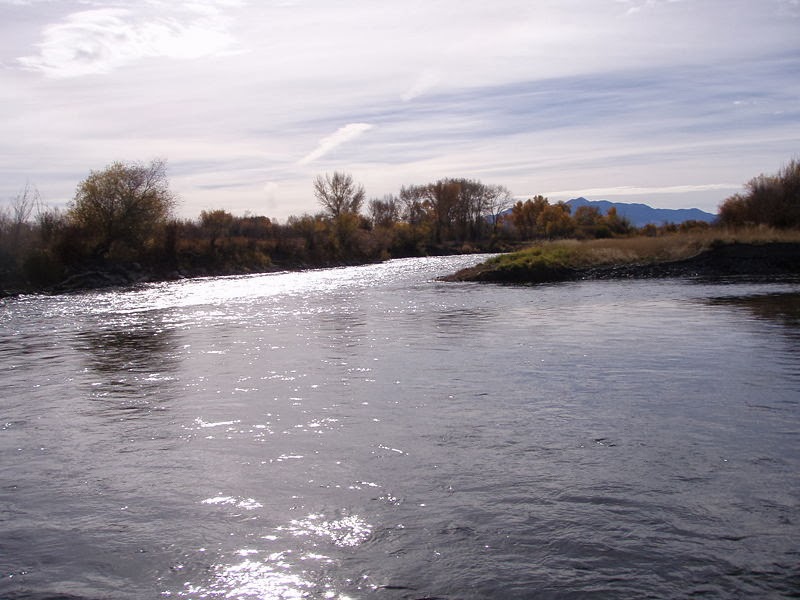
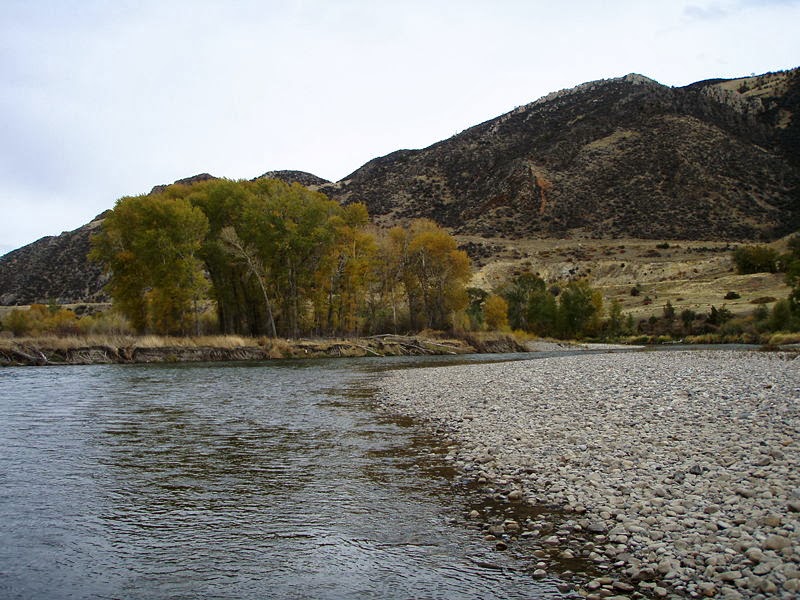
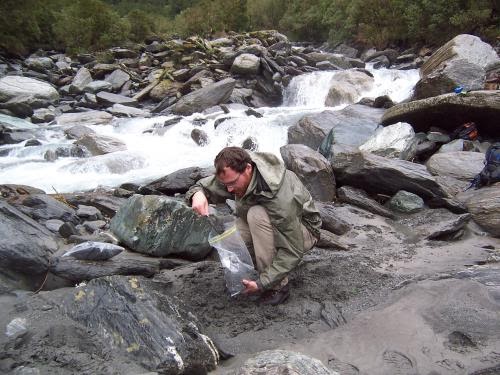
To figure out how they formed, Lamb and Mackey conducted field surveys and collected rock samples from Woody’s Cove, Stubby Canyon, and a third canyon in Malad Gorge, known as Pointed Canyon. As its name indicates, Pointed Canyon ends not in an amphitheater but in a point, as it progressively narrows in the upstream direction toward the plateau at an average 7 percent grade. Through Pointed Canyon flows the Wood River, a tributary of the larger Snake River, which in turn empties into the Columbia River on its way to the Pacific Ocean.

Geologists have a good understanding of how the rocks in Woody’s Cove and Stubby Canyon achieved their characteristic appearance. The lava flows that hardened into basalt were initially laid down in layers, some more than six feet thick. As the lava cooled, it contracted and cracked, just as mud does when it dries. This produced vertical cracks across the entire layer of lava-turned-basalt. As each additional sheet of lava covered the same land, it too cooled and cracked vertically, leaving a wall that, when exposed, looks like stacks of tall blocks, slightly offset from one another with each additional layer. This type of structure is called columnar basalt.

While the formation of columnar basalt is well understood, it is not clear how, at Woody’s Cove and Stubby Canyon, the vertical walls became exposed or how they took on their curved shapes. The conventional explanation is that the canyons were formed via a process called “groundwater sapping,” in which springs at the bottom of the canyon gradually carve tunnels at the base of the rock wall until this undercutting destabilizes the structure so much that blocks or columns of basalt fall off from above, creating the amphitheater below.

This explanation has not been corroborated by the Caltech team’s observations, for two reasons. First, there is no evidence of undercutting, even though there are existing springs at the base of Woody’s Cove and Stubby Canyon. Second, undercutting should leave large boulders in place at the foot of the canyon, at least until they are dissolved or carried away by groundwater. “These blocks are too big to move by spring flow, and there’s not enough time for the groundwater to have dissolved them away,” Lamb explains, “which means that large floods are needed to move them out. To make a canyon, you have to erode the canyon headwall, and you also have to evacuate the material that collapses in.”

That leaves waterfall erosion during a large flood event as the only remaining candidate for the canyon formation that occurred in Malad Gorge, the Caltech team concludes.

No water flows over the top of Woody’s Cove and Stubby Canyon today. But even a single incident of overland water flow occurring during an unusually large flood event could pluck away and topple boulders from the columnar basalt, taking advantage of the vertical fracturing already present in the volcanic rock. A flood of this magnitude could also carry boulders downstream, leaving behind the amphitheater canyons we see today without massive boulder piles at their bottoms and with no existing watercourses.

Additional evidence that at some point in the past water flowed over the plateaus near Woody’s Cove and Stubby Canyon are the presence of scour marks on surface rocks on the plateau above the canyons. These scour marks are evidence of the type of abrasion that occurs when a water discharge containing sediment moves overland.

Taken together, the evidence from Malad Gorge, Lamb says, suggests that “amphitheater shapes might be diagnostic of very large-scale floods, which would imply much larger water discharges and much shorter flow durations than predicted by the previous groundwater theory.” Lamb points out that although groundwater sapping “is often assumed to explain the origin of amphitheater-headed canyons, there is no place on Earth where it has been demonstrated to work in columnar basalt.”

Closing the case on the canyons at Malad Gorge required one further bit of information: the ages of the rock samples. This was accomplished at Caltech’s Noble Gas Lab, run by Kenneth A. Farley, W. M. Keck Foundation Professor of Geochemistry and chair of the Division of Geological and Planetary Sciences.

The key to dating surface rocks on Earth is cosmic rays — very high-energy particles from space that regularly strike Earth. “Cosmic rays interact with the atmosphere and eventually with rocks at the surface, producing alternate versions of noble gas elements, or isotopes, called cosmogenic nuclides,” Lamb explains. “If we know the cosmic-ray flux, and we measure the accumulation of nuclides in a certain mineral, then we can calculate the time that rock has been sitting at Earth’s surface.”

At the Noble Gas Lab, Farley and Mackey determined that rock samples from the heads of Woody’s Cove and Stubby Canyon had been exposed for the same length of time, approximately 46,000 years. If Lamb and his colleagues are correct, this is when the flood event occurred that plucked the boulders off the canyon walls, leaving the amphitheaters behind.

Further evidence supporting the team’s theory can be found in Pointed Canyon. Rock samples collected along the walls of the first kilometer of the canyon show progressively more exposure in the downstream direction, suggesting that the canyon is still being carved by Wood River. Using the dates of exposure revealed in the rock samples, Lamb reconstructed the probable location of Pointed Canyon at the time of the formation of Woody’s Cove and Stubby Canyon. At that location, where the rock has been exposed approximately 46,000 years, the surrounding canyon walls form the characteristic U-shape of an amphitheater-headed canyon and then abruptly narrow into the point that forms the remainder of Pointed Canyon. “The same megaflood event that created Woody’s Cove and Stubby Canyon seems to have created Pointed Canyon,” Lamb concludes. “The only difference is that the other canyons had no continuing river action, while Pointed Canyon was cut relatively slowly over the last 46,000 years by the Wood River, which is not powerful enough to topple and pluck basalt blocks from the surrounding plateau, resulting in a narrow channel rather than tall vertical headwalls.”

Solving the puzzle of how amphitheater-headed canyons are created has implications reaching far beyond south-central Idaho because similar features — though some much larger — are also present on the surface of Mars. “A very popular interpretation for the amphitheater-headed canyons on Mars is that groundwater seeps out of cracks at the base of the canyon headwalls and that no water ever went over the top,” Lamb says. Judging from the evidence in Idaho, however, it seems more likely that on Mars, as on Earth, amphitheater-headed canyons were created by enormous flood events, suggesting that Mars was once a very watery planet.

Note : The above story is based on materials provided by California Institute of Technology. The original article was written by Cynthia Eller. 

Soil production breaks geologic speed record

Isaac Larsen collects a sand sample at the Rapid Creek test site. Credit: Krista Larsen

Geologic time is shorthand for slow-paced. But new measurements from steep mountaintops in New Zealand show that rock can transform into soil more than twice as fast as previously believed possible.The findings were published Jan. 16 in the early online edition of Science.

“Some previous work had argued that there were limits to soil production,” said first author Isaac Larsen, who did the work as part of his doctoral research in Earth sciences at the University of Washington. “But no one had made the measurements.”

The finding is more than just a new speed record. Rapidly eroding mountain ranges account for at least half of the total amount of the planet’s weathering and sediment production, although they occupy just a few percent of the Earth’s surface, researchers said.

So the record-breaking production at the mountaintops has implications for the entire carbon cycle by which the Earth’s crust pushes up to form mountains, crumbles, washes with rivers and rainwater to the sea, and eventually settles to the bottom to form new rock.

“This work takes the trend between soil production rates and chemical weathering rates and extends it to much higher values than had ever been previously observed,” said Larsen, now a postdoctoral researcher at the California Institute of Technology in Pasadena.

The study site in New Zealand’s Southern Alps is “an extremely rugged mountain range,” Larsen said, with rainfall of 10 meters (33 feet) per year and slopes of about 35 degrees.

To collect samples Larsen and co-author André Eger, then a graduate student at Lincoln University in New Zealand, were dropped from a helicopter onto remote mountaintops above the tree line. They would hike down to an appropriate test site and collect 20 pounds of dirt apiece, and then trek the samples back up to their base camp. The pair stayed at each of the mountaintop sites for about three days.

“I’ve worked in a lot of places,” Larsen said. “This was the most challenging fieldwork I’ve done.”

Researchers then brought soil samples back to the UW and measured the amount of Beryllium-10, an isotope that forms only at the Earth’s surface by exposure to cosmic rays. Those measurements showed soil production rates on the ridge tops ranging from 0.1 to 2.5 millimeters (1/10 of an inch) per year, and decrease exponentially with increasing soil thickness.

The peak rate is more than twice the proposed speed limit for soil production, in which geologists wondered if in places where soil is lost very quickly, the soil production just can’t keep up. In earlier work Larsen had noticed vegetation on very steep slopes and so he proposed this project to measure soil production rates at some of the steepest, wettest locations on the planet.

The new results show that soil production and weathering rates continue to increase as the landscape gets steeper and erodes faster, and suggest that other very steep locations such as the Himalayas and the mountains in Taiwan may also have very fast soil formation.

“A couple millimeters a year sounds pretty slow to anybody but a geologist,” said co-author David Montgomery, a UW professor of Earth and space sciences. “Isaac measured two millimeters of soil production a year, so it would take just a dozen years to make an inch of soil. That’s shockingly fast for a geologist, because the conventional wisdom is it takes centuries.”

The researchers believe plant roots may be responsible here. The mountain landscape was covered with low, dense vegetation. The roots of those plants reach into cracks in the rocks, helping break them apart and expose them to rainwater and chemical weathering.

“This opens up new questions about how soil production might happen in other locations, climates and environments,” Larsen said.

Note : The above story is based on materials provided by University of Washington

Datolite

Dal’negorsk (Dalnegorsk; Tetyukhe; Tjetjuche; Tetjuche), Kavalerovo Mining District, Primorskiy Kray, Far-Eastern Region, Russia © 2001 John H. Betts

Chemical Formula: Ca(HBSiO5)
Locality: Diabases of the Connecticut River valley, USA.
Name Origin: From the Greek, dateisthai, meaning “to divide,” because granular aggregates crumble readily.

Datolite is a calcium boron hydroxide nesosilicate, Ca(HBSiO5). It was first observed by Jens Esmark in 1806, and named by him from δατεῖσθαι, “to divide,” and λίθος, “stone,” in allusion to the granular structure of the massive mineral.

Datolite crystallizes in the monoclinic system forming prismatic crystals and nodular masses. The luster is vitreous and may be brown, yellow, light green or colorless. The Mohs hardness is 5.5 and the specific gravity is 2.8 – 3.0.

The type localities are in the diabases of the Connecticut River valley and Arendal, Aust-Agder, Norway. Associated minerals include prehnite, danburite, babingtonite, epidote, native copper, calcite, quartz and zeolites. It is common in the copper deposits of the Lake Superior region of Michigan. It occurs as a secondary mineral in mafic igneous rocks often filling vesicles along with zeolites in basalt. Unlike most localities throughout the world, the occurrence of datolite in the Lake Superior region is usually fine grained in texture and possesses colored banding. Much of the coloration is due to the inclusion of copper or associated minerals in progressive stages of hydrothermal precipitation.

Botryolite is a botryoidal form of datolite.

Physical Properties of Datolite

Cleavage: None
Color: Brown, Colorless, Yellow, White, Light green.
Density: 2.8 – 3, Average = 2.9
Diaphaneity: Transparent to translucent
Fracture: Brittle – Generally displayed by glasses and most non-metallic minerals.
Hardness: 5.5 – Knife Blade
Luminescence: Non-fluorescent.
Luster: Vitreous (Glassy)
Streak: white

Photos:

This sample is described as datolite with quartz. It is about 12 cm across and is from Paterson, New Jersey. This sample of datolite displayed in the Smithsonian Museum of Natural History.
Datolite 4.1×4.0x2.3 cm La Baja Mine Charcas, San Louis de Potosi Mexico Copyright © 2011 David K. Joyce Minerals
This sample is described as datolite with copper. It is about 7cm across and is from Lake Superior District, Michigan. This sample of datolite displayed in the Smithsonian Museum of Natural History.
Datolite – Bor Pit, Dal’negorsk B deposit, Dal’negorsk, Primorskiy Kray, Russia Size: 12.2 x 4.6 x 2.3 cm Copyright © danweinrich

Eoarchean Era

In the geologic record the Eoarchean (/ˌiːoʊ.ɑrˈkiːən/; also spelled Eoarchaean) Era or erathem is the earliest time following the solidification of Earth’s crust. It follows the Hadean and precedes the Paleoarchean Era of the geologic timescale. The approximate abiotic origins of life (abiogenesis) have been dated to a time window from 4,000 to 3,600 million years ago when atmospheric pressure values ranged from ca. 100 to 10 bar.

Chronology

It was formerly officially unnamed and usually referred to as the first part of the Early Archean (now an obsolete name) together with the later Paleoarchean Era.

The International Commission on Stratigraphy now officially recognizes the Eoarchean Era as the first part of the Archaean Eon, preceded by the Hadean Eon, during which the Earth is believed to be essentially molten.

The International Commission on Stratigraphy currently does not recognize the lower boundary of the era which has been provisionally placed at 4,000 million years ago nor that of the preceding Hadean Eon.

The Eoarchean was followed by the Paleoarchean Era.

The name comes from two Greek words: eos (dawn) and archaios (ancient). The first supercontinent Vaalbara appeared around the end of this period around 3,600 million years ago.

Geology

A characteristic of the Eoarchean is that Earth possessed a firm crust for the first time. However, this crust may have been incomplete at many sites and areas of lava may have existed at the surface. The beginning of the Eoarchean is characterized by heavy asteroid bombardment within the inner solar system: the Late Heavy Bombardment. The Eoarchean is the first phase of our planet from which solid rock formations survived. The largest is the Isua Greenstone Belt at the south-west coast of Greenland. It appeared during the Eoarchean around 3.8 billion years ago. The Acasta Gneiss within the Canadian Shield have been dated to be 4,030 Ma and are therefore the oldest preserved rock formations. In 2008 another rock formation was discovered in the Nuvvuagittuq greenstone belt in northern Québec in Canada which has been dated to be 4,280 million years ago. These formations are presently under intense investigation.
Note : The above story is based on materials provided by Wikipedia

Related Articles