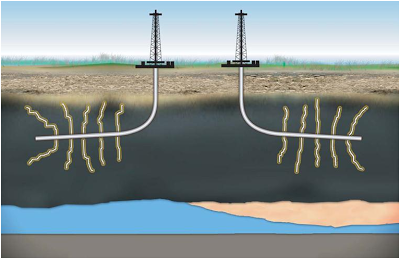
Since records began in 1776, the people of Youngstown, Ohio had never experienced an earthquake. However, from January 2011, 109 tremors were recorded and new research in Geophysical Research-Solid Earth reveals how this may be the result of shale fracking.
In December 2010, Northstar 1, a well built to pump wastewater produced by fracking in the neighboring state of Pennsylvania, came online. In the year that followed seismometers in and around Youngstown recorded 109 earthquakes; the strongest being a magnitude 3.9 earthquake on December 31, 2011.
The study authors analyzed the Youngstown earthquakes, finding that their onset, cessation, and even temporary dips in activity were all tied to the activity at the Northstar 1 well. The first earthquake recorded in the city occurred 13 days after pumping began, and the tremors ceased shortly after the Ohio Department of Natural Resources shut down the well in December 2011.
Dips in earthquake activity correlated with Memorial Day, the Fourth of July, Labor Day, and Thanksgiving, as well as other periods when the injection at the well was temporarily stopped.
“In recent years, waste fluid generated during the shale gas production – hydraulic fracturing, had been increasing steadily in United States. Earthquakes were triggered by these waste fluid injection at a deep well in Youngstown, Ohio during Jan. 2011 – Feb. 2012. We found that the onset of earthquakes and cessation were tied to the activity at the Northstar 1 deep injection well. The earthquakes were centered in subsurface faults near the injection well. These shocks were likely due to the increase in pressure from the deep waste water injection which caused the existing fault to slip,” said Dr. Won-Young Kim. “Throughout 2011, the earthquakes migrated from east to west down the length of the fault away from the well—indicative of the earthquakes being caused by expanding pressure front.”
Note : The above story is based on materials provided by Wiley Inc.
The formations in the Grand Canyon of the Yellowstone, in Yellowstone National Park, are an example of silica-rich volcanic rock. (Credit: Sarah Gelman/UW)
Reservoirs of silica-rich magma — the kind that causes the most explosive volcanic eruptions — can persist in Earth’s upper crust for hundreds of thousands of years without triggering an eruption, according to new University of Washington modeling research.
That means an area known to have experienced a massive volcanic eruption in the past, such as Yellowstone National Park, could have a large pool of magma festering beneath it and still not be close to going off as it did 600,000 years ago.
“You might expect to see a stewing magma chamber for a long period of time and it doesn’t necessarily mean an eruption is imminent,” said Sarah Gelman, a UW doctoral student in Earth and space sciences.
Recent research models have suggested that reservoirs of silica-rich magma, or molten rock, form on and survive for geologically short time scales — in the tens of thousands of years — in the Earth’s cold upper crust before they solidify. They also suggested that the magma had to be injected into the Earth’s crust at a high rate to reach a large enough volume and pressure to cause an eruption.
But Gelman and her collaborators took the models further, incorporating changes in the crystallization behavior of silica-rich magma in the upper crust and temperature-dependent heat conductivity. They found that the magma could accumulate more slowly and remain molten for a much longer period than the models previously suggested.
Gelman is the lead author of a paper explaining the research published in the July edition of Geology. Co-authors are Francisco Gutiérrez, a former UW doctoral student now with Universidad de Chile in Santiago, and Olivier Bachmann, a former UW faculty member now with the Swiss Federal Institute of Technology in Zurich.
There are two different kinds of magma and their relationship to one another is unclear. Plutonic magma freezes in the Earth’s crust and never erupts, but rather becomes a craggy granite formation like those commonly seen in Yosemite National Park. Volcanic magma is associated with eruptions, whether continuous “oozing” types of eruption such as Hawaii’s Kilauea Volcano or more explosive eruptions such as Mount Pinatubo in the Philippines or Mount St. Helens in Washington state.
Some scientists have suggested that plutonic formations are what remain in the crust after major eruptions eject volcanic material. Gelman believes it is possible that magma chambers in the Earth’s crust could consist of a core of partially molten material feeding volcanoes surrounded by more crystalline regions that ultimately turn into plutonic rock. It is also possible the two rock types develop independently, but those questions remain to be answered, she said.
The new work suggests that molten magma reservoirs in the crust can persist for far longer than some scientists believe. Silica content is a way of judging how the magma has been affected by being in the crust, Gelman said. As the magma is forced up a column from lower in the Earth to the crust, it begins to crystallize. Crystals start to drop out as the magma moves higher, leaving the remaining molten rock with higher silica content.
“These time scales are in the hundreds of thousands, even up to a million, years and these chambers can sit there for that long,” she said.
Even if the molten magma begins to solidify before it erupts, that is a long process, she added. As the magma cools, more crystals form giving the rock a kind of mushy consistency. It is still molten and capable of erupting, but it will behave differently than magma that is much hotter and has fewer crystals.
The implications are significant for volcanic “arcs,” found near subduction zones where one of Earth’s tectonic plates is diving beneath another. Arcs are found in various parts of the world, including the Andes Mountains of South America and the Cascades Range of the Pacific Northwest.
Scientists have developed techniques to detect magma pools beneath these arcs, but they cannot determine how long the reservoirs have been there. Because volcanic magma becomes more silica-rich with time, its explosive potential increases.
“If you see melt in an area, it’s important to know how long that melt has been around to determine whether there is eruptive potential or not,” Gelman said. “If you image it today, does that mean it could not have been there 300,000 years ago? Previous models have said it couldn’t have been. Our model says it could. That doesn’t mean it was there, but it could have been there.”
The work was funded by the National Science Foundation and the National Scientific and Technological Research Commission of Chile.
Note : The above story is based on materials provided by University of Washington.
Neanderthal handaxes. (Credit: Image courtesy of University of Southampton)
A study by a postgraduate researcher at the University of Southampton has found that Neanderthals were more culturally complex than previously acknowledged. Two cultural traditions existed among Neanderthals living in what is now northern Europe between 115,000 to 35,000 years ago.
Dr Karen Ruebens from the Centre for the Archaeology of Human Origins (CAHO) and funded by the Arts and Humanities Research Council (AHRC) examined the design of 1,300 stone tools originating from 80 Neanderthal sites in five European countries; France, Germany, Belgium, Britain and the Netherlands.
Dr Ruebens’ investigations uncovered new evidence that two separate handaxe traditions or designs existed — one in a region now spanning south-western France and Britain — the other in Germany and further to the East. In addition, she found an area covering modern day Belgium and the Netherlands that demonstrates a transition between the two.
She comments: “In Germany and France there appears to be two separate handaxe traditions, with clear boundaries, indicating completely separate, independent developments. “The transition zone in Belgium and Northern France indicates contact between the different groups of Neanderthals, which is generally difficult to identify but has been much talked about, especially in relation to later contacts with groups of modern humans. This area can be seen as a melting pot of ideas where mobile groups of Neanderthals, both from the eastern and western tradition, would pass by — influencing each other’s designs and leaving behind a more varied record of bifacial tools.”
The University of Southampton research has revealed Neanderthals in the western region made symmetrical, triangular and heart-shaped handaxes, while during the same time period, in the eastern region, they produced asymmetrically shaped bifacial knives.
Dr Ruebens says: “Distinct ways of making a handaxe were passed on from generation to generation and for long enough to become visible in the archaeological record. This indicates a strong mechanism of social learning within these two groups and says something about the stability and connectivity of the Neanderthal populations.
“Making stone tools was not merely an opportunistic task. A lot of time, effort and tradition were invested and these tools carry a certain amount of socio-cultural information, which does not contribute directly to their function.”
The study’s extensive analysis also shows other factors which could have influenced handaxe design, such as raw material availability to Neanderthals, the function of their sites, or the repeated reuse and sharpening of tools — didn’t have an impact in this instance.
Note : The above story is based on materials provided by University of Southampton.
Aboard the R/V Knorr, WHOI researchers Carl Lamborg, Tyler Goepfert, and Chad Hammerschmidt deploy a trace metal rosette on five kilometers of non-metallic line to gather samples of seawater from the depths of the South Atlantic Ocean. (Photo courtesy Emily Nahas, Univ. of Washington)
Scientists have discovered a vast plume of iron and other micronutrients more than 1,000 km long billowing from hydrothermal vents in the South Atlantic Ocean. The finding, soon to be published in the journal Nature Geoscience, calls past estimates of iron abundances into question, and may challenge researchers’ assumptions about iron sources in the world’s seas.
“This study and other studies like it are going to force the scientific community to reevaluate how much iron is really being contributed by hydrothermal vents and to increase those estimates, and that has implications for not only iron geochemistry but a number of other disciplines as well,” says Mak Saito, a WHOI associate scientist and lead author of the study.
Saito and his team of collaborators—which includes WHOI researchers and a colleague affiliated with the University of Liverpool (U.K.)—didn’t set out to find iron plumes in the South Atlantic. They set sail aboard the R/V Knorr in 2007 as part of the Cobalt, Iron and Micro-organisms from the Upwelling zone to the Gyre (or CoFeMUG, pronounced “coffee mug”) expedition, which intended to map chemical composition and microbial life along the ship’s route between Brazil and Namibia. As the scientists traveled the route, they sampled the seawater at frequent intervals and multiple depths along the way, and then stored the samples for in-depth analysis back on land.
Their route passed over the Mid-Atlantic Ridge, a band of mountains and valleys running along the Atlantic Ocean floor from the Arctic to the Antarctic where several of the Earth’s major tectonic plates are slowly spreading apart. Hydrothermal vents, or fissures in the Earth’s crust, are found along the ridge, but they haven’t been extensively studied because slow-spreading ridges are thought to be less active than fast-spreading ones. Past studies using helium, which is released from the Earth’s mantle through hydrothermal vents and is routinely used as an indicator of vent activity, have found little coming from mid-Atlantic vents, and researchers have assumed that means the vents spew little iron as well.
So Saito and his colleagues were surprised by what their samples revealed when later studied in the lab. Once filtered and analyzed, some of the seawater showed unexpectedly high levels of iron and manganese. When Abigail Noble, then a WHOI graduate student, and Saito plotted the sites where the iron-rich samples were taken, they realized the samples formed a distinct plume—a cloud of nutrients ranging in depth from 1,500 to 3,500 meters that spanned more than 1,000 km of the South Atlantic Ocean.
“We had never seen anything like it,” Saito says. “We were sort of shocked—there’s this huge bull’s-eye right in the middle of the South Atlantic Ocean. We didn’t quite know what to do with it, because it went contrary to a lot of our expectations.”
The plume’s ratio of iron to helium was 80-fold higher than ratios reported for faster-spreading ridges in the southeastern Pacific Ocean.
The serendipitous discovery casts doubt on the assumption that slow-spreading ridges are iron-poor, and it raises questions about the use of helium as an indicator for iron flux in hydrothermal vents, Saito says.
“We’ve assumed that low helium means low iron, and our study finds that that’s not true,” Saito says. “There’s actually quite a lot of iron coming out of these slow-spreading regions in the Atlantic, where people thought there would be little to none.”
And that has profound implications, because iron is a critical element for ocean life. Iron is known to spur the growth of phytoplankton in many marine habitats, especially those important in the ocean’s carbon cycle, which, in turn, impacts atmospheric carbon dioxide levels and Earth’s climate. Because more than half the world’s seafloor ridges are slow-spreading, the team’s discovery suggests there may be far more iron from these locations than previously estimated.
“We need to understand where iron is in the ocean and where it’s coming from to understand the role of iron in the marine carbon cycle with any confidence,” Saito says.
Saito and his colleagues hope future studies will reveal the exact shape and extent of the plume, and just how much of its iron and other micronutrients persist and rise to the surface. Answering these lingering questions will help researchers truly understand how hydrothermal vents affect the ocean as a whole, Saito says.
The research was supported by the U.S. NSF-Chemical Oceanography program and the Gordon and Betty Moore Foundation (grant GBMF2724).
The Woods Hole Oceanographic Institution is a private, non-profit organization on Cape Cod, Mass., dedicated to marine research, engineering, and higher education. Established in 1930 on a recommendation from the National Academy of Sciences, its primary mission is to understand the ocean and its interaction with the Earth as a whole, and to communicate a basic understanding of the ocean’s role in the changing global environment.
Note : The above story is based on materials provided by Woods Hole Oceanographic Institution
UM doctoral student Meierbachtol holds up the stem of the hot-water drill as the team prepares to drill a 2,700 feet-deep borehole.
MISSOULA – Findings from a large-scale ice drilling study on the Greenland ice sheet by a team of University of Montana and University of Wyoming researchers may revise the models used to predict how ice sheets move.
The work was published in Science on Aug. 15 in a paper titled “Basal Drainage System Response to Increasing Surface Melt on the Greenland Ice Sheet.”
The bed of the Greenland ice sheet, hidden beneath hundreds to thousands of meters of ice, is one of the most isolated locations on earth – making it difficult for scientists to understand just how the second largest ice body on the planet functions.Meierbachtol
Led by UM glaciologist Joel Harper and with backing from the National Science Foundation, the team of researchers set out to observe and record exactly how melt water flows along the bed of the ice sheet and how that water influences ice sheet acceleration.
“Our ability to predict and understand what’s going to happen in the future hinges on our ability to have an adequate understanding of the present processes and how those might influence future ice sheet behavior under climate changes,” said Toby Meierbachtol, the study’s lead author and a UM doctoral student.
The team employed a unique strategy for collecting widespread measurements of the conditions at the bottom of the ice sheet.
“Our approach was to be lightweight and nimble so that we could drill lots of boreholes all over the ice sheet.” Harper said.
Using a drill designed by Neil Humphrey, UW professor and co-author on the paper, the team melted 23 boreholes through the ice sheet to measure the pressure and flow conditions of the water under the ice. The drill was easily transported by helicopter and even could be carried short distances by six people.
The other component to their strategy was to carefully select a small and hard-working field team. The group comprised two professors, two doctoral students, two graduate students and two undergraduate students.
According to Harper, the team selection was of critical importance. He needed mentally tough team members who both excelled academically and also could withstand difficult conditions. “Our success relied on finding people who were equally comfortable fiddling with circuit boards or fixing a broken generator, and doing those things in the cold and with a relentless wind blowing,” he said.
Once the data was analyzed, the research team discovered that it didn’t match up with the working hypotheses for water flow beneath the ice sheet. This led the scientists to surmise that there are other critical processes at work that had been missing – one possibility being that as the ice sheet accelerates, the acceleration itself opens up space between the ice and bedrock and expands the drainage network.
“This process is largely neglected in current interpretations,” Meierbachtol said. “We need to pull ourselves away from the narrow vision and start to explore some of the other options for transient growth.”
Future warming likely will be enhanced over the Artic. This body of research will provide a more accurate assessment of the impacts of future warming on Greenland.
“Much climate research focuses on documenting recent and ongoing changes, or making projections about future change,” Harper said. “We can only go so far with that work before we hit stumbling blocks resulting from our incomplete understanding of how various components of the climate system work. Our research is focused on unraveling the fundamental physical processes controlling how ice sheets move when sitting on flowing melt water. This basic research is essential to increasing confidence in our understanding of climate and sea level change.”
Note : The above story is based on materials provided by The University of Montana
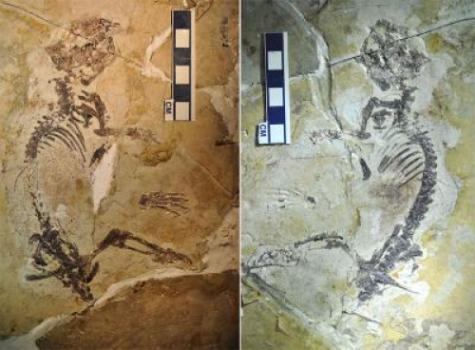
The fossil of Rugosodon eurasiaticus is preserved in two shale slabs in part (left) and counterpart (right). It is about 17 cm (6.5 inches) long from head to rump, and is estimated to have weighed 80 grams (about 2.8 ounces). The sediments at the site of discovery are lake sediments with embedded volcanic layers. The fossil assemblage of Rugosodon also includes feathered dinosaur Anchiornis and the pterosaur Darwinopterus. By the dental features, Rugosodon eurasiaticus closely resembles the teeth of some multituberculate mammals of the Late Jurassic of the Western Europe, suggesting that Europe and Asia had extensive mammal faunal inter-changes in the Jurassic. (Credit: [Photographed by Zhe-Xi Luo of University of Chicago and Chongxi Yuan of Chinese Academy of Geological Sciences])The 160 million-year-old fossil of an extinct rodent-like creature from China is helping to explain how multituberculates — the most evolutionarily successful and long-lived mammalian lineage in the fossil record — achieved their dominance.
This fossil find — the oldest ancestor in the multituberculate family tree — represents a newly discovered species known as Rugosodon eurasiaticus. The nearly complete skeleton provides critical insights into the traits that helped such multituberculates thrive in their day. For example, the fossil reveals teeth that were adapted to gnawing plants and animals alike, as well as ankle joints that were highly adept at rotation.
In light of these findings, researchers suggest that R. eurasiaticus paved the way for later plant-eating and tree-dwelling mammals.
Chong-Xi Yuan from the Chinese Academy of Geological Sciences in Beijing, China, along with Chinese and American colleagues, report their analysis of the fossil in the 16 August issue of Science.
The multituberculates flourished during the Cretaceous era, which ended over 60 million years ago. Much like today’s rodents, they filled an extremely wide variety of niches — below the ground, on the ground and in the trees — and this new fossil, which resembles a small rat or a chipmunk, possessed many of the adaptations that subsequent species came to rely upon, the researchers say.
“The later multituberculates of the Cretaceous [era] and the Paleocene [epoch] are extremely functionally diverse: Some could jump, some could burrow, others could climb trees and many more lived on the ground,” explained Zhe-Xi Luo, a co-author of the Science report. “The tree-climbing multituberculates and the jumping multituberculates had the most interesting ankle bones, capable of ‘hyper-back-rotation’ of the hind feet.”
“What is surprising about this discovery is that these ankle features were already present in Rugosodon — a land-dwelling mammal,” he said. (Such highly mobile ankle joints are normally associated with the foot functions of animals that are exclusively tree-dwellers — those that navigate uneven surfaces.)
Additionally, R. eurasiaticus could eat many different types of food, according to the researchers. The fossil — particularly its dentition, which reveals teeth designed for shearing plant matter — confirms a 2012 analysis of tooth types that suggested multituberculates consumed an animal-dominated diet for much of their existence, later diversifying to a plant-dominated one.
Multituberculates arose in the Jurassic period and went extinct in the Oligocene epoch, occupying a diverse range of habitats for more than 100 million years before they were out-competed by more modern rodents. By the end of their run on the planet, multituberculates had evolved complex teeth that allowed them to enjoy vegetarian diets and unique locomotive skills that enabled them to traverse treetops. Both adaptations helped them to become dominant among their contemporaries.
The fossilized R. eurasiaticus that Yuan and his team unearthed was preserved in lake sediments, suggesting that the creature may have lived on the shores. However, the researchers say that the ankle joints of this early multituberculate were already highly mobile and its teeth were already oriented for an omnivorous diet. Based on their findings, the researchers suggest that such adaptations must have arisen very early in the evolution of the order, setting the stage for the major diversification of rodent-like mammals that ensued.
The discovery of R. eurasiaticus also extends the distribution of certain multituberculates from Europe to Asia during the Late Jurassic period, the researchers say.
“This new fossil from eastern China is very similar to the Late Jurassic fossil teeth of multituberculates from Portugal in western Europe,” explained Dr. Luo. “This suggests that Rugosodon and its closely related multituberculates had a broad paleogreographic distribution and dispersals back-and-forth across the entire Eurasian continent.”
The report by Yuan et al. was supported by the Ministry of Land Resources and the Ministry of Science and technology of China; the Scientific Commission of Beijing; the Beijing Museum of Natural History; the National Science Foundation; Carnegie Museum; and the University of Chicago.
Note : The above story is based on materials provided by American Association for the Advancement of Science, via EurekAlert!, a service of AAAS.
Scanning electron microscope images showing localized shear surfaces in cross-section and oblique view. Sense of shear is top to the right Note striations on shear surface. Similar patterns appear with serpentine.Credit: Haines, S. H.; Kaproth, B.; Marone, C.; Saffer, D. and B. A. van der Pluijm
Monitoring slow earthquakes may provide a basis for reliable prediction in areas where slow quakes trigger normal earthquakes, according to Penn State geoscientists.
“We currently don’t have any way to remotely monitor when land faults are about to move,” said Chris Marone, professor of geophysics. “This has the potential to change the game for earthquake monitoring and prediction, because if it is right and you can make the right predictions, it could be big.”
Marone and Bryan Kaproth-Gerecht, recent Ph.D. graduate, looked at the mechanisms behind slow earthquakes and found that 60 seconds before slow stick slip began in their laboratory samples, a precursor signal appeared.
Normal stick slip earthquakes typically move at a rate of three to 33 feet per second, but slow earthquakes, while they still stick and slip for movement, move at rates of about 0.004 inches per second taking months or more to rupture. However, slow earthquakes often occur near traditional earthquake zones and may precipitate potentially devastating earthquakes.
“Understanding the physics of slow earthquakes and identifying possible precursory changes in fault zone properties are increasingly important goals,” the researchers report on line in today’s (Aug. 15) issue of Science Express.
Scanning electron microscope images of laboratory fault zone showing sense of shear (white arrows) and zones of localized shear. Slow stick-slip is thought to originate when failure begins on one of these surfaces, but is partially arrested as slip velocity increases and the friction behavior changes from potentially unstable, velocity weakening frictional behavior to stable, velocity strengthening frictional behavior.Credit: Haines, S. H.; Kaproth, B.; Marone, C.; Saffer, D. and B. A. van der Pluijm
Using serpentine, a common mineral often found in slow earthquake areas, Marone and Kaproth-Gerecht”We recognize that this is complicated and that velocity depends on the friction,” said Marone. “We don’t know for sure what is happening, but, from our lab experiments, we know that this phenomenon is occurring.”
The researchers think that what makes this unusual pattern of movement is that friction contact strength goes down as velocity goes up, but only for a small velocity range. Once the speed increases enough, the friction contact area becomes saturated. It can’t get any smaller and other physical properties take over, such as thermal effects. This mechanism limits the speed of slow earthquakes. Marone and Kaproth-Gerecht also looked at the primary elastic waves and the secondary shear waves produced by their experiments.
“Here we see elastic waves moving and we know what’s going on with P and S waves and the acoustic speed,” said Marone. “This is important because this is what you can see in the field, what seismographs record.”
Marone notes that there are not currently sufficient measuring devices adjacent to known fault lines to make any type of prediction from the precursor signature of the movement of the elastic waves. It is, however, conceivable that with the proper instrumentation, a better picture of what happens before a fault moves in slip stick motion is possible and perhaps could lead to some type of prediction.
performed laboratory experiments applying shear stress to rock samples so that the samples exhibited slow stick slip movement. The researchers repeated experiments 50 or more times and found that, at least in the laboratory, slow fault zones undergo a transition from a state that supports slow velocity below about 0.0004 inches per second to one that essentially stops movement above that speed.
Note : The above story is based on materials provided by The Pennsylvania State University
A West Antarctica Ice Sheet Divide project researcher stands in a snow pit next to an ice core with data from 68,000 years ago. The prominent line across the middle of the ice separates one year’s ice and snow accumulation from the next year’s. (Credit: Kendrick Taylor/Desert Research Institute)
For more than a century scientists have known that Earth’s ice ages are caused by the wobbling of the planet’s orbit, which changes its orientation to the sun and affects the amount of sunlight reaching higher latitudes, particularly the polar regions.
The Northern Hemisphere’s last ice age ended about 20,000 years ago, and most evidence has indicated that the ice age in the Southern Hemisphere ended about 2,000 years later, suggesting that the south was responding to warming in the north.
But new research published online Aug. 14 in Nature shows that Antarctic warming began at least two, and perhaps four, millennia earlier than previously thought.
Most previous evidence for Antarctic climate change has come from ice cores drilled in East Antarctica, the highest and coldest part of the continent. However, a U.S.-led research team studying a new ice core from West Antarctica found that warming there was well under way 20,000 years ago.
“Sometimes we think of Antarctica as this passive continent waiting for other things to act on it. But here it is showing changes before it ‘knows’ what the north is doing,” said T.J. Fudge, a University of Washington doctoral student in Earth and space sciences and lead corresponding author of the Nature paper.
Co-authors are 41 other members of the West Antarctic Ice Sheet Divide project, which is primarily funded by the National Science Foundation.
The findings come from a detailed examination of an ice core taken from the West Antarctic Ice Sheet Divide, an area where there is little horizontal flow of the ice so the data are known to be from a location that remained consistent over long periods.
The ice core is more than 2 miles deep and covers 68,000 years, though so far data have been analyzed only from layers going back 30,000 years. Near the surface, 1 meter of ice covers one year, but at greater depths the annual layers are compressed to centimeters.
Fudge identified the annual layers by running two electrodes along the ice core to measure higher electrical conductivity associated with each summer season. Evidence of greater warming turned up in layers associated with 18,000 to 22,000 years ago, the beginning of the last deglaciation.
“This deglaciation is the last big climate change that that we’re able to go back and investigate,” he said. “It teaches us about how our climate system works.”
West Antarctica is separated from East Antarctica by a major mountain range. East Antarctica has a substantially higher elevation and tends to be much colder, though there is recent evidence that it too is warming.
Rapid warming in West Antarctica in recent decades has been documented in previous research by Eric Steig, a UW professor of Earth and space sciences who serves on Fudge’s doctoral committee and whose laboratory produced the oxygen isotope data used in the Nature paper. The new data confirm that West Antarctica’s climate is more strongly influenced by regional conditions in the Southern Ocean than East Antarctica is.
“It’s not surprising that West Antarctica is showing something different from East Antarctica on long time scales, but we didn’t have evidence for that before,” Fudge said.
He noted that the warming in West Antarctica 20,000 years ago is not explained by a change in the sun’s intensity. Instead, how the sun’s energy was distributed over the region was a much bigger factor. It not only warmed the ice sheet but also warmed the Southern Ocean that surrounds Antarctica, particularly during summer months when more sea ice melting could take place.
Changes in Earth’s orbit today are not an important factor in the rapid warming that has been observed recently, he added.
“Earth’s orbit changes on the scale of thousands of years, but carbon dioxide today is changing on the scale of decades so climate change is happening much faster today,” Fudge said.
Note : The above story is based on materials provided by University of Washington. The original article was written by Vince Stricherz.
Smoke and gases billow from Japan’s snowcapped Mount Asama volcano early today. Powdery volcanic ash from the eruption rained down on parts of Tokyo, about 90 miles (145 kilometers) from the volcano. Photograph from Kyodo via AP Images
Study in the Journal Physics of Fluids will help scientists understand and predict paths of debris and destruction from natural and manmade disasters
WASHINGTON D.C. August 12, 2013 — Some time around 37,000 BCE a massive volcano erupted in the Campanian region of Italy, blanketing much of Europe with ash, stunting plant growth and possibly dooming the Neanderthals. While our prehistoric relatives had no way to know the ash cloud was coming, a recent study provides a new tool that may have predicted what path volcanic debris would take.
“This paper provides a model for the pattern of the ash cloud if the wind is blowing past an eruption of a given size,” said Peter Baines, a scientist at the University of Melbourne in Australia who did the study. He published his work in the journal Physics of Fluids.
Volcanic eruptions are an example of what Baines calls an “intrusion.” Other examples include exhaust rising from a chimney, sewage flowing into the ocean, and the oil spilling underwater in the 2010 Deepwater Horizon disaster. In all these events, a fluid rises into a density-stratified environment like the atmosphere or the ocean. As the fluid rises, it is pushed by winds or currents, and this crossflow can cause the intruding fluid to disperse far from its origin.
Scientists have previously modeled intrusions into a completely calm environment, but before Baines nobody had ever attempted to introduce the effect of crosswinds, a necessary step toward making such models more realistic and useful.
Predicting Ash and Oil Flows
Baines thinks his work could be used to estimate how much ash is pouring out of a volcano, or how fast oil is gushing from a hole in the sea floor.
Baines is now working with volcanologists in Britain to apply his model to historic eruptions like the Campanian event and the catastrophic Toba supereruption that occurred around 73,000 years ago in Indonesia. The scientists are hoping to use ash deposits from these volcanoes to develop a sharper picture of the amount and speed of the ejected material.
“Most of what we know about prehistoric eruptions is from sedimentary records,” said Baines. “You then have to try to infer what the nature of the eruption was, when this is the only information you’ve got.”
Baines said his model can also help forecast the deposition patterns of future eruptions. And that should give us a big leg up on the poor Neanderthals.
How the Model Works
To understand how intrusions work in the presence of crossflows, Baines developed what he calls a semi-analytical model. He began with fluid dynamics equations, and then used numerical calculations to arrive at approximate solutions for specifics combinations of source flow and spread rates, and crosswind speed. He found that, under normal wind speeds, the intruding fluid reached a maximum thickness at a certain distance upstream from the source, and thinned in the downstream direction. The distance to the upstream stagnation point depended much more on the rate of source flow than the crossflow speed.
Note : The above story is based on materials provided by American Institute of Physics (AIP)
Modeled basal ice temperatures of the present-day Greenland Ice Shield across the Summit region, GRIP and GISP2 indicate borehole locations. (Credit: Image courtesy of Helmholtz Centre Potsdam – GFZ German Research Centre for Geosciences)
The Greenland ice sheet is melting from below, caused by a high heat flow from the mantle into the lithosphere. This influence is very variable spatially and has its origin in an exceptionally thin lithosphere. Consequently, there is an increased heat flow from the mantle and a complex interplay between this geothermal heating and the Greenland ice sheet.
The international research initiative IceGeoHeat led by the GFZ German Research Centre for Geosciences establishes in the current online issue of Nature Geoscience that this effect cannot be neglected when modeling the ice sheet as part of a climate study.
The continental ice sheets play a central role in climate. Interactions and feedback processes between ice and temperature rise are complex and still a current research topic. The Greenland ice sheet loses about 227 gigatonnes of ice per year and contributes about 0.7 millimeters to the currently observed mean sea level change of about 3 mm per year.
Existing model calculations, however, were based on a consideration of the ice cap and considered the effect of the lithosphere, i.e. Earth’s crust and upper mantle, too simplistic and primarily mechanical: the ice presses the crust down due to its weight. GFZ scientists Alexey Petrunin and Irina Rogozhina have now coupled an ice/climate model with a thermo-mechanical model for the Greenland lithosphere.
“We have run the model over a simulated period of three million years, and taken into account measurements from ice cores and independent magnetic and seismic data,” says Petrunin. “Our model calculations are in good agreement with the measurements. Both the thickness of the ice sheet as well as the temperature at its base are depicted very accurately. ”
The model can even explain the difference in temperature measured at two adjacent drill holes: the thickness of the Greenland lithosphere and thus the geothermal heat flow varies greatly in narrow confines.
What does this mean for climate modeling? “The temperature at the base of the ice, and therefore the current dynamics of the Greenland ice sheet is the result of the interaction between the heat flow from Earth’s interior and the temperature changes associated with glacial cycles,” explains corresponding author Irina Rogozhina (GFZ) who initiated IceGeoHeat. “We found areas where the ice melts at the base next to other areas where the base is extremely cold.”
The current climate is influenced by processes that go far back into the history of Earth: the Greenland lithosphere is 2.8 to 1.7 billion years old and is only about 70 to 80 kilometers thick under Central Greenland. It remains to be explored why it is so exceptionally thin. It turns out, however, that the coupling of models of ice dynamics with thermo-mechanical models of the solid earth allows a more accurate view of the processes that are melting the Greenland ice.
Note : The above story is based on materials provided by Helmholtz Centre Potsdam – GFZ German Research Centre for Geosciences.
The Mississippi River is the chief river of the largest drainage system in North America. Flowing entirely in the United States (though its drainage basin reaches into Canada), it rises in northern Minnesota and meanders slowly southwards for 2,530 miles (4,070 km) to the Mississippi River Delta at the Gulf of Mexico. With its many tributaries, the Mississippi’s watershed drains all or parts of 31 US states and 2 Canadian provinces between the Rocky and Appalachian Mountains. The Mississippi ranks as the fourth longest and tenth largest river in the world. The river either borders or cuts through the states of Minnesota, Wisconsin, Iowa, Illinois, Missouri, Kentucky, Tennessee, Arkansas, Mississippi, and Louisiana.
Native Americans long lived along the Mississippi and its tributaries. Most were hunter-gatherers or herders, but some, such as the Mound builders, formed prolific agricultural societies. The arrival of Europeans in the 1500s changed the native way of life as first explorers, then settlers, ventured into the basin in increasing numbers. The river served first as barrier – forming borders for New Spain, New France, and the early United States – then as vital transportation artery and communications link. In the 19th century, during the height of Manifest Destiny, the Mississippi and several western tributaries, most notably the Missouri, formed pathways for the western expansion of the United States.
Formed from thick layers of this river’s silt deposits, the Mississippi River Valley is one of the most fertile agricultural regions of the country, which resulted in the river’s storied steamboat era. During the American Civil War, the Mississippi’s capture by Union forces marked a turning point towards victory because of the river’s importance as a route of trade and travel, not least to the Confederacy. Because of substantial growth of cities and the larger ships and barges that supplanted riverboats, the decades following the 1900s saw the construction of massive engineering works such as levees, locks and dams, often built in combination.
Since modern development of the basin began, the Mississippi has also seen its share of pollution and environmental problems – most notably large volumes of agricultural runoff, which has led to the Gulf of Mexico dead zone off the Delta. In recent years, the river has shown a steady shift towards the Atchafalaya River channel in the Delta; a course change would prove disastrous to seaports such as New Orleans. A system of dikes and gates has, so far, held the Mississippi at bay but, due to fluvial processes, the shift becomes more likely each year.
Name
The word Mississippi itself comes from Messipi, the French rendering of the Anishinaabe (Ojibwe or Algonquin) name for the river, Misi-ziibi (Great River). See below in “History” section for additional information.
In addition to historical traditions shown by names, there are at least two other measures of a river’s identity, one being the largest branch (by water volume), and the other being the longest branch. Using the largest-branch criterion, the Ohio (not the Middle and Upper Mississippi) would be the main branch of the Lower Mississippi. Using the longest-branch criterion, the Middle Mississippi-Missouri-Jefferson-Beaverhead-Red Rock-Hellroaring Creek River would be the main branch. According to either school of thought, the Upper Mississippi from Lake Itasca, Minnesota to St. Louis, despite its name, would only be a secondary tributary of the final river flowing from Cairo to the Gulf of Mexico.
While the Missouri River, flowing from the confluence of the Jefferson, Madison and Gallatin Rivers to the Mississippi, is the longest continuously named river in the United States,[4] the serially named river known sequentially as Hellroaring Creek, Red Rock, Beaverhead, Jefferson, Missouri, Middle Mississippi, and Lower Mississippi, as one continuous waterway, is the longest river in North America and the third or fourth longest river in the world. Its length of at least 3,745 mi (6,027 km) is exceeded only by the Nile, the Amazon,[6] and perhaps the Yangtze River[7] among the longest rivers in the world. The source of this waterway is at Brower’s Spring, 8,800 feet (2,700 m) above sea level in southwestern Montana, along the Continental Divide outside Yellowstone National Park.
The Mississippi River is widely considered a convenient if approximate dividing line between the Eastern, Southern, and Midwestern United States and the Western U.S., as exemplified by the Gateway Arch in St. Louis and the phrase “Trans-Mississippi”, used for example in the name of the 1898 Trans-Mississippi Exposition held in Omaha, Nebraska.
Physical geography
The geographical setting of the Mississippi River includes considerations of the course of the river itself, its watershed, its outflow, its prehistoric and historic course changes, and possibilities of future course changes. The New Madrid Seismic Zone along the river is also noteworthy. These various basic geographical aspects of the river in turn underlie its human history and present uses of the waterway and its adjacent lands.
Divisions
Upper Mississippi
The Upper Mississippi runs from its headwaters to its confluence with the Missouri River at St. Louis, Missouri. The Upper Mississippi is divided into two sections:
The headwaters, 493 miles (793 km), from the source to Saint Anthony Falls in Minneapolis, Minnesota; and
A navigable channel, formed by a series of man-made lakes between Minneapolis and St. Louis, Missouri, some 664 miles (1,069 km).
The source of the Upper Mississippi branch is traditionally accepted as Lake Itasca, 1,475 feet (450 m) above sea level in Itasca State Park in Clearwater County, Minnesota. The name “Itasca” is a combination of the last four letters of the Latin word for truth (veritas) and the first two letters of the Latin word for head (caput). However, the lake is in turn fed by a number of smaller streams.
From its origin at Lake Itasca to St. Louis, Missouri, the waterway’s flow is moderated by 43 dams. Fourteen of these dams are located above Minneapolis in the headwaters region and serve multiple purposes, including power generation and recreation. The remaining 29 dams, beginning in downtown Minneapolis, all contain locks and were constructed to improve commercial navigation of the upper river. Taken as a whole these 43 dams significantly shape the geography and influence the ecology of the upper river. Beginning just below Saint Paul, Minnesota, and continuing throughout the upper and lower river, the Mississippi is further controlled by thousands of wing dikes that moderate the river’s flow in order to maintain an open navigation channel and prevent the river from eroding its banks.
The head of navigation on the Mississippi is the Coon Rapids Dam in Coon Rapids, Minnesota. Before its construction in 1913, steamboats could occasionally go upstream as far as Saint Cloud, Minnesota, depending on river conditions.
The uppermost lock and dam on the Upper Mississippi River is the Upper St. Anthony Falls Lock and Dam in Minneapolis. Above the dam, the river’s elevation is 799 feet (244 m). Below the dam, the river’s elevation is 750 feet (230 m). This 49-foot (15 m) drop is the largest of all the Mississippi River locks and dams. The origin of the dramatic drop is a waterfall preserved adjacent to the lock under an apron of concrete. Saint Anthony Falls is the only true waterfall on the entire Mississippi River. The water elevation continues to drop steeply as it passes through the gorge carved by the waterfall.
The Upper Mississippi features various natural and artificial lakes, with its widest point being Lake Winnibigoshish, near Grand Rapids, Minnesota, over 7 miles (11 km) across. Also of note is Lake Onalaska (created by Lock and Dam No. 7), near La Crosse, Wisconsin, over 4 miles (6.4 km) wide. On the other hand, Lake Pepin is natural, formed due to the delta formed by the Chippewa River of Wisconsin as it enters the Upper Mississippi; it is more than 2 miles (3.2 km) wide.
By the time the Upper Mississippi reaches Saint Paul, Minnesota, below Lock and Dam No. 1, it has dropped more than half its original elevation and is 687 feet (209 m) above sea level. From St. Paul to St. Louis, Missouri, the river elevation falls much more slowly, and is controlled and managed as a series of pools created by 26 locks and dams.
The Upper Mississippi River is joined by the Minnesota River at Fort Snelling in the Twin Cities; the St. Croix River near Prescott, Wisconsin; the Cannon River near Red Wing, Minnesota; the Zumbro River at Wabasha, Minnesota; the Black, La Crosse, and Root rivers in La Crosse, Wisconsin; the Wisconsin River at Prairie du Chien, Wisconsin; the Rock River at the Quad Cities; the Iowa River near Wapello, Iowa; the Skunk River south of Burlington, Iowa; and the Des Moines River at Keokuk, Iowa. Other major tributaries of the Upper Mississippi include the Crow River in Minnesota, the Chippewa River in Wisconsin, the Maquoketa River and the Wapsipinicon River in Iowa, and the Big Muddy River and Illinois River.
The Upper Mississippi is largely a multi-thread stream with many bars and islands. From its confluence with the St. Croix River downstream to Dubuque, Iowa, the river is entrenched, with high bedrock bluffs lying on either side. The height of these bluffs decreases to the south of Dubuque, though they are still significant through Savanna, Illinois. This topography contrasts strongly with the Lower Mississippi, which is a meandering river in a broad, flat area, only rarely flowing alongside a bluff (as at Vicksburg, Mississippi).
Middle Mississippi
The confluence of the Mississippi and Ohio rivers at Cairo, Illinois, the demarcation between the Middle and the Lower Mississippi River
The Mississippi River is known as the Middle Mississippi from the Upper Mississippi River’s confluence with the Missouri River at St. Louis, Missouri, for 190 miles (310 km) to its confluence with the Ohio River at Cairo, Illinois.
The Middle Mississippi is a relatively free-flowing river. From St. Louis to the Ohio River confluence, the Middle Mississippi falls a total of 220 feet (67 m) over a distance of 180 miles (290 km) for an average rate of 1.2 feet per mile (23 cm/km). At its confluence with the Ohio River, the Middle Mississippi is 315 feet (96 m) above sea level. Apart from the Missouri River and Meramec River which originates in central Missouri, along with the Kaskaskia River in Illinois, no major tributaries enter the Middle Mississippi River.
Lower Mississippi
Lower Mississippi River near the city New Orleans
The Mississippi River is called the Lower Mississippi River from its confluence with the Ohio River to its mouth at the Gulf of Mexico. Measured by water volume, the Lower Mississippi’s primary branch is the Ohio River. At the confluence of the Ohio and the Middle Mississippi, the Ohio is the bigger river, with its long-term mean discharge at Cairo, Illinois being 281,500 cu ft/s (7,970 m3/s), while the long-term mean discharge of the Mississippi at Thebes, Illinois (just upriver from Cairo) is 208,200 cu ft/s (5,900 m3/s). Thus, by volume, the main branch of the Mississippi River system at Cairo can be considered to be the Ohio River (and the Allegheny River further upstream), rather than the Middle Mississippi.
In addition to the Ohio River, the major tributaries of the Lower Mississippi River are the White River, flowing in at the White River National Wildlife Refuge in east central Arkansas; the Arkansas River, joining the Mississippi at Arkansas Post; the Big Black River in Mississippi; the Yazoo River, meeting the Mississippi at Vicksburg, Mississippi; and the Red River in Louisiana. The widest point of the Mississippi River is in the Lower Mississippi portion where it exceeds 1 mile (1.6 km) in width in several places.
Deliberate water diversion at the Old River Control Structure in Louisiana allows the Atchafalaya River in Louisiana to be a major distributary of the Mississippi River, with 30% of the Mississippi flowing to the Gulf of Mexico by this route, rather than continuing down the Mississippi’s current channel past Baton Rouge and New Orleans on a longer route to the Gulf.
Watershed
Mississippi watershed (2005)
The Mississippi River has the world’s fourth largest drainage basin (“watershed” or “catchment”). The basin covers more than 1,245,000 sq mi (3,220,000 km2), including all or parts of 32 U.S. states and two Canadian provinces. The drainage basin empties into the Gulf of Mexico, part of the Atlantic Ocean. The total catchment of the Mississippi River covers nearly 40% of the landmass of the continental United States.
In the United States, the Mississippi River drains the majority of the area between crest of the Rocky Mountains and the crest of the Appalachian Mountains, except for various regions drained to Hudson Bay by the Red River of the North; to the Atlantic Ocean by the Great Lakes and the Saint Lawrence River; and to the Gulf of Mexico by the Rio Grande, the Alabama and Tombigbee rivers, the Chattahoochee and Appalachicola rivers, and various smaller coastal waterways along the Gulf.
The Mississippi River empties into the Gulf of Mexico about 100 miles (160 km) downstream from New Orleans. Measurements of the length of the Mississippi from Lake Itasca to the Gulf of Mexico vary somewhat, but the United States Geological Survey’s number is 2,340 miles (3,770 km). The retention time from Lake Itasca to the Gulf is typically about 90 days.
Outflow
Sequence of NASA MODIS images showing the outflow of fresh water from the Mississippi (arrows) into the Gulf of Mexico (2004)
The Mississippi River discharges at an annual average rate of between 200 and 700 thousand cubic feet per second (7,000–20,000 m3/s). Although it is the 5th largest river in the world by volume, this flow is a mere fraction of the output of the Amazon, which moves nearly 7 million cubic feet per second (200,000 m3/s) during wet seasons. On average, the Mississippi has only 8% the flow of the Amazon River.
Fresh river water flowing from the Mississippi into the Gulf of Mexico does not mix into the salt water immediately. The images from NASA’s MODIS (to the right) show a large plume of fresh water, which appears as a dark ribbon against the lighter-blue surrounding waters. These images demonstrate that the plume did not mix with the surrounding sea water immediately. Instead, it stayed intact as it flowed through the Gulf of Mexico, into the Straits of Florida, and entered the Gulf Stream. The Mississippi River water rounded the tip of Florida and traveled up the southeast coast to the latitude of Georgia before finally mixing in so thoroughly with the ocean that it could no longer be detected by MODIS.
Prior to 1900, the Mississippi River transported an estimated 400 million metric tons of sediment per year from the interior of the United States to coastal Louisiana and the Gulf of Mexico. During the last two decades, this number was only 145 million metric tons per year. The reduction in sediment transported down the Mississippi River is the result of engineering modification of the Mississippi, Missouri, and Ohio rivers and their tributaries by dams, meander cutoffs, river-training structures, and bank revetments and soil erosion control programs in the areas drained by them.
Course changes
Over geologic time, the Mississippi River has experienced numerous large and small changes to its main course, as well as additions, deletions, and other changes among its numerous tributaries, and the lower Mississippi River has used different pathways as its main channel to the Gulf of Mexico across the delta region.
Through a natural process known as avulsion or delta switching, the lower Mississippi River has shifted its final course to the mouth of the Gulf of Mexico every thousand years or so. This occurs because the deposits of silt and sediment begin to clog its channel, raising the river’s level and causing it to eventually find a steeper, more direct route to the Gulf of Mexico. The abandoned distributaries diminish in volume and form what are known as bayous. This process has, over the past 5,000 years, caused the coastline of south Louisiana to advance toward the Gulf from 15 to 50 miles (25–80 km). The currently active delta lobe is called the Birdfoot Delta, after its shape, or the Balize Delta, after La Balize, Louisiana, the first French settlement at the mouth of the Mississippi.
Prehistoric courses
The current form of the Mississippi River basin was largely shaped by the Laurentide Ice Sheet of the most recent Ice Age. The southernmost extent of this enormous glaciation extended well into the present-day United States and Mississippi basin. When the ice sheet began to recede, hundreds of feet of rich sediment were deposited, creating the flat and fertile landscape of the Mississippi Valley. During the melt, giant glacial rivers found drainage paths into the Mississippi watershed, creating such features as the Minnesota River, James River, and Milk River valleys. When the ice sheet completely retreated, many of these “temporary” rivers found paths to Hudson Bay or the Arctic Ocean, leaving the Mississippi Basin with many features “oversized” for the existing rivers to have carved in the same time period.
Ice sheets during the Illinoian Stage about 300,000 to 132,000 years before present, blocked the Mississippi near Rock Island, Illinois, diverting it to its present channel farther to the west, the current western border of Illinois. The Hennepin Canal roughly follows the ancient channel of the Mississippi downstream from Rock Island to Hennepin, Illinois. South of Hennepin, to Alton, Illinois, the current Illinois River follows the ancient channel used by the Mississippi River before the Illinoian Stage.
New Madrid Seismic Zone
The New Madrid Seismic Zone, along the Mississippi River near New Madrid, Missouri, between Memphis and St. Louis, is related to an aulacogen (failed rift) that formed at the same time as the Gulf of Mexico. This area is still quite active seismically. Four great earthquakes in 1811 and 1812, estimated at approximately 8 on the Richter magnitude scale, had tremendous local effects in the then sparsely settled area, and were felt in many other places in the midwestern and eastern U.S. These earthquakes created Reelfoot Lake in Tennessee from the altered landscape near the river, and temporarily reversed the direction of flow of the Mississippi itself.
Note : The above story is based on materials provided by Wikipedia
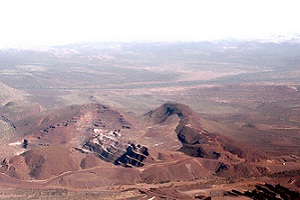
Professor McInnes says mining these iron formations, which supply 40 per cent of the country’s iron ore, is a cornerstone of the Australian economy. Credit: Iron ore mine in Paraburdoo, Pilbara, Stefan Jurgensen
Scientists at Curtin University have chronicled the genesis of a particular type of iron deposit in the state’s north, finding that the valuable mineral formed relatively late in Western Australia’s evolution.
The researchers, along with the CSIRO, examined channel iron deposits (CID) taken from the Hamersley Province in the Pilbara to clarify the long running debate over how the deposits were created.
They used the dating technique (U–Th)/He in combination with other analytical methods to date the CID mineral, which is an iron-rich fluvial deposit formed in ancient river channels that is found almost exclusively in Western Australia.
John de Laeter Centre for Isotope Research director Brent McInnes says they wanted to determine when and how channel iron deposits (CID) formed during the geological evolution of Western Australia.
Professor McInnes says mining these iron formations, which supply 40 per cent of the country’s iron ore, is a cornerstone of the Australian economy and makes up approximately 20 per cent of national exports.
The team applied the dating technique to two CID samples which were taken from diamond drill cores and provided to the CSIRO by Robe River Mining from its Mesa J project.
“CID deposits are geologically ‘young’ deposits that formed continuously from about 26 million years ago to as recent as two million years ago,” Prof McInnes says.
“Considering that the bulk of Australia’s mines are located in rocks nearly 1,000 times older, the fact that Australia’s economy depends on a relatively recent geological episode is interesting.”
Tests revealed that environmental conditions conducive to CID formation existed during the Miocene period (23-5.3 million years ago) and that a typical Robe River CID sequence took roughly 4-8 million years to accumulate.
“Another interesting finding is that the Pilbara was much wetter 20 million years [ago], and supported substantive tree-lined, slow-moving water courses and drainage networks,” Prof McInnes says.
“The iron-rich sediments accumulated at the bottom of these ancient river channels over tens of millions of years, indicating that the drainage networks were long-lived.”
Curtin researcher and study co-author Associate Professor Noreen Evans developed the U-Th/He dating technique which measured minute levels of uranium and thorium and which together experiences radioactive decay at a constant rate and produces helium as a by-product.
The scientists then measured concentrations of each element in iron-rich minerals in the iron formations using sensitive mass spectrometry techniques and from that analysis they calculated the time it took for the helium to accumulate via radioactive decay.
They will now apply the technique to try and understand the weathering history of Australia by examining iron-oxide minerals in oxidised lateritic assemblages.
Note : The above story is based on materials provided by Science Network WA
Landmark locations. The locations of the 3D landmarks are presented here in (A) dorsal and (B) lateral views on ZMNH M8137. Since the landmarks were not reflected on either side of the skull, the left lateral landmarks have different landmark numbers than the right lateral landmarks. A 3D model of the skull of ZMNH M8137 is included in Multimedia S1 for reference. Scale = 50 mm. (Credit: Brandon P. Hedrick, Peter Dodson. Lujiatun Psittacosaurids: Understanding Individual and Taphonomic Variation Using 3D Geometric Morphometrics. PLoS ONE, 2013; 8 (8): e69265 DOI: 10.1371/journal.pone.0069265)
A new analysis of dinosaur fossils by University of Pennsylvania researchers has revealed that a number of specimens of the genus Psittacosaurus — once believed to represent three different species — are all members of a single species. The differences among the fossil remains that led other scientists to label them as separate species in fact arose from how the animals were buried and compressed, the study found.
“Because of the vagaries of fossilization, no two fossils are the same,” said senior author Peter Dodson, professor of anatomy in Penn’s School of Veterinary Medicine and professor of paleontology in the School of Arts and Sciences’ Department of Earth and Environmental Science. “Animals are alive and they die, but what’s crucial in paleontology is what happens to the animals after they die.”
The research involved a cutting-edge technique, known as three-dimensional geometric morphometrics, which uses lasers to generate data about the shape of different specimens. This is the first time the approach has been used to study dinosaur fossils and could lead to a re-examination of the taxonomic classifications of additional dinosaur species as well as other long-extinct fossil organisms.
Brandon Hedrick, a doctoral student in the Department of Earth and Environmental Science, led the study in collaboration with Dodson. Their research will be reported in the journal PLOS ONE.
The investigation focused on dinosaurs in the genus Psittacosaurus, a word that comes from the Greek for “parrot lizard.” The group was named for the animal’s beaked face, not unlike that of a turtle. Originally discovered in 1923, 15 species have been classified as Psittacosaurus, though a recent analysis confirmed only nine of these as definite members of the genus. These animals were small plant-eaters that lived 120 to 125 million years ago. Paleontologists have discovered Psittacosaurus fossils in Mongolia, China and Russia and possibly in Thailand.
“Meat-eaters are sexy; plant-eaters are not,” Dodson said. “This isn’t a flashy dinosaur. But it has an interesting feature in that it’s one of the most abundant dinosaurs known to science.”
Indeed, many hundreds of Psittacosaurus specimens have been found. This abundance made the genus ideal for Hedrick and Dodson’s comparative study, as it is easier to determine relationships within and between species when there are more individuals to compare.
“For example, if you have a single dachshund and a single beagle, they may appear to be different species until you found 40 dachshund-beagle mixes of various grades to examine,” Hedrick said.
The scientists examined Psittacosaurus skulls discovered in the fossilized ashes of the Lujiatun beds of northeastern China’s Yixian Formation. Paleontologists had previously identified the skulls as belonging to three different species, Psittacosaurus lujiatunensis, P. major or Hongshanosaurus houi.
To compare and contrast the specimens, the researchers used two techniques. First they conducted a traditional study in which they examined every skull that had been classified as one of those three species — a total of 74 specimens — for a variety of characteristics that had been used in prior studies to distinguish the species. The Penn team also compared these fossils to skulls that had been classified as belonging to eight other Psittacosaurus species.
Next they completed a more high-tech analysis of 30 skulls from the three named species. Using a hand-held stylus that captures a point in space relative to a transmitter, they pinpointed 56 “landmarks,” or particular anatomical locations, on each fossil and compared the relative position of those marks between specimens. They also used a hand-held, laser-emitting scanner to make a three-dimensional image of each specimen, similar to a CT scan, from which they also collected landmark data.
Based on the “old-fashioned” method of examining the physical skulls, the researchers concluded that the three purported species were in fact one. They propose that all three can be considered members of the species P. lujiatunensis.
Results from the geometric morphometric analysis, though not sufficient on its own to classify species, supported this conclusion and suggested that how an animal’s body was crushed as it fossilized — from the top, from the side or twisted — could lead to inaccurate species determinations.
“Our study found all of these false ‘species’ that are not biological species but are apparent species caused by the process of fossilization,” Dodson said.
The Penn team said their investigation shows the value of traditional taxonomic analysis, while also revealing the potential of a new approach to analyzing fossils.
“Hopefully this will open up the paleontological community to using three-dimensional geometrics morphometrics in a variety of ways,” Hedrick said. “This technique has limitless applications to understanding dinosaurs.”
Note : The above story is based on materials provided by University of Pennsylvania, via EurekAlert!, a service of AAAS.
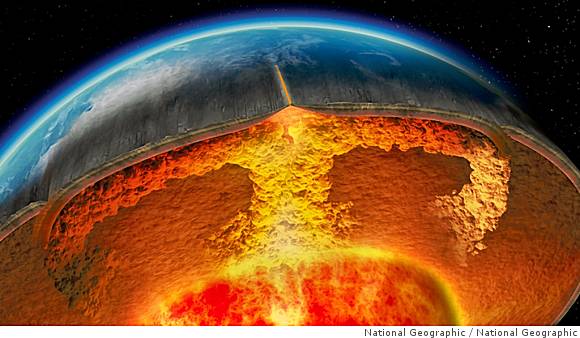
Washington, D.C—The key to understanding Earth’s evolution is to look at how heat is conducted in the deep lower mantle—a region some 400 to 1,800 miles (660 to 2,900 kilometers) below the surface. Researchers at the Carnegie Institution, with colleagues at the University of Illinois, have for the first time been able to experimentally simulate the pressure conditions in this region to measure thermal conductivity using a new measurement technique developed by the collaborators and implemented by the Carnegie team on the mantle material magnesium oxide (MgO).
They found that heat transfer is lower than other predictions, with total heat flow across the Earth of about 10.4 terawatts, which is about 60 % of the power used today by civilization. They also found that conductivity has less dependence on pressure conditions than predicted. The research is published in the August 9, online Scientific Reports.
Lead author of the study Douglas Dalton explains: “The lower mantle sits on top of the core where pressures range from 230,000 to 1.3 million times the pressure at sea level. Temperatures are like an inferno—from about 2,800°F to 6,700 °F. The major constituents are oxides of magnesium, silicon and calcium. Heat transfer occurs at a higher rate across materials of high thermal conductivity than across materials of low thermal conductivity, thus these low thermal conductivity oxides are insulating.”
The atoms of the major mantle materials are solid solutions and are in a disordered arrangement, which affects the way they conduct heat. Until now, the effect of this disorder on the way heat was conducted could only be estimated with experiments at low pressures. The pressure dependence on thermal conductivity has not been addressed in disordered materials before.
“We squeezed the samples between two diamond tips in an anvil cell and measured the thermal conductivity of the samples, debuting a technique called time-domain thermoreflectance,” remarked co-author Alexander Goncharov. “We went up to 600,000 times atmospheric pressure at room temperature. This technique allows us to measure the thermal properties of the material from the change in the reflectance of the material’s surface, thus avoiding the need of contacting the material of interest as required by conventional techniques. We then compared the results to theoretical models.”
The scientists also showed that there is less dependence of thermal conductivity on pressure than had been predicted. Calculations showed that at the core-mantle boundary there is an estimated total heat flow of 10.4 terawatts across the Earth.
“The results provide important bounds on the degree to which heat is transferred by convection as opposed to conduction in the lower mantle,” said Russell J. Hemley, director of Carnegie’s Geophysical Laboratory. “The next step will be to examine effects of different mineral components on the thermal conductivity and to better understand the atomic scale basis of convective motion of these materials within the broader context of mantle dynamics.”
“The results suggest that this technique could really advance other high pressure and temperature studies of the deep Earth and provide a better understanding of how Earth is evolving and how materials act under the intense conditions,” concluded Goncharov.
This research was supported by the National Science Foundation, The Carnegie DOE Alliance Center (CDAC), and Energy Frontier Research in Extreme Environments Center ( EFree).
Note : The above story is based on materials provided by Carnegie Institution for Science
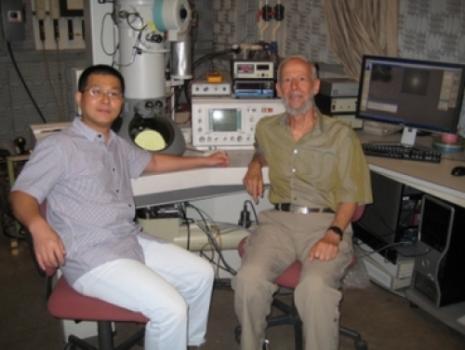
Jun Wu and Peter Buseck’s experiments demonstrate a new way of studying materials at high pressure and temperature within an electron microscope. (Credit: Image courtesy of Arizona State University)
High pressures and temperatures cause materials to exhibit unusual properties, some of which can be special. Understanding such new properties is important for developing new materials for desired industrial uses and also for understanding the interior of Earth, where everything is hot and squeezed.
A paper in Nature Geoscience highlights a new technique in which small amounts of a sample can be studied while being hot and squeezed within an electron microscope. Use of such a microscopy method permits determination of details down to the scale of a few atoms, including the detection of unexpected atom types or atoms in unexpected places, as within a mineral.
Jun Wu and Peter Buseck, the paper’s authors, both at Arizona State University, conducted the research on campus at the J.M. Cowley Center for High Resolution Electron Microscopy of the LeRoy Eyring Center for Solid State Science. The researchers used tiny containers of carbon, less than one-thousandth the width of a human hair and therefore small enough to fit within high-resolution electron microscopes, to enclose materials similar to those deep within Earth. They then used the electron beam to shrink and thereby squeeze these minuscule capsules. When combined with heating of the samples, new features were observed in the enclosed materials.
“Under such high pressures and temperatures, the materials inside the capsules developed faults that concentrated carbon along them,” explains Buseck, Regents’ Professor in the Department of Chemistry and Biochemistry and the School of Earth and Space Exploration.
The Nature Geoscience paper describes the use of this new method to address the important problem of how and where carbon is located within Earth’s interior. Carbon is an essential building block for all forms of life and it also has important effects on climate and climate change through greenhouses gases such as carbon dioxide and carbon tetrahydride, also known as natural gas or methane.
The largest single reservoir for carbon is within Earth’s interior. However, the known hosts for this carbon are believed to be insufficient to explain the amounts present.
Because Earth’s interior (as well as the interiors of other planets) contains vast amounts of materials like those used in the experiments, the scientists conclude that such faults, and the carbon they concentrate, provide a solution to the problem of explaining where large amounts of carbon reside in Earth’s interior.
Wu and Buseck’s experiments also demonstrate a new way of studying materials at high pressure and temperature within an electron microscope, thereby significantly extending the tools available to scientists for examining materials under extreme conditions.
Note : The above story is based on materials provided by Arizona State University.
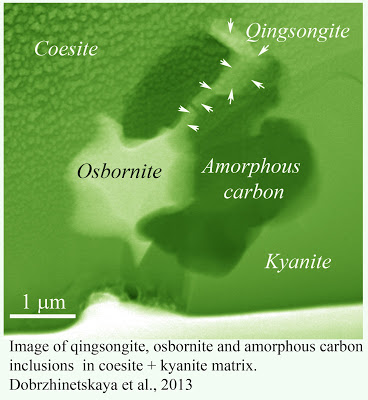
Geologists at the University of California, Riverside have discovered a new mineral, cubic boron nitride, which they have named “qingsongite.”
The discovery, made in 2009, was officially approved this week by the International Mineralogical Association.
The UC Riverside geologists, Larissa Dobrzhinetskaya and Harry Green in the Department of Earth Sciences, were joined by scientists at the Lawrence Livermore National Laboratory, the University of Maine and from institutions in China and Germany in making the discovery.
“The uniqueness of qingsongite is that it is the first boron mineral that was found to be formed at extreme conditions in deep Earth,” Dobrzhinetskaya said. “All other known boron minerals are found at Earth’s surface.”
The mineral was found in the southern Tibetan mountains of China within chromium-rich rocks of the paleooceanic crust that was subducted to a depth of 190 miles and recrystallized there at a temperature of about 2372 degrees Fahrenheit and pressure of about 118430 atmospheres.
“About 180 million years ago the rocks were returned back to shallow levels of the Earth by plate tectonic processes leading to the closure of the huge Paleo-Thethys ocean — an ancient Paleozoic ocean — and the collision of India with the Asian lithospheric plate,” Dobrzhinetskaya explained.
Until now, cubic boron nitride, created first in the laboratory in 1957, was known as an important technological material. Because its atomic structure bears resemblance to carbon bonds in diamond, it has high density and could be as hard as diamond.
Over 4,700 species of minerals have been recognized to date, and nowadays at least 100 proposals for new minerals and their names are submitted each year for approval by the Commission on New Minerals, Nomenclature and Classification of the International Mineralogical Association, which was founded in 1958. Commission members, who represent 34 countries including the U.S., vote separately on each new mineral and its name.
Qingsongite was named after Qingsong Fang (1939–2010), a professor at the Institute of Geology, the Chinese Academy of Geological Sciences, who found the first diamond in the Tibetan chromium-rich rocks in the late 1970s, and contributed to the discovery of four new mineral species.
The scientific project that led to the discovery of qingsongite was supported by grants from the University of California Laboratory Fees Research Program and the National Science Foundation.
Note : The above story is based on materials provided by University of California
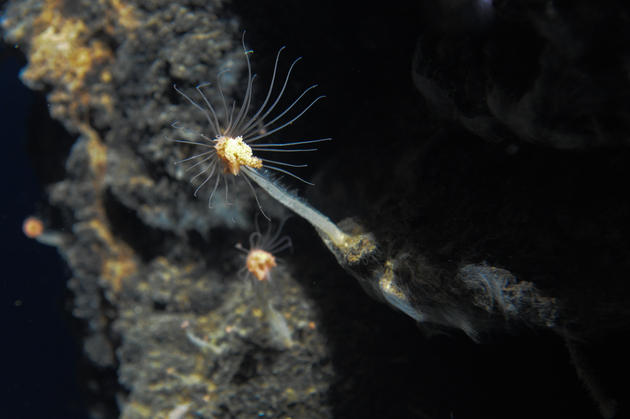
At Loki’s Castle in the Arctic Ocean, researchers from the University of Bergen (UiB) have discovered a so far unknown world of volcanic activity underwater. They hope that this can become Norway’s new national park.
In 2008, UiB researchers discovered Loki’s Castle, a field of five active hydrothermal vents on the Mid-Atlantic Ridge between Norway and Greenland at 73°N. The field contains rich metal deposits and a unique wildlife.
New discoveries
This summer a team led by the director of UiB’s Centre for Geobiology, Professor Rolf Birger Pedersen, discovered five new hydrothermal vents in Loki’s Castle. The vents were discovered at depths ranging from 100 to 2,500 metres. In this area, which is the most geological active part of Norway, a new volcanic seabed is formed at a rate of two centimetres a year.
On Thursday 1 August, Professor Pedersen and UiB’s Rector Dag Rune Olsen met with Norway’s Minister of the Environment, Bård Vegar Solhjell, to talk about the research on the world’s last few blank spots and to discuss how Norway can contribute to preserving these wildlife reserves.
“These discoveries are incredibly interesting as they represent a part of the Norwegian nature that is under-explored. They represent a part of nature where conditions are extreme and where we expect to find a lot of new and exciting biology,” Rector Olsen said.
Unique videos
At the meeting Olsen and Pedersen showed new and unique video recordings of Norway’s unknown volcanoes to the minister and other select guests. Minister Solhjell was impressed with the research done and promised action.
“At the Ministry of the Environment will start work to consider more carefully how to take care of these areas in the best way possible. It is an amazing idea that we can create spectacular underwater nature parks, but it may not happen right away as we need more knowledge in how to make this work,” Solhjell said.
Norway is a volcanic country on par with Iceland. The difference being that whereas Iceland’s volcanoes are onshore, Norway’s volcano landscape is in the deep sea. Norway’s volcanoes are lined up underwater in large active earthquake zones, and there are hydrothermal vents churning out hot water — at 320 degrees Celsius — which gives rise to unique ecosystems and metal deposits on the seabed.
UiB’s Centre for Geobiology is Norway’s leading deep-ocean research environment. For the past ten years, researchers and students from the centre have explored this volcanic underwater world. Through their summer expeditions to the area, they have discovered new Norwegian nature every year.
In this period they have surveyed hundreds of undersea volcanoes and a number of hydrothermal vents. Loki’s Castle (Lokeslottet), Soria Moria and Trollveggen are the names given to the hydrothermal vents discovered by the UiB researchers in 2005 and 2008.
National park on the seabed
The researchers believe that Loki’s Castle could become a Norwegian national park on the seabed, not unlike Yellowstone in the United States or Iceland’s geysers.
The UiB researchers see that there could be future conflicts of interest if such a national park is to be established. They have found significant metal deposits that are formed around the hydrothermal vents in Loki’s Castle. The material value of these deposits remains unknown, but the mining industry is already showing a growing interest in exploiting these resources on the seabed. Deep-ocean mining could become a reality in the not too distant future. The distinctive wildlife in the deep seas, with the hydrothermal vents as oases of a unique genetic life, means that any industrial activity must be weighed against environmental concerns.
Based on their knowledge, the UiB researchers are thus proposing that deep-marine nature parks should be established as soon as possible. This is of particular importance for Norway, with vast deep-sea areas to manage. This management must be based on scientific knowledge.
“It is our opinion that this area is so unique that it should be preserved. We are talking about very vulnerable environments,” Professor Pedersen said and pointed out that research also needs to create more knowledge about the wildlife in the area.
“It would represent a new way of preservation thinking if a national park was to be linked to Loki’s Castle,” Rector Olsen said. “Given the University of Bergen’s marine research profile, we definitely want to take responsibility for further exploration of these fields so as to give the Norwegian government a good scientific basis when they make a decision.”
Note : The above story is based on materials provided by University of Bergen. The original article was written by Walter Wehus and Sverre Ole Drønen.
If some volcanoes operate on geologic timescales, Costa Rica’s Irazú had something of a short fuse. In a new study in the journal Nature, scientists suggest that the 1960s eruption of Costa Rica’s largest stratovolcano was triggered by magma rising from the mantle over a few short months, rather than thousands of years or more, as many scientists have thought. The study is the latest to suggest that deep, hot magma can set off an eruption fairly quickly, potentially providing an extra tool for detecting an oncoming volcanic disaster.
“If we had had seismic instruments in the area at the time we could have seen these deep magmas coming,” said the study’s lead author, Philipp Ruprecht, a volcanologist at Columbia University’s Lamont-Doherty Earth Observatory. “We could have had an early warning of months, instead of days or weeks.”
Towering more than 10,000 feet and covering almost 200 square miles, Irazú erupts about every 20 years or less, with varying degrees of damage. When it awakened in 1963, it erupted for two years, killing at least 20 people and burying hundreds of homes in mud and ash. Its last eruption, in 1994, did little damage.
Irazú sits on the Pacific Ring of Fire, where oceanic crust is slowly sinking beneath the continents, producing some of earth’s most spectacular fireworks. Conventional wisdom holds that the mantle magma feeding those eruptions rises and lingers for long periods of time in a mixing chamber several miles below the volcano. But ash from Irazú’s prolonged explosion is the latest to suggest that some magma may travel directly from the upper mantle, covering more than 20 miles in a few months.
“There has to be a conduit from the mantle to the magma chamber,” said study co-author Terry Plank, a geochemist at Lamont-Doherty. “We like to call it the highway from hell.”
Their evidence comes from crystals of the mineral olivine separated from the ashes of Irazú’s 1963-1965 eruption, collected on a 2010 expedition to the volcano. As magma rising from the mantle cools, it forms crystals that preserve the conditions in which they formed. Unexpectedly, Irazú’s crystals revealed spikes of nickel, a trace element found in the mantle. The spikes told the researchers that some of Irazú’s erupted magma was so fresh the nickel had not had a chance to diffuse.
“The study provides one more piece of evidence that it’s possible to get magma from the mantle to the surface in very short order,” said John Pallister, who heads the U.S. Geological Survey (USGS) Volcano Disaster Assistance Program in Vancouver, Wash. “It tells us there’s a potentially shorter time span we need to worry about.”
Deep, fast-rising magma has been linked to other big events. In 1991, Mount Pinatubo in the Philippines spewed so much gas and ash into the atmosphere that it cooled Earth’s climate. In the weeks before the eruption, seismographs recorded hundreds of deep earthquakes that USGS geologist Randall White later attributed to magma rising from the mantle-crust boundary. In 2010, a chain of eruptions at Iceland’s Eyjafjallajökull volcano that caused widespread flight cancellations also indicated that some magma was coming from down deep. Small earthquakes set off by the eruptions suggested that the magma in Eyjafjallajökull’s last two explosions originated 12 miles and 15 miles below the surface, according to a 2012 study by University of Cambridge researcher Jon Tarasewicz in Geophysical Research Letters.
Volcanoes give off many warning signs before a blow-up. Their cones bulge with magma. They vent carbon dioxide and sulfur into the air, and throw off enough heat that satellites can detect their changing temperature. Below ground, tremors and other rumblings can be detected by seismographs. When Indonesia’s Mount Merapi roared to life in late October 2010, officials led a mass evacuation later credited with saving as many as 20,000 lives.
Still, the forecasting of volcanic eruptions is not an exact science. Even if more seismographs could be placed along the flanks of volcanoes to detect deep earthquakes, it is unclear if scientists would be able to translate the rumblings into a projected eruption date. Most problematically, many apparent warning signs do not lead to an eruption, putting officials in a bind over whether to evacuate nearby residents.
“[Several months] leaves a lot of room for error,” said Erik Klemetti, a volcanologist at Denison University. “In volcanic hazards you have very few shots to get people to leave.”
Scientists may be able to narrow the window by continuing to look for patterns between eruptions and the earthquakes that precede them. The Nature study also provides a real-world constraint for modeling how fast magma travels to the surface. “If this interpretation is correct, you start having a speed limit that your models of magma transport have to catch,” said Tom Sisson, a USGS volcanologist based at Menlo Park, Calif.
Olivine minerals with nickel spikes similar to Irazú’s have been found in the ashes of arc volcanoes in Mexico, Siberia and the Cascades of the U.S. Pacific Northwest, said Lamont geochemist Susanne Straub, whose ideas inspired the study. “It’s clearly not a local phenomenon,” she said. The researchers are currently analyzing crystals from past volcanic eruptions in Alaska’s Aleutian Islands, Chile and Tonga, but are unsure how many will bear Irazú’s fast-rising magma signature. “Some may be capable of producing highways from hell and some may not,” said Ruprecht.
This image from the floor of the Atlantic Ocean shows a collection of limestone towers known as the “Lost City.” Alkaline hydrothermal vents of this type are suggested to be the birthplace of the first living organisms on the ancient Earth. Scientists are interested in understanding early life on Earth because if we ever hope to find life on other worlds – especially icy worlds with subsurface oceans such as Jupiter’s moon Europa and Saturn’s Enceladus – we need to know what chemical signatures to look for. (Credit: Image courtesy D. Kelley and M. Elend/University of Washington)
How did life on Earth get started? Three new papers co-authored by Mike Russell, a research scientist at NASA’s Jet Propulsion Laboratory, Pasadena, Calif., strengthen the case that Earth’s first life began at alkaline hydrothermal vents at the bottom of oceans. Scientists are interested in understanding early life on Earth because if we ever hope to find life on other worlds — especially icy worlds with subsurface oceans such as Jupiter’s moon Europa and Saturn’s Enceladus — we need to know what chemical signatures to look for.
Two papers published recently in the journal Philosophical Transactions of the Royal Society B provide more detail on the chemical and precursor metabolic reactions that have to take place to pave the pathway for life. Russell and his co-authors describe how the interactions between the earliest oceans and alkaline hydrothermal fluids likely produced acetate (comparable to vinegar). The acetate is a product of methane and hydrogen from the alkaline hydrothermal vents and carbon dioxide dissolved in the surrounding ocean. Once this early chemical pathway was forged, acetate could become the basis of other biological molecules. They also describe how two kinds of “nano-engines” that create organic carbon and polymers — energy currency of the first cells — could have been assembled from inorganic minerals.
A paper published in the journal Biochimica et Biophysica Acta analyzes the structural similarity between the most ancient enzymes of life and minerals precipitated at these alkaline vents, an indication that the first life didn’t have to invent its first catalysts and engines.
“Our work on alkaline hot springs on the ocean floor makes what we believe is the most plausible case for the origin of the life’s building blocks and its energy supply,” Russell said. “Our hypothesis is testable, has the right assortment of ingredients and obeys the laws of thermodynamics.”
Russell’s work was funded by the NASA Astrobiology Institute through the Icy Worlds team based at JPL, a division of the California Institute of Technology, Pasadena. The NASA Astrobiology Institute, based at NASA’s Ames Research Center, Moffett Field, Calif., is a partnership among NASA, 15 U.S. teams and 13 international consortia. The Institute is part of NASA’s astrobiology program, which supports research into the origin, evolution, distribution and future of life on Earth and the potential for life elsewhere.
Note : The above story is based on materials provided by NASA/Jet Propulsion Laboratory.