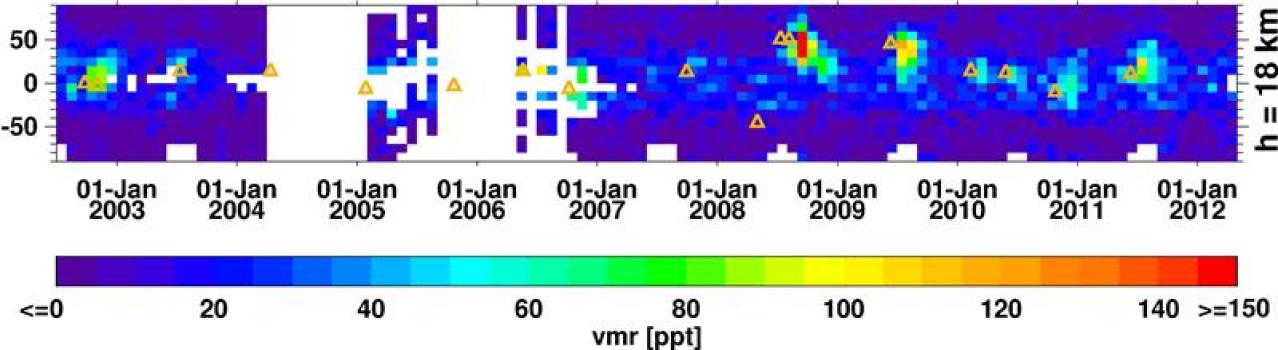
MIPAS data confirm the correlation between high sulfur dioxide concentrations (yellow-red) and high-reaching volcano eruptions (triangles). (Credit: KIT/M. Höpfner)
Trace gases and aerosols are major factors influencing the climate. With the help of highly complex installations, such as MIPAS on board of the ENVISAT satellite, researchers try to better understand the processes in the upper atmosphere.
Now, Karlsruhe Institute of Technology presents the most comprehensive overview of sulfur dioxide measurements in the journal Atmospheric Chemistry and Physics.
“Sulfur compounds up to 30 km altitude may have a cooling effect,” Michael Höpfner, the KIT scientist responsible for the study, says. For example, sulfur dioxide (SO2) and water vapor react to sulfuric acid that forms small droplets, called aerosols, that reflect solar radiation back into universe. “To estimate such effects with computer models, however, the required measurement data have been lacking so far.” MIPAS infrared spectrometer measurements, however, produced a rather comprehensive set of data on the distribution and development of sulfur dioxide over a period of ten years.
Based on these results, major contributions of the sulfur budget in the stratosphere can be analyzed directly. Among others, carbonyl sulfide (COS) gas produced by organisms ascends from the oceans, disintegrates at altitudes higher than 25 km, and provides for a basic concentration of sulfur dioxide. The increase in the stratospheric aerosol concentration observed in the past years is caused mainly by sulfur dioxide from a number of volcano eruptions. “Variation of the concentration is mainly due to volcanoes,” Höpfner explains. Devastating volcano eruptions, such as those of the Pinatubo in 1991 and Tambora in 1815, had big a big effect on the climate. The present study also shows that smaller eruptions in the past ten years produced a measurable effect on sulfur dioxide concentration at altitudes between 20 and 30 km. “We can now exclude that anthropogenic sources, e.g. power plants in Asia, make a relevant contribution at this height,” Höpfner says.
“The new measurement data help improve consideration of sulfur-containing substances in atmosphere models,” Höpfner explains. “This is also important for discussing the risks and opportunities of climate engineering in a scientifically serious manner.”
MIPAS (Michelson Interferometer for Passive Atmospheric Sounding) was one of the main instruments on board of the European environmental satellite ENVISAT that supplied data from 2002 to 2012. MIPAS was designed by the KIT Institute of Meteorology and Climate Research. All around the clock, the instrument measured temperature and more than 30 atmospheric trace gases. It recorded more than 75 million infrared spectra. KIT researchers, together with colleagues from Forschungszentrum Jülich, have now developed the MIPAS successor GLORIA that may be the basis of a future satellite instrument for climate research.
Note : The above story is reprinted from materials provided by Karlsruhe Institute of Technology.
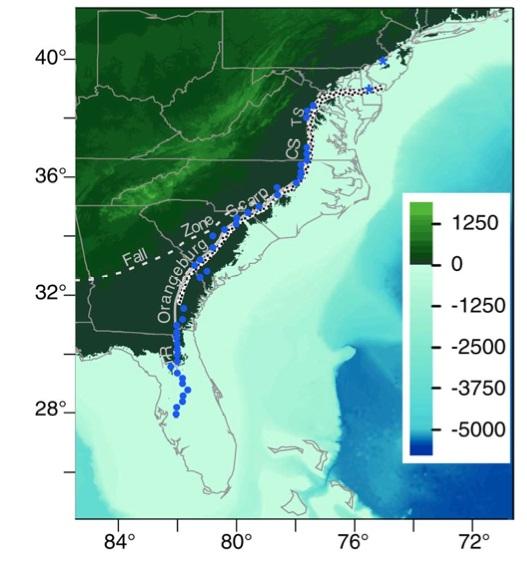
The East Coast shoreline, also known as the Orangeburg Scarp, as it may have appeared 3 million years ago. (Credit: Image courtesy of Syracuse University)
From Virginia to Florida, there is a prehistoric shoreline that, in some parts, rests more than 280 feet above modern sea level. The shoreline was carved by waves more than 3 million years ago — possible evidence of a once higher sea level, triggered by ice-sheet melting. But new findings by a team of researchers, including Robert Moucha, assistant professor of Earth Sciences in The College of Arts and Sciences, reveal that the shoreline has been uplifted by more than 210 feet, meaning less ice melted than expected.
Equally compelling is the fact that the shoreline is not flat, as it should be, but is distorted, reflecting the pushing motion of Earth’s mantle.
This is big news, says Moucha, for scientists who use the coastline to predict future sea-level rise. It’s also a cautionary tale for those who rely almost exclusively on cycles of glacial advance and retreat to study sea-level changes.
“Three million years ago, the average global temperature was two to three degrees Celsius higher, while the amount of carbon dioxide in the atmosphere was comparable to that of today,” says Moucha, who contributed to a paper on the subject in the May 15 issue of Science Express. “If we can estimate the height of the sea from 3 million years ago, we can then relate it to the amount of ice sheets that melted. This period also serves as a window into what we may expect in the future.”
Moucha and his colleagues — led by David Rowley, professor of geophysical sciences at the University of Chicago — have been using computer modeling to pinpoint exactly what melted during this interglacial period, some 3 million years ago. So far, evidenced is stacked in favor of Greenland, West Antarctica and the sprawling East Antarctica ice sheet, but the new shoreline uplift implies that East Antarctica may have melted some or not at all. “It’s less than previous estimates had implied,” says Rowley, the article’s lead author.
Moucha’s findings show that the jagged shoreline may have been caused by the interplay between Earth’s surface and its mantle — a process known as dynamic topography. Advanced modeling suggests that the shoreline, referred to as the Orangeburg Scarp, may have shifted as much as 196 feet. Modeling also accounts for other effects, such as the buildup of offshore sediments and glacial retreats.
“Dynamic topography is a very important contributor to Earth’s surface evolution,” says Rowley. “With this work, we can demonstrate that even small-scale features, long considered outside the realm of mantle influence, are reflective of mantle contributions.”
Building a case
Moucha’s involvement with the project grew out of a series of papers he published as a postdoctoral fellow at the Canadian Institute for Advance Research in Montreal. In one paper from 2008, he drew on elements of the North American East Coast and African West Coast to build a case against the existence of stable continental platforms.
“The North American East Coast has always been thought of as a passive margin,” says Moucha, referring to large areas usually bereft of tectonic activity. “[With Rowley], we’ve challenged the traditional view of passive margins by showing that through observations and numerical simulations, they are subject to long-term deformation, in response to mantle flow.”
Central to Moucha’s argument is the fact that viscous mantle flows everywhere, all the time. As a result, it’s nearly impossible to find what he calls “stable reference points” on Earth’s surface to accurately measure global sea-level rise. “If one incorrectly assumed that a particular margin is a stable reference frame when, in actuality, it has subsided, his or her assumption would lead to a sea-level rise and, ultimately, to an increase in ice-sheet melt,” says Moucha, who joined SU’s faculty in 2011.
Another consideration is the size of the ice sheet. Between periods of glacial activity (such as the one from 3 million years ago and the one we are in now), ice sheets are generally smaller. Jerry Mitrovica, professor of geophysics at Harvard University who also contributed to the paper, says the same mantle processes that drive plate tectonics also deform elevations of ancient shorelines. “You can’t ignore this, or your estimate of the size of the ancient ice sheets will be wrong,” he says.
Rise and fall
Moucha puts it this way: “Because ice sheets have mass and mass results in gravitational attraction, the sea level actually falls near the melting ice sheet and rises when it’s further away. This variability has enabled us to unravel which ice sheet contributed to sea-level rise and how much of [the sheet] melted.”
The SU geophysicist credits much of the group’s success to state-of-the-art seismic tomography, a geological imaging technique led by Nathan Simmons at California’s Lawrence Livermore National Laboratory. “Nathan, who co-authored the paper, provided me with seismic tomography data, from which I used high-performance computing to model mantle flow,” says Moucha. “A few million years may have taken us a day to render, but a billion years may have taken several weeks or more.”
Moucha and his colleagues hope to apply their East Coast model to the Appalachian Mountains, which are also considered a type of passive geology. Although they have been tectonically quiet for more than 200 million years, the Appalachians are beginning to show signs of wear and tear: rugged peaks, steep slopes, landslides, and waterfalls — possible evidence of erosion, triggered by dynamic topography.
“Scientists, such as Rob, who produce increasingly accurate models of dynamic topography for the past, are going to be at the front line of this important research area,” says Mitrovica.
Adds Rowley: “Rob Moucha has demonstrated that dynamic topography is a very important contributor to Earth’s surface evolution. … His study of mantle contributions is appealing on a large number of fronts that I, among others of our collaboration, hope to pursue.”
Note : The above story is reprinted from materials provided by Syracuse University. The original article was written by Rob Enslin.
A new study claims earthquakes and volcanoes are responsible for the diverse nature of the ocean’s coral reefs. With this information, scientists are now becoming even more worried about global warming. If these monumental geological events play a role in coral creation, it may be even more difficult to replace any reef lost to climate change and rising sea temperatures. This study, conducted by scientists from the ARC Centre of Excellence for Coral Reef Studies (CoECRS), is published in the journal Proceedings of the Royal Society B.Lead author Dr. Sally Keith of CoECRS and James Cook University says geological events and the general unease beneath the ocean floor is responsible for the wide variety of coral reefs seen in the Earth’s oceans. This also explains why some species of coral are more prevalent than others.
“There are many theories to explain how coral reefs came to be,” said Dr. Keith in a press statement.
“Traditionally scientists have tested these theories by looking at where species occur. We used a fresh approach that focused on where species stopped occurring and why.”
Dr. Keith and her colleagues were shocked when they analyzed the results of their study. Though it had previously been understood that coral species were at the mercy of environmental factors such as temperature and habitat, the results suggested that geological events from millions of years ago actually determined what species of coral grew and where. The gradual shifting of tectonic plates over millions of years is responsible for creating a diverse species of coral, says Dr. Keith.
“For example, Hawaii is a chain of volcanic islands that has formed as a tectonic plate moves over a ‘hotspot’ of molten rock. The rock repeatedly punches through the Earth’s crust as lava, producing volcanoes that jut out above the ocean surface, eventually forming a chain of volcanic islands,” explains Dr. Keith.
“Over time, corals spread across the island chain using the islands as ‘stepping stones’, while at the same time they (remained) isolated from the rest of the Pacific. As a result, a distinct set of Hawaiian coral reefs arises.”
Additionally, the team also found that older species of coral are better equipped to expand into new territories.
Volcanoes have been known to play a role in the formation of certain types of coral. For instance, coral that grows around a volcanic island as it sinks below the sea surface is called an atoll. These atolls can take millions of years to fully form, a fact which co-author Professor Sean Connolly says should be something to consider when discussing climate change.
“Climate change is leading to the loss of corals throughout the tropics. This study has shown that the diversity of corals we see today is the result of geological processes that occur over millions, even tens of millions, of years,” said professor Connolly.
“If we lose these coral-rich environments the recovery of this biodiversity will take a very long-time, so our results highlight just how critical it is to conserve the coral reefs that exist today.”
Note : The above story is reprinted from materials provided by Michael Harper for redOrbit
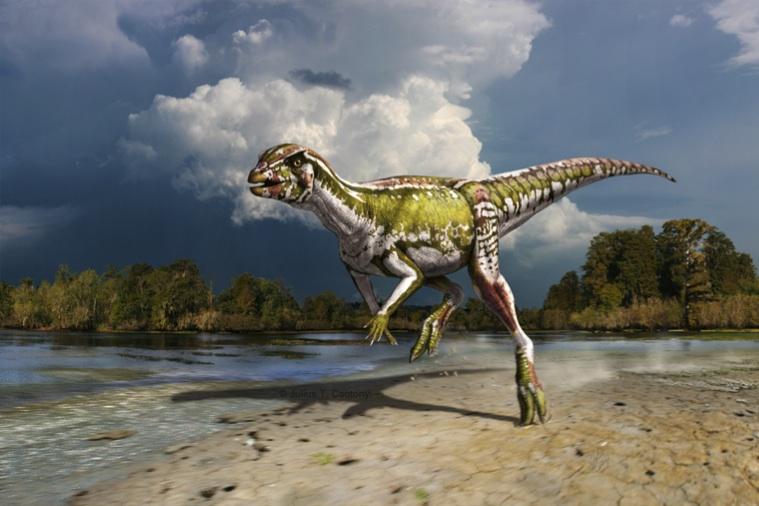
This is a life reconstruction of the new small-bodied, plant-eating dinosaur Albertadromeus syntarsus. (Credit: Art by Julius T. Csotonyi)
Dinosaurs are often thought of as large, fierce animals, but new research highlights a previously overlooked diversity of small dinosaurs. In the Journal of Vertebrate Paleontology, a team of paleontologists from the University of Toronto, Royal Ontario Museum, Cleveland Museum of Natural History and University of Calgary have described a new dinosaur, the smallest plant-eating dinosaur species known from Canada. Albertadromeus syntarsus was identified from a partial hind leg, and other skeletal elements, that indicate it was a speedy runner. Approximately 1.6 m (5 ft) long, it weighed about 16 kg (30 lbs), comparable to a large turkey.
Albertadromeus lived in what is now southern Alberta in the Late Cretaceous, about 77 million years ago. Albertadromeus syntarsus means “Alberta runner with fused foot bones.” Unlike its much larger ornithopod cousins, the duckbilled dinosaurs, its two fused lower leg bones would have made it a fast, agile two-legged runner. This animal is the smallest known plant-eating dinosaur in its ecosystem, and researchers hypothesize that it used its speed to avoid predation by the many species of meat-eating dinosaurs that lived at the same time.
Albertadromeus was discovered in 2009 by study co-author David Evans of the Royal Ontario Museum as part an on-going collaboration with Michael Ryan of the Cleveland Museum of Natural History to investigate the evolution of dinosaurs in the Late Cretaceous of North America. The known dinosaur diversity of this time period is dominated by large bodied plant-eating dinosaurs.
Why are so few small-bodied dinosaurs known from North America some 77 million years ago? Smaller animals are less likely to be preserved than larger ones, because their bones are more delicate and are often destroyed before being fossilized. “We know from our previous research that there are preservational biases against the bones of these small dinosaurs,” said Caleb Brown of the University of Toronto, lead author of the study. “We are now starting to uncover this hidden diversity, and although skeletons of these small ornithopods are both rare and fragmentary, our study shows that these dinosaurs were more abundant in their ecosystems than previously thought.”
The reason for our relatively poor understanding of these small dinosaurs is a combination of the taphonomic processes (those related to decay and preservation) described above, and biases in the way that material has been collected. Small skeletons are more prone to destruction by carnivores, scavengers and weathering processes, so fewer small animals are available to become fossils and smaller animals are often more difficult to find and identify than those of larger animals.
“Albertadromeus may have been close to the bottom of the dinosaur food chain but without dinosaurs like it you’d not have giants like T. rex,” said Michael Ryan. “Our understanding of the structure of dinosaur ecosystems is dependent on the fossils that have been preserved. Fragmentary, but important, specimens like that of Albertadromeus suggest that we are only beginning to understand the shape of dinosaur diversity and the structure of their communities.”
“You can imagine such small dinosaurs filling the niche of animals such as rabbits and being major, but relatively inconspicuous, members of their ecological community” said Anthony Russell of the University of Calgary.
Note : The above story is reprinted from materials provided by Society of Vertebrate Paleontology.
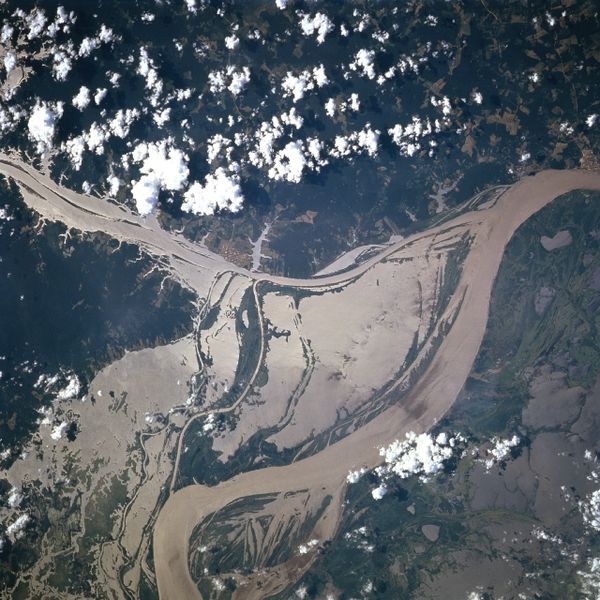
The mouth of the Amazon River has three main channels, with an island the size of Switzerland in the middle. (Credit: NASA)
The Amazon rain forest, popularly known as the lungs of the planet, inhales carbon dioxide as it exudes oxygen. Plants use carbon dioxide from the air to grow parts that eventually fall to the ground to decompose or get washed away by the region’s plentiful rainfall.
Until recently, people believed much of the rain forest’s carbon floated down the Amazon River and ended up deep in the ocean. University of Washington research showed a decade ago that rivers exhale huge amounts of carbon dioxide — though left open the question of how that was possible, since bark and stems were thought to be too tough for river bacteria to digest.
A study published this week in Nature Geoscience resolves the conundrum, proving that woody plant matter is almost completely digested by bacteria living in the Amazon River, and that this tough stuff plays a major part in fueling the river’s breath.
The finding has implications for global carbon models, and for the ecology of the Amazon and the world’s other rivers.
“People thought this was one of the components that just got dumped into the ocean,” said first author Nick Ward, a UW doctoral student in oceanography. “We’ve found that terrestrial carbon is respired and basically turned into carbon dioxide as it travels down the river.”
Tough lignin, which helps form the main part of woody tissue, is the second most common component of terrestrial plants. Scientists believed that much of it got buried on the seafloor to stay there for centuries or millennia. The new paper shows river bacteria break it down within two weeks, and that just 5 percent of the Amazon rainforest’s carbon ever reaches the ocean.
“Rivers were once thought of as passive pipes,” said co-author Jeffrey Richey, a UW professor of oceanography. “This shows they’re more like metabolic hotspots.”
When previous research showed how much carbon dioxide was outgassing from rivers, scientists knew it didn’t add up. They speculated there might be some unknown, short-lived carbon source that freshwater bacteria could turn into carbon dioxide.
“The fact that lignin is proving to be this metabolically active is a big surprise,” Richey said. “It’s a mechanism for the rivers’ role in the global carbon cycle — it’s the food for the river breath.”
The Amazon alone discharges about one-fifth of the world’s freshwater and plays a large role in global processes, but it also serves as a test bed for natural river ecosystems.
Richey and his collaborators have studied the Amazon River for more than three decades. Earlier research took place more than 500 miles upstream. This time the U.S. and Brazilian team sought to understand the connection between the river and ocean, which meant working at the mouth of the world’s largest river — a treacherous study site.
“There’s a reason that no one’s really studied in this area,” Ward said. “Pulling it off has been quite a challenge. It’s a humongous, sloppy piece of water.”
The team used flat-bottomed boats to traverse the three river mouths, each so wide that you cannot see land, in water so rich with sediment that it looks like chocolate milk. Tides raise the ocean by 30 feet, reversing the flow of freshwater at the river mouth, and winds blow at up to 35 mph.
Under these conditions, Ward collected river water samples in all four seasons. He compared the original samples with ones left to sit for up to a week at river temperatures. Back at the UW, he used newly developed techniques to scan the samples for some 100 compounds, covering 95 percent of all plant-based lignin. Previous techniques could identify only 1 percent of the plant-based carbon in the water.
Based on the results, the authors estimate that about 45 percent of the Amazon’s lignin breaks down in soils, 55 percent breaks down in the river system, and 5 percent reaches the ocean, where it may break down or sink to the ocean floor.
“People had just assumed, ‘Well, it’s not energetically feasible for an organism to break lignin apart, so why would they?'” Ward said. “We’re thinking that as rain falls over the land it’s taking with it these lignin compounds, but it’s also taking with it the bacterial community that’s really good at eating the lignin.”
The research was supported by the Gordon and Betty Moore Foundation, the National Science Foundation and the Research Council for the State of São Paulo. Co-authors are Richard Keil at the UW; Patricia Medeiros and Patricia Yager at the University of Georgia; Daimio Brito and Alan Cunha at the Federal University of Amap in Brazil; Thorsten Dittmar at Carl von Ossietzky University in Germany; and Alex Krusche at University of São Paulo in Brazil.
Note : The above story is reprinted from materials provided by University of Washington. The original article was written by Hannah Hickey.
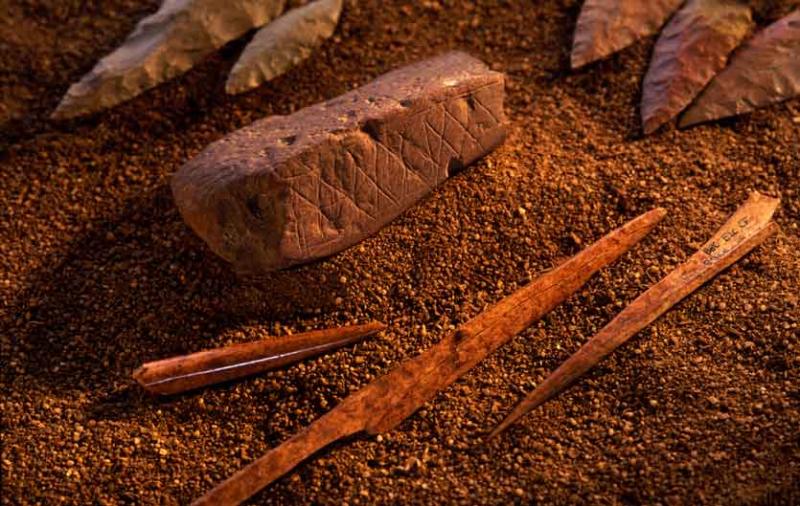
Middle Stone Age Silcrete bifacial points, engraved ochre and bone tools from the c. 75 – 80,000 year old M1 & M2 phases at Blombos cave. (Credit: Chenshilwood at en.wikipedia [GFDL, CC-BY-SA-3.0 or CC-BY-2.5], from Wikimedia Commons)Rapid climate change during the Middle Stone Age, between 80,000 and 40,000 years ago, during the Middle Stone Age, sparked surges in cultural innovation in early modern human populations, according to new research.
The research, published this month in Nature Communications, was conducted by a team of scientists from Cardiff University’s School of Earth and Ocean Sciences, the Natural History Museum in London and the University of Barcelona.
The scientists studied a marine sediment core off the coast of South Africa and reconstructed terrestrial climate variability over the last 100,000 years.
Dr Martin Ziegler, Cardiff University School of Earth and Ocean Sciences, said: “We found that South Africa experienced rapid climate transitions toward wetter conditions at times when the Northern Hemisphere experienced extremely cold conditions.”
These large Northern Hemisphere cooling events have previously been linked to a change in the Atlantic Ocean circulation that led to a reduced transport of warm water to the high latitudes in the North. In response to this Northern Hemisphere cooling, large parts of the sub-Saharan Africa experienced very dry conditions.
“Our new data however, contrasts with sub-Saharan Africa and demonstrates that the South African climate responded in the opposite direction, with increasing rainfall, that can be associated with a globally occurring southward shift of the tropical monsoon belt.”
Linking climate change with human evolution
Professor Ian Hall, Cardiff University School of Earth and Ocean Sciences, said: “When the timing of these rapidly occurring wet pulses was compared with the archaeological datasets, we found remarkable coincidences.
“The occurrence of several major Middle Stone Age industries fell tightly together with the onset of periods with increased rainfall.”
“Similarly, the disappearance of the industries appears to coincide with the transition to drier climatic conditions.”
Professor Chris Stringer of London’s Natural History Museum commented, “The correspondence between climatic ameliorations and cultural innovations supports the view that population growth fuelled cultural changes, through increased human interactions.”
The South African archaeological record is so important because it shows some of the oldest evidence for modern behavior in early humans. This includes the use of symbols, which has been linked to the development of complex language, and personal adornments made of seashells.
“The quality of the southern African data allowed us to make these correlations between climate and behavioural change, but it will require comparable data from other areas before we can say whether this region was uniquely important in the development of modern human culture” added Professor Stringer.
The new study presents the most convincing evidence so far that abrupt climate change was instrumental in this development.
Note: The above story is reprinted from materials provided by Cardiff University.
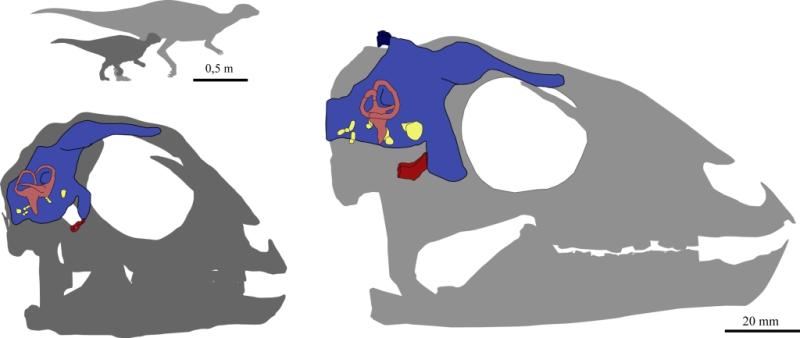
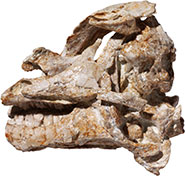
Reconstruction of the brain in the young and fully grown Dysalotosaurus lettowvorbecki. (Credit: Stephan Lautenschlager, University of Bristol)Fossil skull of the juvenile specimen of Dysalotosaurus lettowvorbecki Image by Tom Hübner, Niedersächsisches Landesmuseum Hannover
A new study conducted at the University of Bristol and published online today in the Journal of Evolutionary Biology sheds light on how the brain and inner ear developed in dinosaurs.
Stephan Lautenschlager from Bristol’s School of Earth Sciences, together with Tom Hübner from the Niedersächsische Landesmuseum in Hannover, Germany, picked the brains of 150 million year old dinosaurs.
The two palaeontologists studied different fossils of the Jurassic dinosaur Dysalotosaurus lettowvorbecki: a
Stephan Lautenschlager, lead author of the paper, said: “The two different growth stages of Dysalotosaurus provided a unique opportunity to study their brain, and how it developed during the growth of the animal.”
Using high-resolution CT scanning and 3D computer imaging, it was possible to reconstruct and visualise the brain and inner ear of Dysalotosaurus lettowvorbecki — a small, plant-eating dinosaur, which lived 150 million years ago, in what is now Tanzania.
Co-author Tom Hübner said: “Well-preserved fossil material, which can be used to reconstruct the brain anatomy is usually rare. Thus, we were fortunate to have different growth stages available for our study.”
By looking at the brain and inner ear anatomy, the two researchers found that the brain of Dysalotosaurus underwent considerable changes during growth — most likely as a response to environmental and metabolic requirements. However, important parts responsible for the sense of hearing and cognitive processes were already well developed in the young individual.
Stephan Lautenschlager said: “Our study shows that the brain was already well-developed in the young dinosaurs and adapted perfectly to interact with their environment and other individuals.”
This study has important ramifications for the understanding of how parts of the brain developed in dinosaurs. However, further research into that field is necessary to investigate if the pattern of brain development in individual dinosaurs is also reflected in a large scale trend during the more than 150 million years of dinosaur evolution.
The study was funded by a research fellowship to Stephan Lautenschlager from the German Volkswagen Foundation.
very young (juvenile) individual of approximately three years of age and a fully grown specimen of more than 12 years of age.
Note : The above story is reprinted from materials provided by University of Bristol.
Herds of wooly mammoths once shook Earth beneath their feet, sending humans scurrying across the landscape of prehistoric Ohio. But then something much larger shook Earth itself, and at that point these mega mammals’ days were numbered.
Something — global-scale combustion caused by a comet scraping our planet’s atmosphere or a meteorite slamming into its surface — scorched the air, melted bedrock and altered the course of Earth’s history. Exactly what it was is unclear, but this event jump-started what Kenneth Tankersley, an assistant professor of anthropology and geology at the University of Cincinnati, calls the last gasp of the last ice age.
“Imagine living in a time when you look outside and there are elephants walking around in Cincinnati,” Tankersley says. “But by the time you’re at the end of your years, there are no more elephants. It happens within your lifetime.”
Tankersley explains what he and a team of international researchers found may have caused this catastrophic event in Earth’s history in their research, “Evidence for Deposition of 10 Million Tonnes of Impact Spherules Across Four Continents 12,800 Years Ago,” which was published in the Proceedings of the National Academy of Sciences.
This research might indicate that it wasn’t the cosmic collision that extinguished the mammoths and other species, Tankersley says, but the drastic change to their environment.
“The climate changed rapidly and profoundly. And coinciding with this very rapid global climate change was mass extinctions.”
Putting a Finger On the End of the Ice Age
Tankersley is an archaeological geologist. He uses geological techniques, in the field and laboratory, to solve archaeological questions. He’s found a treasure trove of answers to some of those questions in Sheriden Cave in Wyandot County, Ohio. It’s in that spot, 100 feet below the surface, where Tankersley has been studying geological layers that date to the Younger Dryas time period, about 13,000 years ago.
About 12,000 years before the Younger Dryas, Earth was at the Last Glacial Maximum — the peak of the Ice Age. Millennia passed, and the climate began to warm. Then something happened that caused temperatures to suddenly reverse course, bringing about a century’s worth of near-glacial climate that marked the start of the geologically brief Younger Dryas.
There are only about 20 archaeological sites in the world that date to this time period and only 12 in the United States — including Sheriden Cave.
“There aren’t many places on the planet where you can actually put your finger on the end of the last ice age, and Sheriden Cave is one of those rare places where you can do that,” Tankersley says.
Rock-Solid Evidence of Cosmic Calamity
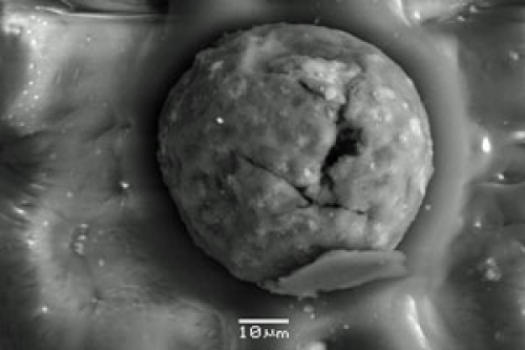
In studying this layer, Tankersley found ample evidence to support the theory that something came close enough to Earth to melt rock and produce other interesting geological phenomena. Foremost among the findings were carbon spherules. These tiny bits of carbon are formed when substances are burned at very high temperatures. The spherules exhibit characteristics that indicate their origin, whether that’s from burning coal, lightning strikes, forest fires or something more extreme. Tankersley says the ones in his study could only have been formed from the combustion of rock.
The spherules also were found at 17 other sites across four continents — an estimated 10 million metric tons’ worth — further supporting the idea that whatever changed Earth did so on a massive scale. It’s unlikely that a wildfire or thunderstorm would leave a geological calling card that immense — covering about 50 million square kilometers.
“We know something came close enough to Earth and it was hot enough that it melted rock — that’s what these carbon spherules are. In order to create this type of evidence that we see around the world, it was big,” Tankersley says, contrasting the effects of an event so massive with the 1883 volcanic explosion on Krakatoa in Indonesia. “When Krakatoa blew its stack, Cincinnati had no summer. Imagine winter all year-round. That’s just one little volcano blowing its top.”
Other important findings include:
Micrometeorites: smaller pieces of meteorites or particles of cosmic dust that have made contact with Earth’s surface.
Nanodiamonds: microscopic diamonds formed when a carbon source is subjected to an extreme impact, often found in meteorite craters.
Lonsdaleite: a rare type of diamond, also called a hexagonal diamond, only found in non-terrestrial areas such as meteorite craters.
Three Choices at the Crossroads of Oblivion
Tankersley says while the cosmic strike had an immediate and deadly effect, the long-term side effects were far more devastating — similar to Krakatoa’s aftermath but many times worse — making it unique in modern human history.
In the cataclysm’s wake, toxic gas poisoned the air and clouded the sky, causing temperatures to plummet. The roiling climate challenged the existence of plant and animal populations, and it produced what Tankersley has classified as “winners” and “losers” of the Younger Dryas. He says inhabitants of this time period had three choices: relocate to another environment where they could make a similar living; downsize or adjust their way of living to fit the current surroundings; or swiftly go extinct. “Winners” chose one of the first two options while “losers,” such as the wooly mammoth, took the last.
“Whatever this was, it did not cause the extinctions,” Tankersley says. “Rather, this likely caused climate change. And climate change forced this scenario: You can move, downsize or you can go extinct.”
Humans at the time were just as resourceful and intelligent as we are today. If you transported a teenager from 13,000 years ago into the 21st century and gave her jeans, a T-shirt and a Facebook account, she’d blend right in on any college campus. Back in the Younger Dryas, with mammoth off the dinner table, humans were forced to adapt — which they did to great success.
Weather Report: Cloudy With a Chance of Extinction
That lesson in survivability is one that Tankersley applies to humankind today.”Whether we want to admit it or not, we’re living right now in a period of very rapid and profound global climate change. We’re also living in a time of mass extinction,” Tankersley says. “So I would argue that a lot of the lessons for surviving climate change are actually in the past.”
He says it’s important to consider a sustainable livelihood. Humans of the Younger Dryas were hunter-gatherers. When catastrophe struck, these humans found news ways and new places to hunt game and gather wild plants. Evidence found in Sheriden Cave shows that most of the plants and animals living there also endured. Of the 70 species known to have lived there before the Younger Dryas, 68 were found there afterward. The two that didn’t make it were the giant beaver and the flat-headed peccary, a sharp-toothed pig the size of a black bear.
Tankersley also cautions that the possibility of another massive cosmic event should not be ignored. Like earthquakes, tsunamis and volcanoes, these types of natural disasters do happen, and as history has shown, it can be to devastating effect.
“One additional catastrophic change that we often fail to think about — and it’s beyond our control — is something from outer space,” Tankersley says. “It’s a reminder of how fragile we are. Imagine an explosion that happened today that went across four continents. The human species would go on. But it would be different. It would be a game changer.”
Note : The above story is reprinted from materials provided by University of Cincinnati. The original article was written by Tom Robinette.
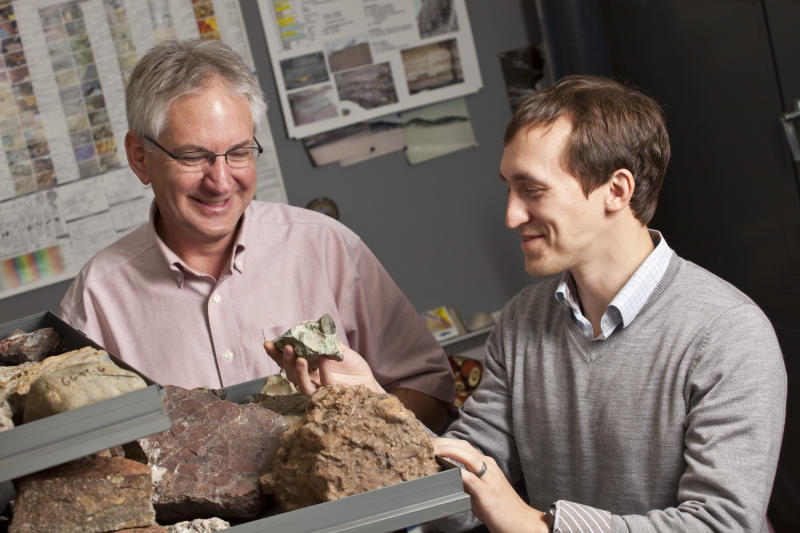
Georgia Tech School of Chemistry and Biochemistry postdoctoral fellow Chiaolong Hsiao (left) and professor Loren Williams examine on a light box a polyacrylamide gel surrounded by an iron solution to determine whether RNA is stable in the iron solution. (Credit: Georgia Tech Photo: Gary Meek)
A new study shows how complex biochemical transformations may have been possible under conditions that existed when life began on the early Earth.
The study shows that RNA is capable of catalyzing electron transfer under conditions similar to those of the early Earth. Because electron transfer, the moving of an electron from one chemical species to another, is involved in many biological processes — including photosynthesis, respiration and the reduction of RNA to DNA — the study’s findings suggest that complex biochemical transformations may have been possible when life began.
There is considerable evidence that the evolution of life passed through an early stage when RNA played a more central role, before DNA and coded proteins appeared. During that time, more than 3 billion years ago, the environment lacked oxygen but had an abundance of soluble iron.
“Our study shows that when RNA teams up with iron in an oxygen-free environment, RNA displays the powerful ability to catalyze single electron transfer, a process involved in the most sophisticated biochemistry, yet previously uncharacterized for RNA,” said Loren Williams, a professor in the School of Chemistry and Biochemistry at the Georgia Institute of Technology.
The results of the study were scheduled to be published online on May 19, 2013, in the journal Nature Chemistry. The study was sponsored by the NASA Astrobiology Institute, which established the Center for Ribosomal Origins and Evolution (Ribo Evo) at Georgia Tech.
Free oxygen gas was almost nonexistent in Earth’s atmosphere more than 3 billion years ago. When free oxygen began entering the environment as a product of photosynthesis, it turned Earth’s iron to rust, forming massive banded iron formations that are still mined today. The free oxygen produced by advanced organisms caused iron to be toxic, even though it was — and still is — a requirement for life. Williams believes the environmental transition caused a slow shift from the use of iron to magnesium for RNA binding, folding and catalysis.
Williams and Georgia Tech School of Chemistry and Biochemistry postdoctoral fellow Chiaolong Hsiao used a standard peroxidase assay to detect electron transfer in solutions of RNA and either the iron ion, Fe2+, or magnesium ion, Mg2+. For 10 different types of RNA, the researchers observed catalysis of single electron transfer in the presence of iron and absence of oxygen. They found that two of the most abundant and ancient types of RNA, the 23S ribosomal RNA and transfer RNA, catalyzed electron transfer more efficiently than other types of RNA. However, none of the RNA and magnesium solutions catalyzed single electron transfer in the oxygen-free environment.
“Our findings suggest that the catalytic competence of RNA may have been greater in early Earth conditions than in present conditions, and our experiments may have revived a latent function of RNA,” added Williams, who is also director of the RiboEvo Center.
This new study expands on research published in May 2012 in the journal PLoS ONE. In the previous work, Williams led a team that used experiments and numerical calculations to show that iron, in the absence of oxygen, could substitute for magnesium in RNA binding, folding and catalysis. The researchers found that RNA’s shape and folding structure remained the same and its functional activity increased when magnesium was replaced by iron in an oxygen-free environment.
In future studies, the researchers plan to investigate whether other unique functions may have been conferred on RNA through interaction with a variety of metals available on the early Earth.
In addition to Williams and Hsiao, Georgia Tech School of Biology professors Roger Wartell and Stephen Harvey, and Georgia Tech School of Chemistry and Biochemistry professor Nicholas Hud, also contributed to this work as co-principal investigators in the Ribo Evo Center at Georgia Tech.
This work was supported by NASA (Award No. NNA09DA78A).
Note : The above story is reprinted from materials provided by Georgia Institute of Technology, Research Communications. The original article was written by Abby Robinson.
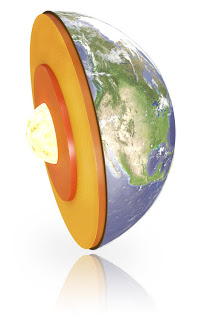
Researchers have used a diamond anvil cell to squeeze iron at pressures as high as 3 million times that felt at sea level to recreate conditions at the center of Earth. The findings could refine theories of how the planet and its core evolved.
Through laboratory experiments, postdoctoral researcher Arianna Gleason, left, and Wendy Mao, an assistant professor of geological and environmental sciences and of photon science, determined that the iron in Earth’s inner core is about 40 percent as strong as previously believed.
The massive ball of iron sitting at the center of Earth is not quite as “rock-solid” as has been thought, say two Stanford mineral physicists. By conducting experiments that simulate the immense pressures deep in the planet’s interior, the researchers determined that iron in Earth’s inner core is only about 40 percent as strong as previous studies estimated.
This is the first time scientists have been able to experimentally measure the effect of such intense pressure — as high as 3 million times the pressure Earth’s atmosphere exerts at sea level — in a laboratory. A paper presenting the results of their study is available online in Nature Geoscience.
“The strength of iron under these extreme pressures is startlingly weak,” said Arianna Gleason, a postdoctoral researcher in the department of Geological and Environmental Sciences, and lead author of the paper. Wendy Mao, an assistant professor in the department, is the co-author.
“This strength measurement can help us understand how the core deforms over long time scales, which influences how we think about Earth’s evolution and planetary evolution in general,” Gleason said.
Until now, almost all of what is known about Earth’s inner core came from studies tracking seismic waves as they travel from the surface of the planet through the interior. Those studies have shown that the travel time through the inner core isn’t the same in every direction, indicating that the inner core itself is not uniform. Over time and subjected to great pressure, the core has developed a sort of fabric as grains of iron elongate and align lengthwise in parallel formations.
The ease and speed with which iron grains in the inner core can deform and align would have influenced the evolution of the early Earth and development of the geomagnetic field. The field is generated by the circulation of liquid iron in the outer core around the solid inner core and shields Earth from the full intensity of solar radiation. Without the geomagnetic field, life — at least as we know it — would not be possible on Earth.
“The development of the inner core would certainly have some effect on the geomagnetic field, but just what effect and the magnitude of the effect, we can’t say,” said Mao. “That is very speculative.”
Gleason and Mao conducted their experiments using a diamond anvil cell — a device that can exert immense pressure on tiny samples clenched between two diamonds. They subjected minute amounts of pure iron to pressures between 200 and 300 gigapascals (equivalent to the pressure of 2 million to 3 million Earth atmospheres). Previous experimental studies were conducted in the range of only 10 gigapascals.
“We really pushed the limit here in terms of experimental conditions,” Gleason said. “Pioneering advancements in pressure-generation techniques and improvements in detector sensitivity, for example, used at large X-ray synchrotron facilities, such as Argonne National Lab, have allowed us to make these new measurements.”
In addition to intense pressures, the inner core also has extreme temperatures. The boundary between the inner and outer core has temperatures comparable to the surface of the sun. Simultaneously simulating both the pressure and temperature at the inner core isn’t yet possible in the laboratory, though Gleason and Mao are working on that for future studies. (For this study, Gleason mathematically extrapolated from their pressure data to factor in the effect of temperature.)
Gleason and Mao expect their findings will help other researchers set more realistic variables for conducting their own experiments.
“People modeling the inner core haven’t had many experimental constraints, because it’s so difficult to make measurements under those conditions,” Mao said. “There really weren’t constraints on how strong the core was, so this is really a fundamental new constraint.” Note : The above story is reprinted from materials provided by Stanford University. The original article was written by Louis Bergeron.
The Amazon River in South America is the second longest river in the world and by far the largest by waterflow with an average discharge greater than the next seven largest rivers combined (not including Madeira and Rio Negro, which are tributaries of the Amazon). The Amazon, which has the largest drainage basin in the world, about 7,050,000 square kilometres (2,720,000 sq mi), accounts for approximately one-fifth of the world’s total river flow.
In its upper stretches, above the confluence of the Rio Negro, the Amazon is called Solimões in Brazil; however, in Peru, Colombia and Ecuador, as well as the rest of the Spanish-speaking world, the river is generally called the Amazon downstream from the confluence of the Marañón and Ucayali rivers in Peru. The Ucayali-Apurímac river system is considered the main source of the Amazon, with as its main headstream the Carhuasanta glacial stream flowing off the Nevado Mismi mountain.
The width of the Amazon is between 1.6 and 10 kilometres (1.0 and 6.2 mi) at low stage but expands during the wet season to 48 kilometres (30 mi) or more. The river enters the Atlantic Ocean in a broad estuary about 240 kilometres (150 mi) wide. The mouth of the main stem is 80 kilometres (50 mi). Because of its vast dimensions, it is sometimes called The River Sea. The first bridge in the Amazon river system (over the Rio Negro) opened on 10 October 2010 near Manaus, Brazil.
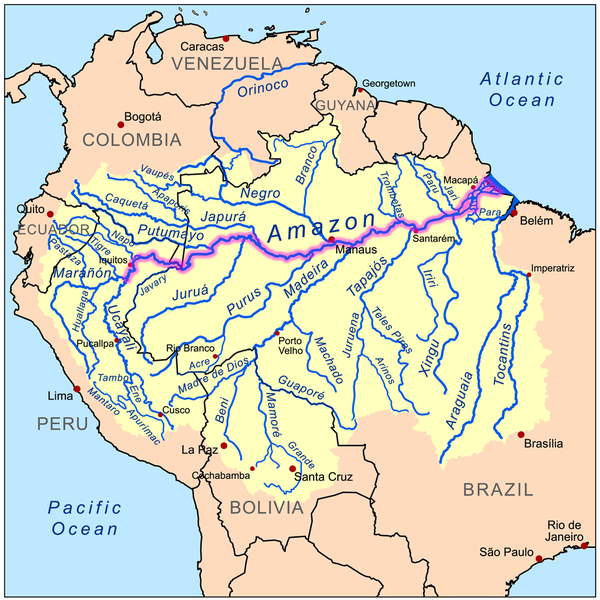
Drainage area
Map showing the Amazon drainage basin with the Amazon River highlighted
The Amazon Basin, the largest in the world, covers about 40% of South America, an area of approximately 7,050,000 square kilometres (2,720,000 sq mi). It drains from west to east, from Iquitos in Peru, across Brazil to the Atlantic. It gathers its waters from 5 degrees north latitude to 20 degrees south latitude. Its most remote sources are found on the inter-Andean plateau, just a short distance from the Pacific Ocean. The locals often refer to it as “El Jefe Negro”, referring to an ancient god of fertility.
The Amazon River and its tributaries are characterized by extensive forested areas that become flooded every rainy season. Every year the river rises more than 9 metres (30 ft), flooding the surrounding forests, known as várzea (“flooded forests”). The Amazon’s flooded forests are the most extensive example of this habitat type in the world. In an average dry season, 110,000 square kilometres (42,000 sq mi) of land are water-covered, while in the wet season, the flooded area of the Amazon Basin rises to 350,000 square kilometres (140,000 sq mi).
The quantity of water released by the Amazon to the Atlantic Ocean is enormous: up to 300,000 cubic metres per second (11,000,000 cu ft/s) in the rainy season, with an average of 209,000 cubic metres per second (7,400,000 cu ft/s) from 1973 to 1990. The Amazon is responsible for about 20% of the Earth’s fresh water entering the ocean. The river pushes a vast plume of fresh water into the ocean. The plume is about 400 kilometres (250 mi) long and between 100 and 200 kilometres (62 and 120 mi) wide. The fresh water, being lighter, flows on top of the seawater, diluting the salinity and altering the color of the ocean surface over an area up to 1,000,000 square miles (2,600,000 km2) in extent. For centuries ships have reported fresh water near the Amazon’s mouth yet well out of sight of land in what otherwise seemed to be the open ocean.
The Atlantic has sufficient wave and tidal energy to carry most of the Amazon’s sediments out to sea, thus the Amazon does not form a true delta. The great deltas of the world are all in relatively protected bodies of water, while the Amazon empties directly into the turbulent Atlantic.
There is a natural water union between the Amazon and the Orinoco basins, the so-called Casiquiare canal. The Casiquiare is a river distributary of the upper Orinoco, which flows southward into the Rio Negro, which in turn flows into the Amazon. The Casiquiare is the largest river on earth that links two major river systems, a so-called bifurcation.
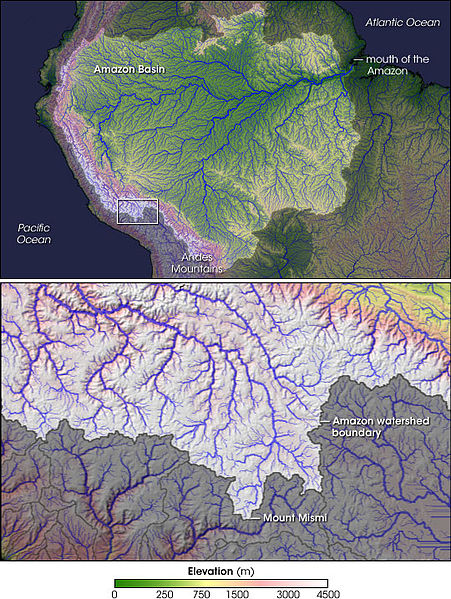
Origins
The Amazon river has a series of major river systems in Colombia, Ecuador and Peru, some of which flow
Source of the Amazon
into the Marañón and Ucayali, others directly into the Amazon proper. Among others, these include the following rivers: Putumayo, Caquetá, Vaupés, Guainía, Morona, Pastaza, Nucuray, Urituyacu, Chambira, Tigre, Nanay, Napo, and Huallaga.
The most distant source of the Amazon was established in 1996, 2001, 2007, and 2008, as a glacial stream on a snowcapped 5,597 m (18,363 ft) peak called Nevado Mismi in the Peruvian Andes, roughly 160 km (99 mi) west of Lake Titicaca and 700 km (430 mi) southeast of Lima. The waters from Nevado Mismi flow into the Quebradas Carhuasanta and Apacheta, which flow into the Río Apurímac which is a tributary of the Ucayali which later joins the Marañón to form the Amazon proper. While the Ucayali–Marañón confluence is the point at which most geographers place the beginning of the Amazon proper, in Brazil the river is known at this point as the Solimões das Águas. Further downriver from that confluence the darkly colored waters of the Rio Negro meet the sandy colored Rio Solimões, and for over 6 km (4 mi) these waters run side by side without mixing.
After the confluence of Apurímac and Ucayali, the river leaves Andean terrain and is surrounded by floodplain. From this point to the Marañón, some 1,600 km (990 mi), the forested banks are just out of water and are inundated long before the river attains its maximum flood stage. The low river banks are interrupted by only a few hills, and the river enters the enormous Amazon Rainforest.
The river systems and flood plains in Brazil, Peru, Ecuador, Colombia and Venezuela, whose waters drain into the Solimões and its tributaries are called the “Upper Amazon”. The Amazon River proper runs mostly through Brazil and Peru, it is part of the border between Colombia and Perú, and it has tributaries reaching into Venezuela, Colombia, Ecuador, and Bolivia.
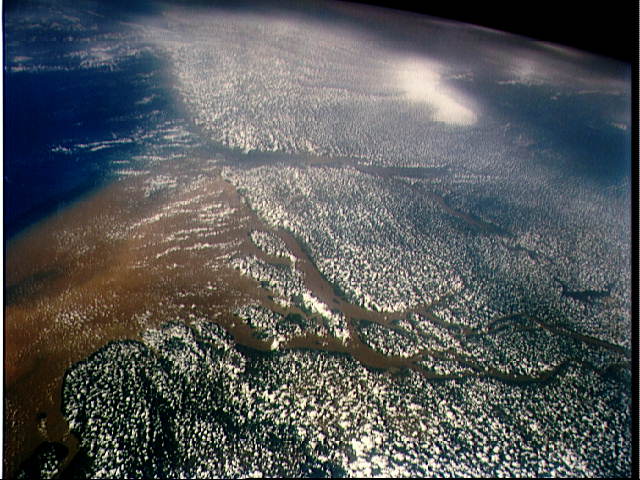
Flooding
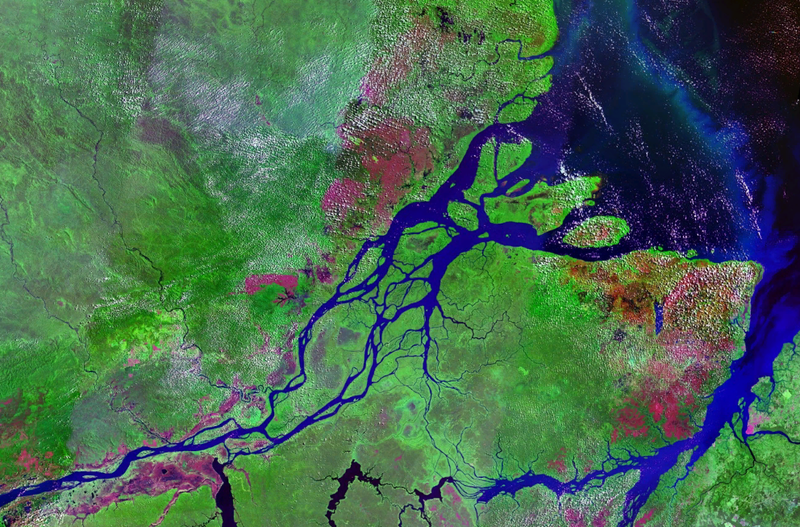
Not all of the Amazon’s tributaries flood at the same time of the year. Many branches begin flooding in
A NASA satellite image of a flooded portion of the river
November and may continue to rise until June. The rise of the Rio Negro starts in February or March and begins to recede in June. The Madeira River rises and falls two months earlier than most of the rest of the Amazon.
The average depth of the Amazon between Manacapuru and Óbidos has been calculated as between 20 to 26 metres (66 to 85 ft). At Manacapuru the Amazon’s water level is only about 24 metres (79 ft) above mean sea level. More than half of the water in the Amazon downstream of Manacapuru is below sea level. In its lowermost section the Amazon’s depth averages 20 to 50 metres (66 to 160 ft), in some places as much as 100 metres (330 ft).
The main river is navigable for large ocean steamers to Manaus, 1,500 kilometres (930 mi) upriver from the mouth. Smaller ocean vessels of 3,000 tons or 9,000 tons and 5.5 metres (18 ft) draft can reach as far as Iquitos, Peru, 3,600 kilometres (2,200 mi) from the sea. Smaller riverboats can reach 780 kilometres (480 mi) higher as far as Achual Point. Beyond that, small boats frequently ascend to the Pongo de Manseriche, just above Achual Point.
Geography
At some points the river divides into anabranches, or multiple channels, often very long, with inland and lateral channels, all connected by a complicated system of natural canals, cutting the low, flat igapó lands, which are never more than 5 metres (16 ft) above low river, into many islands.
From the town of Canaria at the great bend of the Amazon to the Negro, vast areas of land are submerged at high water, above which only the upper part of the trees of the sombre forests appear. Near the mouth of the Rio Negro to Serpa, nearly opposite the river Madeira, the banks of the Amazon are low, until approaching Manaus, they rise to become rolling hills. At Óbidos, a bluff 17 m (56 ft) above the river is backed by low hills. The lower Amazon seems to have once been a gulf of the Atlantic Ocean, the waters of which washed the cliffs near Óbidos.
Only about ten percent of the Amazon’s water enters downstream of Óbidos, very little of which is from the northern slope of the valley. The drainage area of the Amazon Basin above Óbidos city is about 5,000,000 square kilometres (1,900,000 sq mi), and, below, only about 1,000,000 square kilometres (390,000 sq mi) (around 20%), exclusive of the 1,400,000 square kilometres (540,000 sq mi) of the Tocantins basin. The Tocantins River enters the Amazon very close to its mouth.
In the lower reaches of the river, the north bank consists of a series of steep, table-topped hills extending for about 240 kilometres (150 mi) from opposite the mouth of the Xingu as far as Monte Alegre. These hills are cut down to a kind of terrace which lies between them and the river.
On the south bank, above the Xingu, a line of low bluffs bordering the floodplain extends nearly to Santarém in a series of gentle curves before they bend to the southwest, and, abutting upon the lower Tapajós, merge into the bluffs which form the terrace margin of the Tapajós river valley.
Mouth
The definition of where exactly the mouth of the Amazon is located, and how wide it is, is a matter of
A satellite image of the mouth of the Amazon River, looking south
dispute, because of the area’s peculiar geography. The Pará and the Amazon are connected by a series of river channels called furos near the town of Breves; between them lies Marajó, the world’s largest combined river/sea island.
If the Pará river and the Marajó island ocean frontage are included, the Amazon estuary is some 325 kilometres (202 mi) wide. In this case, the width of the mouth of the river is usually measured from Cabo Norte, the cape located straight east of Pracuúba in the Brazilian state of Amapá, to Ponta da Tijoca near the town of Curuçá, in the state of Pará.
A more conservative measurement excluding the Pará river estuary, from the mouth of the Araguari River to Ponta do Navio on the northern coast of Marajó, would still give the mouth of the Amazon a width of over 180 kilometres (110 mi). If only the river’s main channel is considered, between the islands of Curuá (state of Amapá) and Jurupari (state of Pará), the width falls to about 15 kilometres (9.3 mi).
Note : The above story is reprinted from materials provided by Wikipedia
Geosciences professor John Isbell (left) and postdoctoral researcher Erik Gulbranson look over some of the many samples they have brought back from Antarctica. The two are part of an international team of scientists investigating the last extreme climate shift on Earth, which occurred in the late Paleozoic Era. (Credit: Troye Fox)
What happened the last time a vegetated Earth shifted from an extremely cold climate to desert-like conditions? And what does it tell us about climate change today?
John Isbell is on a quest to coax that information from the geology of the southernmost portions of the Earth. It won’t be easy, because the last transition from “icehouse to greenhouse” occurred between 335 and 290 million years ago.
An expert in glaciation from the late Paleozoic Era, Isbell is challenging many assumptions about the way drastic climate change naturally unfolds. The research helps form the all-important baseline needed to predict what the added effects of human activity will bring.
Starting from ‘deep freeze’
In the late Paleozoic, the modern continents were fused together into two huge land masses, with what is now the Southern Hemisphere, including Antarctica, called Gondwana. During the span of more than 60 million years, Gondwana shifted from a state of deep freeze into one so hot and dry it supported the appearance of reptiles. The change, however, didn’t happen uniformly, Isbell says.
In fact, his research has shaken the common belief that Gondwana was covered by one massive sheet of ice which gradually and steadily melted away as conditions warmed. Isbell has found that at least 22 individual ice sheets were located in various places over the region. And the state of glaciation during the long warming period was marked by dramatic swings in temperature and atmospheric carbon dioxide (CO2) levels.
“There appears to be a direct association between low CO2 levels and glaciation,” he says. “A lot of the changes in greenhouse gases and in a shrinking ice volume then are similar to what we’re seeing today.”
When the ice finally started disappearing, he says, it did so in the polar regions first and lingered in other parts of Gondwana with higher elevations. He attributes that to different conditions across Gondwana, such as mountain-building events, which would have preserved glaciers longer.
All about the carbon
To get an accurate picture of the range of conditions in the late Paleozoic, Isbell has traveled to Antarctica 16 times and has joined colleagues from around the world as part of an interdisciplinary team funded by the National Science Foundation. They have regularly gone to places where no one has ever walked on the rocks before.
One of his colleagues is paleoecologist Erik Gulbranson, who studies plant communities from the tail end of the Paleozoic and how they evolved in concert with the climatic changes. The information contained in fossil soil and plants, he says, can reveal a lot about carbon cycling, which is so central for applying the work to climate change today.
Documenting the particulars of how the carbon cycle behaved so long ago will allow them to answer questions like, ‘What was the main force behind glaciation during the late Paleozoic? Was it mountain-building or climate change?’
Another characteristic of the late Paleozoic shift is that once the climate warmed significantly and atmospheric CO2 levels soared, the Earth’s climate remained hot and dry for another 200 million years.
“These natural cycles are very long, and that’s an important difference with what we’re seeing with the contemporary global climate change,” says Gulbranson. “Today, we’re seeing change in greenhouse gas concentrations of CO2 on the order of centuries and decades.”
Ancient trees and soil
In order to explain today’s accelerated warming, Gulbranson’s research illustrates that glaciers alone don’t tell the whole story.
Many environmental factors leave an imprint on the carbon contained in tree trunks from this period. One of the things Gulbranson hypothesizes from his research in Antarctica is that an increase in deciduous trees occurred in higher latitudes during the late Paleozoic, driven by higher temperatures.
What he doesn’t yet know is what the net effect was on the carbon cycle.
While trees soak in CO2 and give off oxygen, there are other environmental processes to consider, says Gulbranson. For example, CO2 emissions also come from soil as microbes speed up their consumption of organic matter with rising temperatures.
“The high latitudes today contain the largest amount of carbon locked up as organic material and permafrost soils on Earth today,” he says. “It actually exceeds the amount of carbon you can measure in the rain forests. So what happens to that stockpile of carbon when you warm it and grow a forest over it is completely unknown.”
Another unknown is whether the Northern Hemisphere during this time was also glaciated and warming. The pair are about to find out. With UWM backing, they will do field work in northeastern Russia this summer to study glacial deposits from the late Paleozoic.
The two scientists’ work is complementary. Dating the rock is essential to pinpointing the rate of change in the carbon cycle, which would be the warning signal we could use today to indicate that nature is becoming dangerously unbalanced.
“If we figure out what happened with the glaciers,” says Isbell, “and add it to what we know about other conditions — we will be able to unlock the answers to climate change.”
Note : The above story is reprinted from materials provided by University of Wisconsin-Milwaukee, via Newswise.
Chemical Formula: CaCO3 Locality: Common world wide. Name Origin: From the Latin, calx, meaning lime. System: Trigonal
Calcite is a carbonate mineral and the most stable polymorph of calcium carbonate (CaCO3). The Mohs scale of mineral hardness, based on scratch hardness comparison, defines value 3 as “calcite”.
Other polymorphs of calcium carbonate are the minerals aragonite and vaterite. Aragonite will change to calcite at 380–470 °C, and vaterite is even less stable.
Physical Properties of Calcite
Cleavage: {1011} Perfect, {1011} Perfect, {1011} Perfect Color: Colorless, White, Pink, Yellow, Brown. Density: 2.71 Diaphaneity: Transparent to translucent to opaque Fracture: Brittle – Conchoidal – Very brittle fracture producing small, conchoidal fragments. Hardness: 3 – Calcite Luminescence: Fluorescent and phosphorescent, Short UV=yellow, blue, red green, Long UV=yellow, blue, red green. Luster: Vitreous (Glassy) Streak: white
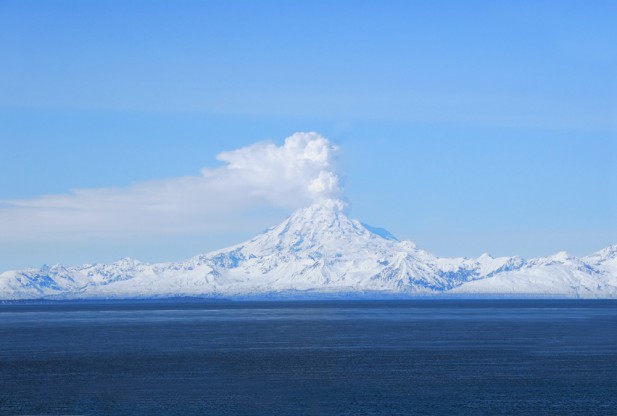
The Alaska Volcano Observatory has reported that the remote Pavlof Volcano continues to erupt and is now spewing lava, ash and steam 20,000 feet into the sky, which has been traveling southeast towards the Gulf of Alaska since Thursday.
The 8,000-foot volcano has been emitting a steady cloud of volcanic ash that now extends some 60 miles. The Alaskan volcano is located 625 miles southwest of Anchorage. Residents of Cold Bay, which is 37 miles away, have reported seeing a glow from the summit.
“Pavlof Volcano continues to erupt. Lava fountaining at the summit has been observed and photographed, and a continuous ash, steam, and gas cloud generated by the activity extends downwind from the volcano for 50 to 100 km at an altitude of about 20,000 ft above sea level,” AVO posted on its website.
“This morning the cloud was carried to the southeast. Satellite images show persistent elevated surface temperatures at the summit and on the northwest flank, commensurate with the summit lava fountaining and resulting lava flow. Seismic activity remains elevated with nearly continuous tremor recorded on the seismic network.”
On Thursday the Alaska Volcano Observatory noted that the current volcano alert level was at a “watch” stage while the current aviation color code was at “orange.” These are the indicators used by the US Geological Survey’s Volcano Hazards Program, which is used to track volcanic activity in the United States.
Along with another named Cleveland, Pavlof is one of two Alaskan volcanoes that are on “watch” status due to heightened activity. The orange indicator relates to how the rumblings could affect planes flying over the summit. There are four volcano alert levels that use the terms Normal, Advisory, Watch and Warning.
‘Normal’ indicates a typical background, non-eruptive state; ‘advisory’ indicates that the volcano may be exhibiting signs of elevated unrest above the known background level; ‘watch’ is for those volcanoes that are exhibiting heightened or escalating unrest, and which have an increased potential of eruption, or in which an eruption is underway but poses only limited hazards; and a ‘warning’ is for those occasions when a hazardous eruption is imminent, underway or suspected.
Pavlof has had nearly 40 known eruptions to date, making it the most active volcanoes in the Aleutian arc and “one of the most historically active volcanoes in the North Hemisphere,” USGS scientist John Powers told CNN. He added that Cleveland is also very active and had its last large eruption in 2001.
The USGS tracks 11 volcanoes. In addition to Cleveland and Pavlof, the Hawaiian volcano of Kilauea is also at a “Watch Orange” stage, while Pagan in the North Mariana Islands is at “Advisory Yellow.” Six other volcanoes are currently at “Normal Green,” while the Hawaiian Lo’ihi volcano remains unassigned.
Note : The above story is reprinted from materials provided by Peter Suciu for redOrbit
The Alaska Volcano Observatory (AVO) is a joint program of the United States Geological Survey (USGS), the Geophysical Institute of the University of Alaska Fairbanks (UAFGI), and the State of Alaska Division of Geological and Geophysical Surveys (ADGGS).
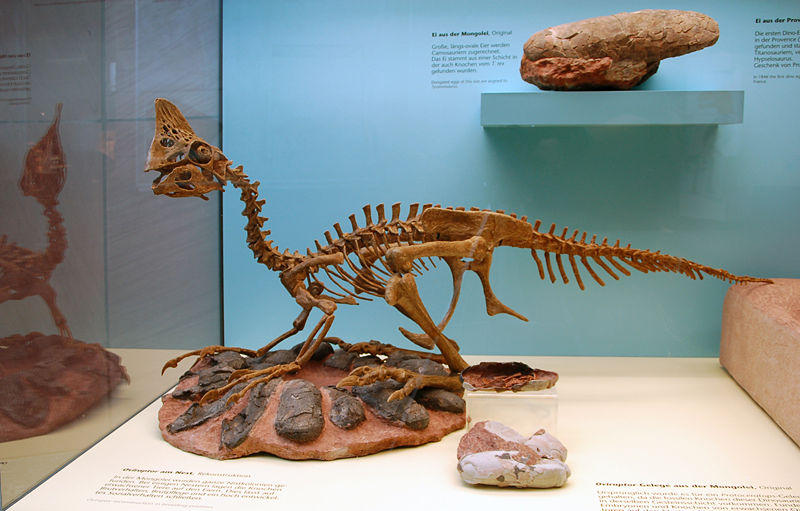
Oviraptorid skeleton and eggs in the Senckenberg Museum in Frankfurt am Main. (Credit: EvaK via Wikimedia Commons, Creative Commons license)
A study into the brooding behaviour of birds has revealed their dinosaur ancestors shared the load when it came to incubation of eggs.
Research into the incubation behaviour of birds suggests the type of parental care carried out by their long extinct ancestors.
The study aimed to test the hypothesis that data from extant birds could be used to predict the incubation behaviour of Theropods, the group of carnivorous dinosaurs from which birds descended.
The paper, out today in Biology Letters, was co-authored by Dr Charles Deeming and Dr Marcello Ruta from the University of Lincoln’s School of Life Sciences and Dr Geoff Birchard from George Mason University, Virginia.
By taking into account factors known to affect egg and clutch size in living bird species, the authors — who started their investigation last summer at the University of Lincoln’s Riseholme campus — found that shared incubation was the ancestral incubation behaviour. Previously it had been claimed that only male Theropod dinosaurs incubated the eggs.
Dr Deeming said: “In 2009 a study in the journal Science suggested that it was males of the small carnivorous dinosaurs Troodon and Oviraptor that incubated their eggs. Irrespective of whether you accept the idea of Theropod dinosaurs sitting on eggs like birds or not, the analysis raised some concerns that we wanted to address. We decided to repeat the study with a larger data set and a better understanding of bird biology because other palaeontologists were starting to use the original results in Science in order to predict the incubation behaviour of other dinosaur species. Our analysis of the relationship between female body mass and clutch mass was interesting in its own right but also showed that it was not possible to conclude anything about incubation in extinct distant relatives of the birds.”
Palaeobiologist Dr Ruta was involved in mapping the parental behaviour in modern birds on to an evolutionary tree.
Dr Ruta said: “As always in any study involving fossils, knowledge of extant organisms helps us make inferences about fossils. Fossils have a unique role in shaping our knowledge of the Tree of Life and the dynamics of evolutionary processes. However, as is the case with our study, data from living organisms may augment and refine the potential of fossil studies and may shift existing notions of the biology and behaviour of long extinct creatures.”
Dr Birchard added: “The previous study was carried out to infer the type of parental care in dinosaurs that are closely related to birds. That study proposed that paternal care was present in these dinosaurs and this form of care was the ancestral condition for birds. Our new analysis based on three times as many species as in the previous study indicates that parental care cannot be inferred from simple analyses of the relationship of body size to shape, anatomy, physiologyand behaviour. Such analyses ought to take into account factors such as shared evolutionary history and maturity at hatching. However, our data does suggest that the dinosaurs used in the previous study were likely to be quite mature at birth.”
The project has helped in understanding the factors affecting the evolution of incubation in birds. More importantly it is hoped that the new analysis will assist palaeontologists in their interpretation of future finds of dinosaur reproduction in the fossil record.
Note : The above story is reprinted from materials provided by University of Lincoln.
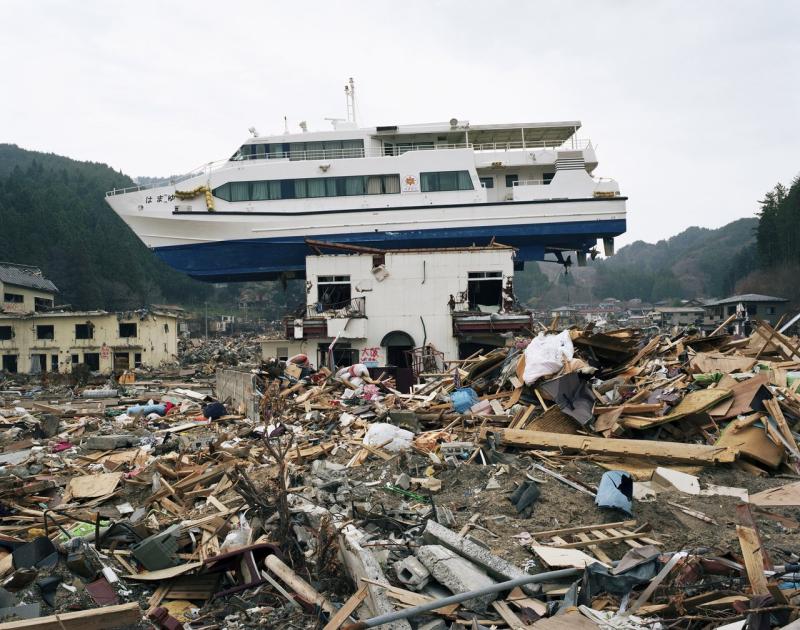
Boat dragged inland in Akahama, Japan by the 2011 tsunami. (Credit: Stephen Vaughan)
Researchers have shown that, by using global positioning systems (GPS) to measure ground deformation caused by a large underwater earthquake, they can provide accurate warning of the resulting tsunami in just a few minutes after the earthquake onset.
For the devastating Japan 2011 event, the team reveals that the analysis of the GPS data and issue of a detailed tsunami alert would have taken no more than three minutes.The results are published on 17 May in Natural Hazards and Earth System Sciences, an open access journal of the European Geosciences Union (EGU).
Most tsunamis, including those in offshore Sumatra, Indonesia in 2004 and Japan in 2011, occur following underwater ground motion in subduction zones, locations where a tectonic plate slips under another causing a large earthquake. To a lesser extent, the resulting uplift of the sea floor also affects coastal regions. There, researchers can measure the small ground deformation along the coast with GPS and use this to determine tsunami information.
“High-precision real-time processing and inversion of these data enable reconstruction of the earthquake source, described as slip at the subduction interface. This can be used to calculate the uplift of the sea floor, which in turn is used as initial condition for a tsunami model to predict arrival times and maximum wave heights at the coast,” says lead-author Andreas Hoechner from the German Research Centre for Geosciences (GFZ).
In the new Natural Hazards and Earth System Sciences paper, the researchers use the Japan 2011 tsunami, which hit the country’s northeast coast in less than half an hour and caused significant damage, as a case study. They show that their method could have provided detailed tsunami alert as soon as three minutes after the beginning of the earthquake that generated it.
“Japan has a very dense network of GPS stations, but these were not being used for tsunami early warning as of 2011. Certainly this is going to change soon,” states Hoechner.
The scientists used raw data from the Japanese GPS Earth Observation Network (GEONET) recorded a day before to a day after the 2011 earthquake. To shorten the time needed to provide a tsunami alert, they only used data from 50 GPS stations on the northeast coast of Japan, out of about 1200 GEONET stations available in the country.
At present, tsunami warning is based on seismological methods. However, within the time limit of 5 to 10 minutes, these traditional techniques tend to underestimate the earthquake magnitude of large events. Furthermore, they provide only limited information on the geometry of the tsunami source (see note). Both factors can lead to underprediction of wave heights and tsunami coastal impact. Hoechner and his team say their method does not suffer from the same problems and can provide fast, detailed and accurate tsunami alerts.
The next step is to see how the GPS solution works in practice in Japan or other areas prone to devastating tsunamis. As part of the GFZ-lead German Indonesian Tsunami Early Warning System project, several GPS stations were installed in Indonesia after the 2004 earthquake and tsunami near Sumatra, and are already providing valuable information for the warning system.
“The station density is not yet high enough for an independent tsunami early warning in Indonesia, since it is a requirement for this method that the stations be placed densely close to the area of possible earthquake sources, but more stations are being added,” says Hoechner.
Note
Traditional tsunami early warning methods use hypocentre (the point directly beneath the epicentre where the seismic fault begins to rupture) and magnitude only, meaning the source of the earthquake and tsunami is regarded as a point source. However, especially in the case of subduction earthquakes, it can have a large extension: in Japan in 2011 the connection between the tectonic plates broke on a length of about 400km and the Sumatra event in 2004 had a length of some 1500km. To get a good tsunami prediction, it is important to consider this extension and the spatial slip distribution.
Note : The above story is reprinted from materials provided by European Geosciences Union.
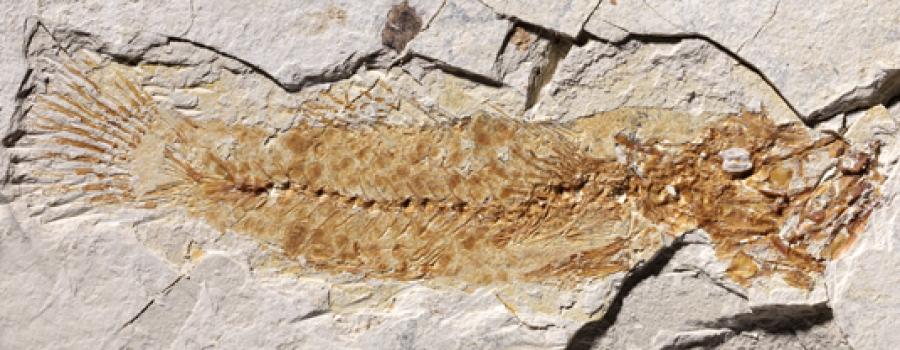
Osteology, scales and otolith of †Lepidocottus aries (Agassiz). (Credit: Christoph Gierl et al. An Extraordinary Gobioid Fish Fossil from Southern France. PLoS ONE, 2013; 8 (5): e64117 DOI: 10.1371/journal.pone.0064117)
Fish fossils that are about 23 million years old give unprecedented insight into the evolutionary history of the gobioid order, one of the most species-rich groups among the modern bony fishes.
Researchers led by paleontologist Professor Bettina Reichenbacher from the Division of Paleontology and Geobiology at the Department of Earth and Environmental Sciences at Ludwig-Maximilians-Universitaet (LMU) in Munich / Germany have completed a comprehensive analysis of fish fossils which they assign to the group of bony fishes that includes the gobies. Their results, which have just appeared in the journal PLOS ONE, provide new insights into the evolutionary history of these fish and also have implications for their taxonomy.
The fossil material examined is unusually well preserved. “This has allowed us to describe a gobioid fossil in greater detail than ever before,” says Reichenbacher. Indeed, the authors of the new study have been able to show that the fossil species concerned does not belong to the true gobies at all, in contrast to what earlier investigators had concluded. It is a member of an enigmatic family now known as the Butidae. Until very recently Butidae had been classified among the sleeper gobies. The family is now recognized as a separate clade, whose members are found in tropical river systems of Africa, Madagascar, Asia and Australia. Furthermore, no fossil specimens that could be attributed to this family have been identified until now. Indeed, datable gobioid fossils are comparatively rare in the fossil record. Since fossils of known age provide chronological markers of phylogeny, this has hampered understanding of the evolutionary history of this highly successful group of fishes.
The signature ear-stones
The new description published by the LMU team, in collaboration with a group of French researchers, is based on material that was discovered in the South of France and made available for study by the Cuvier Museum in Montbéliard. The specimens were excavated from sediments that had been laid down in a shallow lagoon near the coast of the Tethys Sea, the precursor of the modern Mediterranean, towards the end of the Oligocene epoch, around 23 million years ago. Among the many unusual features of the find is the fact that the otoliths (also known as ear-stones), which are small calcified particles that form part of the balance organs in the inner ear of bony fish, are perfectly preserved. Reichenbacher, who specializes in the analysis of fossil otoliths, explains the significance of this: “Otoliths are made up of the mineral aragonite, together with a minor fraction of organic material. What makes them of such interest for us is that they can be read like a genetic code. Otoliths allow us to deduce what sort of fish they belonged to, even if nothing else has survived,” she says. This is why the ear-stones play such a crucial role in studies of the paleontology, evolutionary history and biodiversity of the teleosts.
The otoliths revealed to the researchers that the fossils did not actually belong among the true gobies, but should be assigned to either the sleeper gobies or the butids. “Among the skeletal elements of the fossils, we then identified other traits that confirmed this assessment and enabled us to place the species among the butids,” says doctoral student Christoph Gierl, who analyzed the structural anatomy of the skull and the dorsal and pelvic fins.
This is the first butid fossil to be found anywhere. Interestingly, no members of the Butidae are found in European waters today. The new findings show that, back in the Oligocene, butids were distributed in estuaries and lagoons around the Tethys and the Paratethys (the remnant sea to the northeast that was cut off from the rest of the Tethys Sea, today’s Mediterranean, when the Alps were formed), which were then located in subtropical latitudes. The family vanished from these waters during the Early Miocene, about 22 million years ago. “They were probably displaced by true gobies that were more adaptable,” says Reichenbacher.
The researchers expect that their study will lead to a better picture of the evolutionary history of the gobioids as a whole. “Our results also demonstrate that otoliths can play a much greater role in the classification of gobioids than has previously been appreciated,” Bettina Reichenbacher concludes.
Note : The above story is reprinted from materials provided by Ludwig-Maximilians-Universitaet Muenchen (LMU).
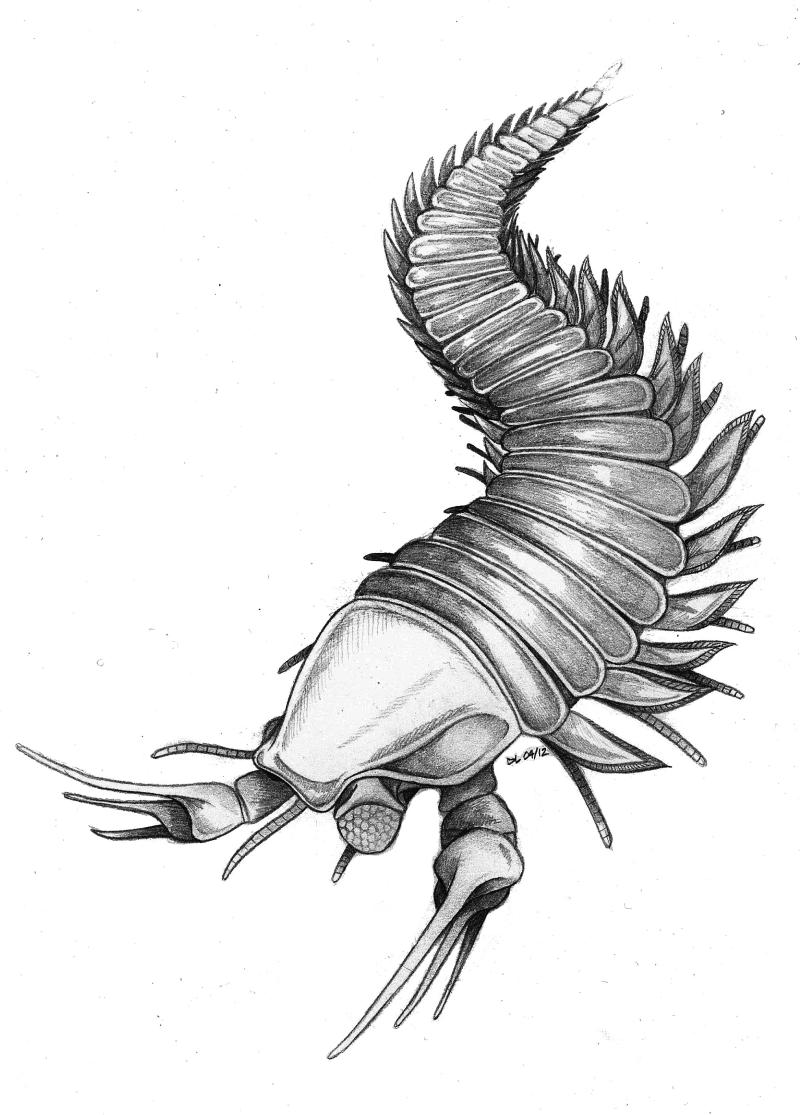
Kootenichela reconstruction. (Credit: Image courtesy of Imperial College London)
A scientist has discovered an ancient extinct creature with ‘scissor hand-like’ claws in fossil records and has named it in honour of his favourite movie star.
The 505 million year old fossil called Kooteninchela deppi (pronounced Koo-ten-ee-che-la depp-eye), which is a distant ancestor of lobsters and scorpions, was named after the actor Johnny Depp for his starring role as Edward Scissorhands — a movie about an artificial man named Edward, an unfinished creation, who has scissors for hands.
Kooteninchela deppi is helping researchers to piece together more information about life on Earth during the Cambrian period when nearly all modern animal types emerged.
David Legg, who carried out the research as part of his PhD in the Department of Earth Science and Engineering at Imperial College London, says:
“When I first saw the pair of isolated claws in the fossil records of this species I could not help but think of Edward Scissorhands. Even the genus name, Kootenichela, includes the reference to this film as ‘chela’ is Latin for claws or scissors. In truth, I am also a bit of a Depp fan and so what better way to honour the man than to immortalise him as an ancient creature that once roamed the sea?”
Kooteninchela deppi lived in very shallow seas, similar to modern coastal environments, off the cost of British Columbia in Canada, which was situated much closer to the equator 500 million years ago. The sea temperature would have been much hotter than it is today and although coral reefs had not yet been established, Kooteninchela deppi would have lived in a similar environment consisting of sponges.
The researcher believes that Kooteninchela deppi would have been a hunter or scavenger. Its large Edward Scissorhands-like claws with their elongated spines may have been used to capture prey, or they could have helped it to probe the sea floor looking for sea creatures hiding in sediment.
Kooteninchela deppi was approximately four centimetres long with an elongated trunk for a body and millipede-like legs, which it used to scuttle along the sea floor with the occasional short swim.
It also had large eyes composed of many lenses like the compound eyes of a fly. They were positioned on top of movable stalks called peduncles to help it more easily search for food and look out for predators.
The researcher discovered that Kooteninchela deppi belongs to a group known as the ‘great-appendage’ arthropods, or megacheirans, which refers to the enlarged pincer-like frontal claws that they share. The ‘great-appendage’ arthropods are an early relation of arthropods, which includes spiders, scorpions, centipedes, millipedes, insects and crabs.
David Legg adds: “Just imagine it: the prawns covered in mayonnaise in your sandwich, the spider climbing up your wall and even the fly that has been banging into your window and annoyingly flying into your face are all descendants of Kooteninchela deppi. Current estimates indicate that there are more than one million known insects and potentially 10 million more yet to be categorised, which potentially means that Kooteninchela Deppi has a huge family tree.”
In the future, David Legg intends to further his research and study fossilised creatures from the Ordovician, the geological period that saw the largest increase in diversity of species on the planet. He hopes to understand why this happened in order to learn more about the current diversity of species on Earth.
The research was published in the Journal of Palaeontology 2 May 2013.
Note : The above story is reprinted from materials provided by Imperial College London. The original article was written by Colin Smith.
For decades, scientists have used ancient shorelines to predict the stability of today’s largest ice sheets in Greenland and Antarctica. Markings of a high shoreline from three million years ago, for example — when Earth was going through a warm period — were thought to be evidence of a high sea level due to ice sheet collapse at that time.
This assumption has led many scientists to think that if the world’s largest ice sheets collapsed in the past, then they may do just the same in our modern, progressively warming world.However, a new groundbreaking study now challenges this thinking.
Using the east coast of the United States as their laboratory, a research team led by David Rowley, CIFAR Senior Fellow and professor at the University of Chicago, has found that Earth’s hot mantle pushed up segments of ancient shorelines over millions of years, making them appear higher now than they originally were millions of years ago.
“Our findings suggest that the previous connections scientists made between ancient shoreline height and ice volumes are erroneous and that perhaps our ice sheets were more stable in the past than we originally thought,” says Rowley. “Our study is telling scientists that they can no longer ignore the effect of Earth’s interior dynamics when predicting historic sea levels and ice volumes.”
The study, published online in Science on May 16, was a collaboration that included CIFAR Senior Fellows Alessandro Forte (Université du Québec à Montréal) and Jerry Mitrovica (Harvard), and a former CIFAR-supported post-doctoral fellow Rob Moucha (Syracuse).
“This study was the culmination of years of work and deep collaboration by researchers in CIFAR’s program in Earth System Evolution,” explains Rowley. “For this study, each of us brought our individual expertise to the table: Rob and Alex worked on simulations of Earth’s mantle dynamics, Jerry provided calculations on how glaciers warp Earth’s surface, and I shaped our understanding of the geology of the landscape we were looking at. This study would not have been possible without CIFAR.”
The team studied the coast from Virginia to Florida, which has an ancient scarp tens of metres above present-day sea level. Until now, many research groups have studied this shoreline and concluded that during a warm period three million years ago, the Greenland, West Antarctic and a fraction of East Antarctic ice sheets collapsed, raising the sea level at least 35 metres. But the new findings by Rowley and his team suggest that these ice sheets, particularly the East Antarctic Ice Sheet (the world’s largest), were probably more stable.
To do their study, the team used computer simulations to follow the movement of mantle and tectonic plates that occurred over time. Their prediction of how the ancient shoreline would have developed over millions of years matched what geologists mapping this ancient coast have observed. The next steps for the team are to try to make accurate predictions in other locations around the world.
“The paper is important because it shows that no prediction of ancient ice volumes can ever again ignore the Earth’s interior dynamics,” explains Rowley. “It also provides a novel bridge between two disciplines in Earth science that rarely intersect: mantle dynamics and long-term climate. It is the kind of study that changes how people think about our past climate and what our future holds.”
Note : The above story is reprinted from materials provided by Canadian Institute for Advanced Research.
International Chronostratigraphic Chart, latest version (January of 2013)
Click here (PDF or JPG) to download the latest version (January of 2013) of the International Chronostratigraphic Chart.
Translations of the chart: Chinese (v2013-01: PDF or JPG), Spanish (v2013-01), Portuguese (v2013-01: PDF or JPG), Norwegian (v2013-01: PDF or JPG), Basque (v2013-01: PDF or JPG), Catalan (v2013-01: PDF or JPG), French (v2012) and Japanese (v2012).
The old versions can be download at the following links: 2008 (PDF or JPG), 2009 (PDF or JPG), 2010 (PDF or JPG), 2012 (PDF or JPG).