Book Name : The Earth’s Magnetism “An Introduction for Geologists” Authors : – Prof. Dr. Roberto Lanza Dipartimento di Scienze della Terra Università di Torino – Dr. Antonio Meloni Istituto Nazionale di Geofisica e Vulcanologia
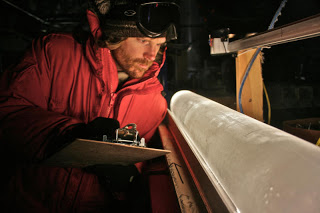
This ice core sample from West Antarctica provides information on historic temperatures recorded in that location. (Credit: Photo courtesy of Oregon State University)
Using data from 73 sites around the world, scientists have been able to reconstruct Earth’s temperature history back to the end of the last Ice Age, revealing that the planet today is warmer than it has been during 70 to 80 percent of the time over the last 11,300 years.
Of even more concern are projections of global temperature for the year 2100, when virtually every climate model evaluated by the Intergovernmental Panel on Climate Change (IPCC) shows that temperatures will exceed the warmest temperatures during that 11,300-year period known as the Holocene — under all plausible greenhouse gas emission scenarios.
Results of the study, by researchers at Oregon State University and Harvard University, were published this week in the journal Science. It was funded by the National Science Foundation’s Paleoclimate Program.
Lead author Shaun Marcott, a post-doctoral researcher in Oregon State’s College of Earth, Ocean, and Atmospheric Sciences, noted that previous research on past global temperature change has largely focused on the last 2,000 years. Extending the reconstruction of global temperatures back to the end of the last Ice Age puts today’s climate into a larger context.
“We already knew that on a global scale, Earth is warmer today than it was over much of the past 2,000 years,” Marcott said. “Now we know that it is warmer than most of the past 11,300 years. This is of particular interest because the Holocene spans the entire period of human civilization.”
Peter Clark, an OSU paleoclimatologist and co-author on the Science article, said many previous temperature reconstructions were regional in nature and were not placed in a global context. Marcott led the effort to combine data from 73 sites around the world, providing a much broader perspective.
“When you just look at one part of the world, the temperature history can be affected by regional climate processes like El Niño or monsoon variations,” noted Clark. “But when you combine the data from sites all around the world, you can average out those regional anomalies and get a clear sense of the Earth’s global temperature history.”
What that history shows, the researchers say, is that over the past 5,000 years, Earth on average cooled about 1.3 degrees (Fahrenheit) — until the past 100 years, when it warmed ̴ 1.3 degrees (F). The largest changes were in the northern hemisphere, where there are more land masses and greater human populations.
Climate models project that global temperature will rise another 2.0 to 11.5 degrees (F) by the end of this century, largely dependent on the magnitude of carbon emissions. “What is most troubling,” Clark said, “is that this warming will be significantly greater than at any time during the past 11,300 years.”
Marcott said that one of the natural factors affecting global temperatures over the past 11,300 years is gradual change in the distribution of solar insolation associated with Earth’s position relative to the sun.
“During the warmest period of the Holocene, the Earth was positioned such that Northern Hemisphere summers warmed more,” Marcott said. “As the Earth’s orientation changed, Northern Hemisphere summers became cooler, and we should now be near the bottom of this long-term cooling trend — but obviously, we are not.”
Clark said that other studies, including those outlined in past IPCC reports, have attributed the warming of the planet over the past 50 years to anthropogenic, or human-caused activities — and not solar variability or other natural causes.
“The last century stands out as the anomaly in this record of global temperature since the end of the last ice age,” said Candace Major, program director in the National Science Foundation’s Division of Ocean Sciences, which co-funded the research with NSF’s Division of Atmospheric and Geospace Sciences. “This research shows that we’ve experienced almost the same range of temperature change since the beginning of the industrial revolution as over the previous 11,000 years of Earth history — but this change happened a lot more quickly.”
The research team, which included Jeremy Shakun of Harvard University and Alan Mix of Oregon State, primarily used fossils from ocean sediment cores and terrestrial archives to reconstruct the temperature history. The chemical and physical characteristics of the fossils — including the species as well as their chemical composition and isotopic ratios — provide reliable proxy records for past temperatures by calibrating them to modern temperature records.
Using data from 73 sites around the world allows a global picture of Earth’s history and provides new context for climate change analysis.
“The Earth’s climate is complex and responds to multiple forcings, including CO2 and solar insolation,” Marcott said. “Both of those changed very slowly over the past 11,000 years. But in the last 100 years, the increase in CO2 through increased emissions from human activities has been significant. It is the only variable that can best explain the rapid increase in global temperatures.”
Note : The above story is reprinted from materials provided by Oregon State University.
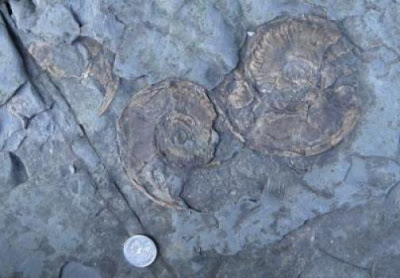
This shows Early Jurassic ammonite. (Credit: Plymouth University
The risk posed by global warming and rising ocean temperatures to the future health of the world’s marine ecosystem has been highlighted by scientists studying fossil records.
Researchers at Plymouth University believe that findings from fieldwork along the North Yorkshire coast reveal strong parallels between the Early Jurassic era of 180 million years ago and current climate predictions over the next century.
Through geology and palaeontology, they’ve shown how higher temperatures and lower oxygen levels caused drastic changes to marine communities, and that while the Jurassic seas eventually recovered from the effects of global warming, the marine ecosystems that returned were noticeably different from before.
The results of the Natural Environment Research Council-funded project are revealed for the first time in this month’s PLOS ONE scientific journal.
Professor Richard Twitchett, from the University’s School of Geography, Earth and Environmental Sciences, and a member of its Marine Institute, said: “Our study of fossil marine ecosystems shows that if global warming is severe enough and lasts long enough it may cause the extinction of marine life, which irreversibly changes the composition of marine ecosystems.”
Professor Twitchett, with Plymouth colleagues Dr Silvia Danise and Dr Marie-Emilie Clemence, undertook fieldwork between Whitby and Staithes, studying the different sedimentary rocks and the marine fossils they contained. This provided information about the environmental conditions on the sea floor at the time the rocks were laid down.
The researchers, working with Dr Crispin Little from the University of Leeds, were then able to correlate the ecological data with published data on changes in temperature, sea level and oxygen concentrations.
Dr Danise said: “Back in the laboratory, we broke down the samples and identified all of the fossils, recording their relative abundance much like a marine biologist would do when sampling a modern environment. Then we ran the ecological analyses to determine how the marine seafloor community changed through time.”
The team found a ‘dead zone’ recorded in the rock, which showed virtually no signs of life and contained no fossils. This was followed by evidence of a return to life, but with new species recorded.
Professor Twitchett added: “The results show in unprecedented detail how the fossil Jurassic communities changed dramatically in response to a rise in sea level and temperature and a decline in oxygen levels.
“Patterns of change suffered by these Jurassic ecosystems closely mirror the changes that happen when modern marine communities are exposed to declining levels of oxygen. Similar ecological stages can be recognised in the fossil and modern communities despite differences in the species present and the scale of the studies.”
The NERC project – ‘The evolution of modern marine ecosystems: environmental controls on their structure and function’ – runs until March 2015, and is one of four funded under their Coevolution of Life and the Planet research programme.
Note : The above story is reprinted from materials provided by University of Plymouth.
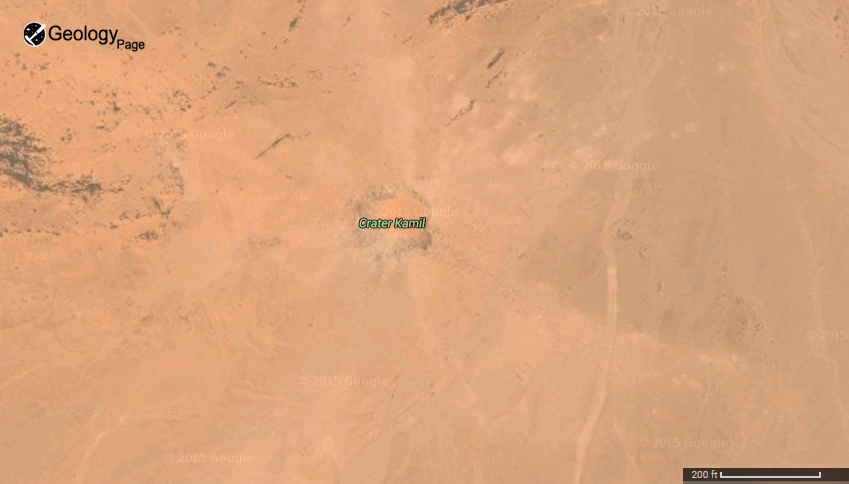
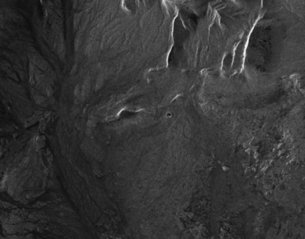
The impact crater 23 September 2010: A 2008 Google Earth search led to the discovery of Kamil crater, one of the best-preserved meteorite impact sites ever found. Earlier this year, a gritty, sand-blown expedition reached the site deep in the Egyptian desert to collect iron debris and determine the crater’s age and origins.
One day within the last several thousand years, a rare metallic meteorite travelling over 12 000 km/hour smashed into Earth’s surface near what is today the trackless border region between Egypt, Sudan and Libya. The impact of the 1.3 m, 10-tonne chunk of iron generated a fireball and plume that would have been visible over 1000 km away, and drilled a hole 16 m deep and 45 m wide into the rocky terrain.
Since then, the crater had sat undisturbed by Earth’s geologic and climatic processes, which usually render all but the very largest terrestrial impact craters invisible. It was also, as far as is recorded, unseen by humans
Searching for craters in Google Earth
But that changed in 2008, when the crater was spotted during a Google Earth study conducted by mineralologist Vincenzo De Michele, then with the Civico Museo di Storia Naturale in Milan, Italy. He was searching for natural features, when by chance he saw the rounded impact crater on his PC screen.
De Michele contacted an astrophysicist, Dr Mario Di Martino, at the INAF (National Institute for Astrophysics) observatory in Turin, who, together with Dr Luigi Folco, of Siena’s Museo Nazionale dell’Antartide, organised an expedition to the site in February this year.
It took over a year to plan and obtain permissions for the journey; in the meantime, and in collaboration with Telespazio, e-Geos and the Italian space agency ASI, the Kamil region was analysed using satellite data and in particular high-resolution radar images provided by the ASI-operated COSMO-SkyMed satellite constellation.
Expedition to the Egyptian desert
Kamil crater seen by satellite (small round dot near centre of image)
The two-week, 40-person expedition included Egyptian and Italian scientists, as well as numerous local support workers, and was conducted as part of the 2009 Italian-Egyptian Year of Science and Technology (EISY). It was also supported with funding by ESA’s Space Situational Awareness (SSA) programme.
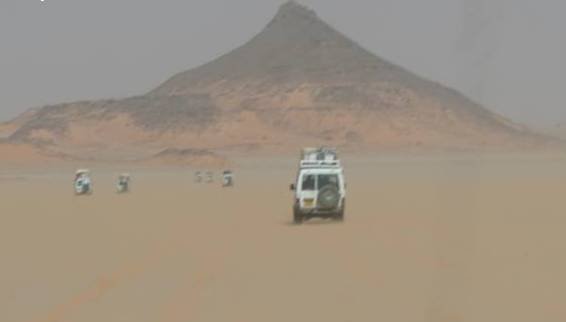
Three-day drive to reach Kamil crater
After a tiring, GPS-guided, three-day drive across the desert in 40°C heat, the team reached the crater.
Three-day drive to reach Kamil crater They collected over 1000 kg of metallic meteorite fragments, including one 83-kg chunk thought to have split from the main meteorite body shortly before impact (it was found 200 m away from the crater). The joint team also conducted a thorough geological and topographical survey, using ground-penetrating radar to create a 3D digital terrain model. Geomagnetic and seismic surveys were also carried out.
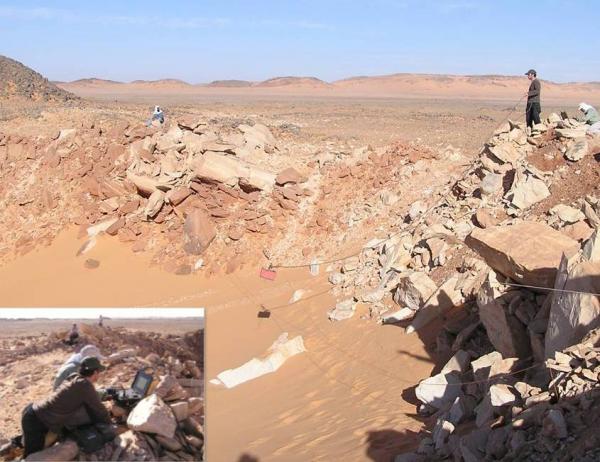
Ground truth for small-scale impact craters
Using ground-penetrating radar to study the impact crater. (Credit: L. Folco/The Kamillers)
The researchers were stunned to find that Kamil crater, named after a nearby rocky outcrop, remains pristine, and must have been created relatively recently.
“This demonstrates that metallic meteorites having a mass on the order of 10 tonnes do not break up in the atmosphere, and instead explode when they reach the ground and produce a crater,” says ESA’s Dr Detlef Koschny, Head of Near Earth Objects segment for the SSA programme.
Kamil crater has become the target of intense interest for geologists, astrophysicists and even archaeologists.
“We are still determining the geochronology of the impact site, but the crater is certainly less than ten thousand years old — and potentially less than a few thousand. The impact may even have been observed by humans, and archaeological investigations at nearby ancient settlements may help fix the date,” says Dr Folco.
The data gathered during the expedition will be very useful to ESA’s SSA activities for risk assessment of small asteroids with orbits that approach Earth, a category to which the Kamil impactor originally belonged.
Kamil Crater in Google Maps
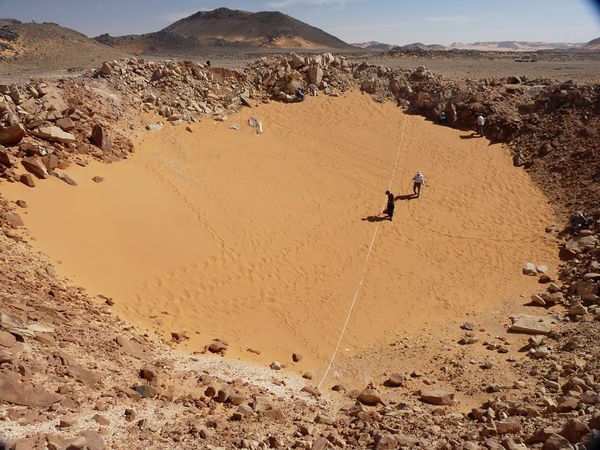
Photo:
Geophysicists work in the newfound Kamil crater in an undated picture. Photograph courtesy Museo Nazionale dell’Antartide Università di Siena
Note : The above story is reprinted from materials provided by European Space Agency.
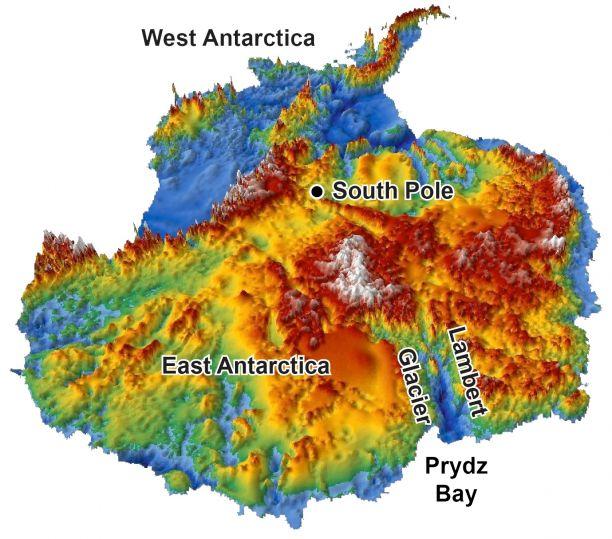
This 3-D reconstruction of the topography hidden under Antarctica’s two-mile-thick coating of ice was made using data from radar surveys. Glaciers started carving Antarctica into the current mountain-and-fjord landscape 34 million years ago, according to new findings from UA geoscientist Stuart N. Thomson and his colleagues. (Credit: Image courtesy of Stuart N. Thomson/UA department of geosciences
Antarctica’s topography began changing from flat to fjord-filled starting about 34 million years ago, according to a new report from a University of Arizona-led team of geoscientists.
Knowing when Antarctica’s topography started shifting from a flat landscape to one with glaciers, fjords and mountains is important for modeling how the Antarctic ice sheet affects global climate and sea-level rise.
Although radar surveys have revealed a rugged alpine landscape under Antarctica’s two-mile-thick ice sheet, the surveys tell nothing about when the continent’s deep valleys formed.
“We have worked out how the landscape under the ice has changed through time,” said lead author Stuart N. Thomson.
“People have speculated when the big fjords formed under the ice,” he said. “But no one knows for sure until you sample the rocks or the sediments.”
He and his colleagues sampled East Antarctica’s rocks by examining the sediments that built up off-shore for millions of years as rocks and dirt eroded off the continent into Prydz Bay.
“We use the sediments to trace what was happening under the ice in the past,” said Thomson, a research scientist in the UA department of geosciences.
The team found that between 250 and 34 million years ago, erosion from the region now covered by the huge Lambert Glacier was slow, suggesting the area was relatively flat and drained by slow-moving rivers.
About 34 million years ago, at the same time the climate shifted and Antarctica was becoming covered with ice, the rate of erosion more than doubled, Thomson said.
“The only way that could happen is from glaciers,” he said. “They started grinding and forming deep valleys.”
Co-author Peter W. Reiners, a UA professor of geosciences, said, “East Antarctica’s landscape changed dramatically when big glaciers appeared there.
“Glaciers can carve deep valleys quickly — and did so on Antarctica before it got so cold that the most of it got covered by one or two miles of thick, stationary ice.”
The team’s paper, “The contribution of glacial erosion to shaping the hidden landscape of East Antarctica,” is published in the March issue of Nature Geoscience.
Other co-authors are Sidney R. Hemming of Columbia University’s Lamont-Doherty Earth Observatory in Palisades, N.Y. and UA geoscientist George E. Gehrels. The National Science Foundation funded the research.
Geologists generally figure out a landscape’s history by hiking around to look at the area’s rocks and then toting some of them back to the lab for analysis.
“The trouble is, in Antarctica, 97 percent of the continent is covered in ice, and you can’t directly access the rocks,” Thomson said.
To reconstruct the history of East Antarctica’s landscape, he and his colleagues instead studied bits of Antarctic rocks from cores of sediment taken just offshore of the Lambert Glacier by the Ocean Drilling Program.
The team used 1,400 individual sand-sized grains of minerals from various locations throughout three different cores to figure out how quickly the surface of Antarctica had eroded at various times in the past.
Because other researchers had used microfossils to pinpoint when in geological time each layer of the core had been deposited, Thomson and his colleagues knew when each of those 1,400 samples had been washed from Antarctica’s surface into the sea.
To link a time in the landscape’s history to an erosion rate, geologists can use the “cooling age” of rocks. The cooling age tells how fast the rock was uncovered from a particular depth in the Earth.
As a rock is moved deeper into the Earth, it warms, and as it moves toward the surface of the Earth, it cools. A particular depth in the Earth corresponds to a particular temperature. Minerals in the rock, apatite and zircon, record when they were last at a certain depth/temperature.
For each of the 1,400 samples, Thomson and his UA colleagues used three independent dating techniques to see how fast the mineral grain was exposed by erosion. Thomson’s lab did the fission-track dating; Reiners’ lab did the uranium-thorium-helium dating; and Gehrels’ lab did the uranium-lead dating.
The different methods of analysis all point to the same answer.
Reiners said, “We can say when and in what way this mysterious sub-ice landscape changed and how. East Antarctica’s landscape changed dramatically when big glaciers appeared there.”
Knowing how the ice sheets changes in the past is important for predicting future changes in ice sheet growth, sea-level change and climate, Thomson said.
His next step is looking offshore in other regions of Antarctica to see if they show the same pattern.
Note : The above story is reprinted from materials provided by University of Arizona. The original article was written by Mari N. Jensen, College of Science.
Book Name : Hydrology Principles, Analysis and Design
Revised Second Edition By: H. M. Raghunath Publisher : New Age Books
Hydrology Principles Analysis Design About the Book:An attempt is made to place before students (degree and post-degree) and professionals in the fields of Civil and Agricultural Engineering, Geology and Earth Sciences, this important branch of Hydro science, i.e. Hydrology. It deals with all phases of the Hydrologic cycle and related topics in a lucid style and in metric system.There is a departure from empiricism, with emphasis on collection of hydrological data, processing and analysis of data, and hydrological design on sound principles and matured judgment.Large number of hydrological design problems are worked out at the end of each article, to illustrate the principles involved and the design procedure. Problems for assignment are given at the end of each chapter, along with objective type and intelligence questions.
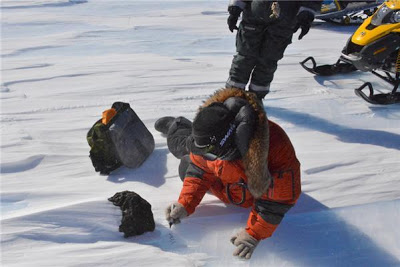
An international team of scientists, working at Princess Elisabeth Antarctica research station, have discovered a meteorite with a mass of 18kg embedded in the East Antarctic ice sheet, the largest such meteorite found in the region since 1988. (Credit: Image courtesy of International Polar Foundation)
An international team of scientists, working at Princess Elisabeth Antarctica research station, have discovered a meteorite with a mass of 18 kilograms embedded in the East Antarctic ice sheet, the largest such meteorite found in the region since 1988.
The eight members of the SAMBA project, from Université Libre de Bruxelles (ULB) and Vrije Universiteit Brussel (VUB), Japan’s National Institute of Polar Research (NIPR) and Tokyo University were searching for meteorites scattered across the Nansen Ice Field on January 28, when they found the 18kg ordinary chondrite. The team discovered a total of 425 meteorites, with a total weight of 75kg during the 40 day expedition, at an altitude of 2,900m, 140km south of Belgium’s Princess Elisabeth Antarctica research base.
“This meteorite was a very unexpected find for us, not only due to its weight, but because we don’t normally find such large meteorites in Antarctica,” said Vinciane Debaille, a geologist from Université Libre de Bruxelles, who led the Belgian part of the team during the expedition. “This is the biggest meteorite found in East Antarctica for 25 years, so it’s a very special discovery for us, only made possible by the existence and location of Princess Elisabeth Antarctica.”
The SAMBA project contributes to the US and Japan-led global collection of Antarctic meteorites, and is an initiative of VUB and ULB, in collaboration with the Japanese Institute of Polar Research. SAMBA is supported by the Belgian Science Policy (BELSPO) and the International Polar Foundation.
Initial field analysis by the scientists suggests that the 18kg meteorite is an ordinary chondrite, the most abundant kind of meteorite. The fusion crust — the meteorite’s outer casing — was eroded, allowing the scientists to inspect the rock underneath. The meteorite is currently undergoing a special thawing process in Japan — to ensure water doesn’t get inside the rock.
“We study meteorites in order to better understand how the solar system formed, how it evolved, how the Earth became such a unique planet in our solar system,” said Debaille. “This season’s SAMBA mission was a success both in terms of the number and weight of the meteorites we found. Two years ago, we found less than 10kg. This year, we found so much that we had to call the travel agency — because we had 75kg of meteorites to take home.”
Princess Elisabeth Antarctica is the world’s first zero emission polar research station, and is operated by the International Polar Foundation, in partnership with the Belgian Polar Secretariat. Princess Elisabeth Antarctica’s design and construction seamlessly integrates passive building technologies, renewable wind and solar energy, water treatment facilities, continuously monitored power demand and a smart grid for maximising energy efficiency. Located in East Antarctica’s Sør Rondane Mountains, Princess Elisabeth Antarctica welcomes scientists from around the world to conduct research in this little-studied and pristine environment.
Note : The above story is reprinted from materials provided by International Polar Foundation.
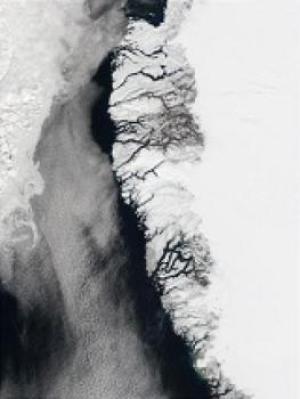
Image of southwest Greenland. (Credit: Jacques Descloitres, MODIS Land Rapid Response Team, courtesy of NASA Visible Earth)
Researchers still have much to learn about the volcanism that shaped our planet’s early history. New evidence from a team led by Carnegie’s Frances Jenner demonstrates that some of the tectonic processes driving volcanic activity, such as those taking place today, were occurring as early as 3.8 billion years ago. Their work is published in Geology.
Upwelling and melting of Earth’s mantle at mid-ocean ridges, as well as the eruption of new magmas on the seafloor, drive the continual production of the oceanic crust. As the oceanic crust moves away from the mid-ocean ridges and cools it becomes denser than the underlying mantle. Over time the majority of this oceanic crust sinks back into the mantle, which can trigger further volcanic eruptions. This process is known as subduction and it takes place at plate boundaries.
Volcanic eruptions that are triggered by subduction of oceanic crust are chemically distinct from those erupting at mid-ocean ridges and oceanic island chains, such as Hawaii. The differences between the chemistry of magmas produced at each of these tectonic settings provide ‘geochemical fingerprints’ that can be used to try to identify the types of tectonic activity taking place early in Earth’s history.
Previous geochemical studies have used similarities between modern subduction zone magmas and those erupted about 3.8 billion years ago, during the Eoarchean era, to argue that subduction-style tectonic activity was taking place early in Earth’s history. But no one was able to locate any suites of volcanic rocks with compositions comparable to modern mid-ocean ridge or oceanic island magmas that were older than 3 billion years and were also free from contamination by continental crust.
Because of this missing piece of the puzzle, it has been ambiguous whether the subduction-like compositions of volcanic rocks erupted 3.8 billion years ago really were generated at subduction zones, or whether this magmatism should be attributed to other processes taking place early in Earth’s history. Consequently, evidence for subduction-related tectonics earlier than 3 billion years ago has been highly debated in scientific literature.
Jenner and her team collected 3.8 billion-year-old volcanic rocks from Innersuartuut, an island in southwest Greenland, and found the samples have compositions comparable to modern oceanic islands, such as Hawaii.
“The Innersuartuut samples may represent the world’s oldest recognized suite of oceanic island basalts, free from contamination by continental crust,” Jenner said. “This evidence strengthens previous arguments that subduction of oceanic crust into the mantle has been taking place since at least 3.8 billion years ago.”
Note: The above story is reprinted from materials provided by Carnegie Institution.
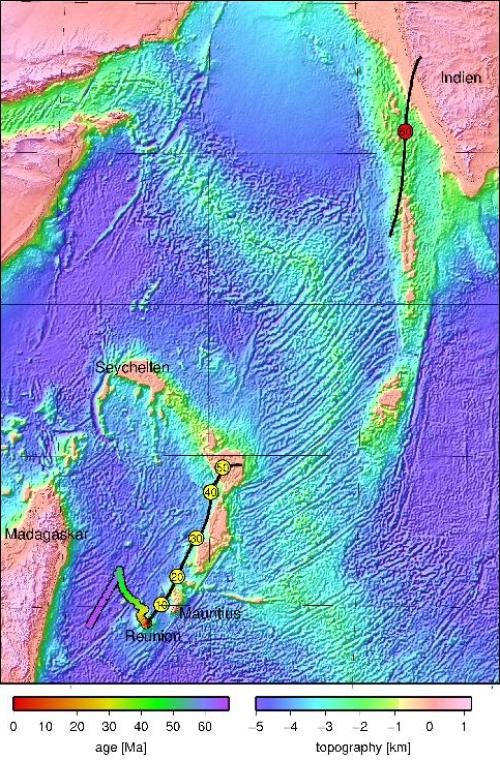
The islands Reunion and Mauritius, both well-known tourist destinations, are hiding a micro-continent, which has now been discovered. The continent fragment known as Mauritia detached about 60 million years ago while Madagascar and India drifted apart, and had been hidden under huge masses of lava.
Such micro-continents in the oceans seem to occur more frequently than previously thought, says a study in the latest issue of Nature Geoscience.
The break-up of continents is often associated with mantle plumes: These giant bubbles of hot rock rise from the deep mantle and soften the tectonic plates from below, until the plates break apart at the hotspots. This is how Eastern Gondwana broke apart about 170 million years ago. At first, one part was separated, which in turn fragmented into Madagascar, India, Australia and Antarctica, which then migrated to their present position.
Plumes currently situated underneath the islands Marion and Reunion appear to have played a role in the emergence of the Indian Ocean. If the zone of the rupture lies at the edge of a land mass (in this case Madagascar / India), fragments of this land mass may be separated off. The Seychelles are a well-known example of such a continental fragment.
A group of geoscientists from Norway, South Africa, Britain and Germany have now published a study that suggests, based on the study of lava sand grains from the beach of Mauritius, the existence of further fragments. The sand grains contain semi-precious zircons aged between 660 and 1970 million years, which is explained by the fact that the zircons were carried by the lava as it pushed through subjacent continental crust of this age.
This dating method was supplemented by a recalculation of plate tectonics, which explains exactly how and where the fragments ended up in the Indian Ocean. Dr. Bernhard Steinberger of the GFZ German Research Centre for Geosciences and Dr. Pavel Doubrovine of Oslo University calculated the hotspot trail: “On the one hand, it shows the position of the plates relative to the two hotspots at the time of the rupture, which points towards a causal relation,” says Steinberger. “On the other hand, we were able to show that the continent fragments continued to wander almost exactly over the Reunion plume, which explains how they were covered by volcanic rock.” So what was previously interpreted only as the trail of the Reunion hotspot, are continental fragments which were previously not recognized as such because they were covered by the volcanic rocks of the Reunion plume. It therefore appears that such micro-continents in the ocean occur more frequently than previously thought.
Note : The above story is reprinted from materials provided by Helmholtz Centre Potsdam – GFZ German Research Centre for Geosciences.
Surfer is a full-function 3D visualization, contouring and surface modeling package that runs under Microsoft Windows. Surfer is used extensively for terrain modeling, bathymetric modeling, landscape visualization, surface analysis, contour mapping, watershed and 3D surface mapping, gridding, volumetrics, and much more.
Surfer’s sophisticated interpolation engine transforms your XYZ data into publication-quality maps. Surfer provides more gridding methods and more control over gridding parameters, including customized variograms, than any other software package on the market. You can also use grid files obtained from other sources, such as USGS DEM files or ESRI grid files. Display your grid as outstanding contour, 3D surface, 3D wireframe, watershed, vector, image, shaded relief, and post maps. Add base maps and combine map types to create the most informative display possible. Virtually all aspects of your maps can be customized to produce exactly the presentation you want. Generating publication quality maps has never been quicker or easier.
What’s New in Surfer 11?
Create Watershed Maps
Include Feature Attributes
Use the Text Editor
Create Automatic Profiles
Perform Advanced Boundary Editing
Measure Distances and Areas
Grid Only Inside Your Data Limits
Use the Grid Node Editor Enhancements
More Resolution for Your Surface Map
Keep Your Layers Organized
More Classes for Your Classed Post Map
International Font Support
Reference Your Map
Set Symbol Line Color
Lock Your Objects
Convert Text Data to Numbers
Increased File Compatibility
New Coordinate Systems, Projections and Datums
More Surfer Features
Map Projections – Load maps in any map production, and covert between projections.
Contour Maps – Surfer software’s contour maps give you full control over all map parameters.
3D Surface Maps – The 3D surface map uses shading and color to emphasize your data features.
3D Wireframe Maps – Surfer wireframe maps provide an impressive three dimensional display of your data.
Vector Maps – Instantly create vector maps in Surfer to show direction and magnitude of data at points on a map.
Image Maps – Surfer image maps use different colors to represent elevations of a grid file.
Shaded Relief Maps – Surfer Shaded Relief maps create a shaded relief map from a grid [.GRD] file or USGS DEM file.
Post Maps – Post maps show X,Y locations with fixed size symbols or proportionally scaled symbols of any color.
Base Maps – Surfer can import maps in many different formats to display geographic information.
Map Overlays – Map overlays give you a way to combine any number of contour, wireframe, vector, base, and post maps.
Gridding – The gridding methods in Surfer allow you to produce accurate contour, surface, wireframe, vector, image, and shaded relief maps from your XYZ data.
Variogram modeling – Use the variogram modeling subsystem to quantitatively assess the spatial continuity of data.
Faults and Breaklines – Define faults and breaklines when gridding your data.
USGS Digital Elevation Model (DEM) Files – Use DEM files with any Surfer command that uses GRD files
Digitize Boundaries – Surfer makes it easy to digitize boundaries.
Automation – Virtually any operation that you can perform interactively can be controlled using an Automation-compatible programming language such as Visual Basic, C++, or Perl.
Worksheet – Surfer includes a full-featured worksheet for creating, opening, editing, and saving data files.
Object Manager – The object manager makes the editing of any object simple.
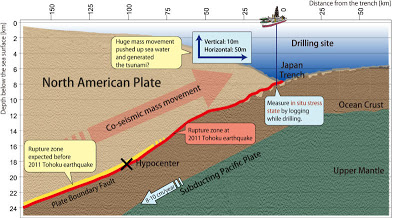
The 11 March 2011 Tohoku-Oki earthquake (Mw9.0) produced the largest slip ever recorded in an earthquake, over 50 meters. Such huge fault movement on the shallow portion of the megathrust boundary came as a surprise to seismologists because this portion of the subduction zone was not thought to be accumulating stress prior to the earthquake. In a recently published study, scientists from the Integrated Ocean Drilling Program (IODP) shed light on the stress state on the fault that controls the very large slip. The unexpectedly large fault displacements resulted in the devastating tsunamis that caused tremendous damage and loss of lives along the coast of Japan.
The study, published in 8 February 2013 issue of the journal Science, presents compelling evidence that large slips are the results of a complete stress drop during the earthquake. These new findings from IODP Japan Trench Fast Drilling Project (JFAST) research are relevant to better understanding earthquakes and tsunamis in many areas of the world.
“The study investigated the stress change associated with the 2011 Tohoku-Oki earthquake and tested the hypothesis by determining the in-situ stress state of the frontal prism from the drilled holes,” says a lead author Weiren Lin of Japan Agency for Marine-Earth Science and Technology (JAMSTEC). “We have established a new framework that the large slips in this region are an indication of coseismic fault zone and nearly the total stress accumulated was released during the earthquake.”
JFAST was designed and undertaken by the international scientific community to better understand the 2011 Tohoku-Oki earthquake. The expedition was carried out aboard the scientific drilling vessel Chikyu from April to July 2012. JFAST drill sites were located approximately 220 km from the eastern coast of Honshu, Japan, in nearly 7000 m of water.
“The project is looking at the stress and physical properties of the fault zone soon after a large earthquake,” co-author James Mori of Kyoto University, Co-Chief Scientist who led the JFAST expedition explains.
It is the first time that “rapid-response drilling” (within 13 months after the earthquake) has been attempted to measure the temperature across a subduction fault zone. The fast mobilization is necessary to observe time sensitive data, such as the temperature signal. JAMSTEC successfully mobilized a research expedition for IODP to investigate the large displacement by drilling from the ocean floor to the plate boundary, reaching a maximum depth of more than 850 m below seafloor (mbsf).
“Understanding the stress conditions that control the very large slip of this shallow portion of the megathrust may be the most important seismological issue for this earthquake.” Mori says.
The research published this week determined the stress field from breakouts observed in a borehole around 820 mbsf, in a region thought to contain the main slip zone of the 2011 earthquake. Lin and his co-authors analyzed a suite of borehole-logging data collected while drilling with Logging-While-Drilling (LWD) tools during IODP Expedition 343. Local compressive failures (borehole breakouts) are formed in the borehole wall during the drilling and are imaged with the LWD tools. The orientation and size of the breakouts are used to infer the present direction and magnitudes of the stress field. An important finding of the paper is that the present shear stress on the fault is nearly zero, indicating that there was a nearly complete stress change during the earthquake. Usually, earthquakes are thought to release only a portion of the stress on the fault.
“This was the first time for such nearly complete stress change has been recognized by direct measurement in drilling through the ruptured fault. This is the first time direct stress measurements have been reported, a little over a year after a great subduction zone earthquake.” Lin says.
The expedition set new milestones in scientific ocean drilling by drilling a borehole to 854.81 mbsf in water depths of 6897.5 meters. Deep core was obtained and analyzed from this depth. The Japan Trench plate boundary was sampled and a parallel borehole was instrumented with a borehole observatory system. The core samples and borehole observatory provide scientists with valuable opportunities to learn about residual heat, coseismic frictional stress, fluid and rock properties, and other factors related to megathrust earthquakes.
“We will be able to address very fundamental and important questions about the physics of slip of the thrust near the trench, and how to identify past events in the rock record.” says Frederick Chester, Texas A&M University, co-author of the Science report and the other expedition Co-Chief Scientist.
The expedition science party, comprising both ship-board and shore-based scientists, is conducting further investigations of core samples and borehole logging data. Data from the borehole observatory are expected to be retrieved later this month using the JAMSTEC ROV Kaiko7000II, and those data will be combined with the current results to continue to increase understanding of the processes involved in this large slip earthquake.
“We anticipate that the results from the JFAST expedition will provide us with a better understanding of the faulting mechanisms for this critical location,” says Mori. “Investigations and research findings from the expedition have obvious consequences for evaluating future tsunami hazards at other subduction zones around the world, such as the Nankai Trough in Japan and Cascadia in the Pacific of North America.”
Note : The above story is reprinted from materials provided by Integrated Ocean Drilling Program Management International.
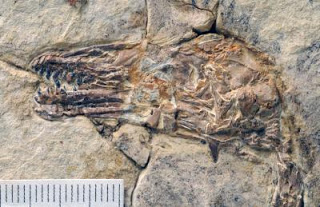
Photograph of Sulcavis geeorum skull, a fossil bird from the Early Cretaceous (120 million-years-ago) of Liaoning Province, China with scale bar in millimeters. (Credit: Photograph by Stephanie Abramowicz)
Beak shape variation in Darwin’s finches is a classic example of evolutionary adaptation, with beaks that vary widely in proportions and shape, reflecting a diversity of ecologies. While living birds have a beak to manipulate their food, their fossil bird ancestors had teeth. Now a new fossil discovery shows some fossil birds evolved teeth adapted for specialized diets.
A study of the teeth of a new species of early bird, Sulcavis geeorum, published in the latest issue of the Journal of Vertebrate Paleontology, suggests this fossil bird had a durophagous diet, meaning the bird’s teeth were capable of eating prey with hard exoskeletons like insects or crabs. The researchers believe the teeth of the new specimen greatly increase the known diversity of tooth shape in early birds, and hints at previously unrecognized ecological diversity.
Sulcavis geeorum is an enantiornithine bird from the Early Cretaceous (121-125 million years ago) of Liaoning Province, China. Enantiornithine birds are an early group of birds, and the most numerous birds from the Mesozoic (the time of the dinosaurs). Sulcavis is the first discovery of a bird with ornamented tooth enamel. The dinosaurs — from which birds evolved — are mostly characterized by carnivorous teeth with special features for eating meat. The enantiornithines are unique among birds in showing minimal tooth reduction and a diversity of dental patterns. This new enantiornithine has robust teeth with grooves on the inside surface, which likely strengthened the teeth against harder food items.
No previous bird species have preserved ridges, striations, serrated edges, or any other form of dental ornamentation. “While other birds were losing their teeth, enantiornithines were evolving new morphologies and dental specializations. We still don’t understand why enantiornithines were so successful in the Cretaceous but then died out — maybe differences in diet played a part.” says Jingmai O’Connor, lead author of the new study.
“This study highlights again how uneven the diversity of birds was during the Cretaceous. There are many more enantiornithines than any other group of early birds, each one with its own anatomical specialization.” offers study co-author Luis Chiappe, from Natural History Museum of Los Angeles County.
Note : The above story is reprinted from materials provided by Society of Vertebrate Paleontology.
This is an electron microscope image of a fossil Acacia flower from the study fossil site in Southern Australia. – Greg Jordan
Researchers have shown that part of Australia’s rich plant diversity was wiped out by the ice ages, proving that extinction, instead of evolution, influences biodiversity.
The research led by the University of Melbourne and University of Tasmania has shown that plant diversity in South East Australia was as rich as some of the most diverse places in the world, and that most of these species went extinct during the ice ages, probably about one million years ago.
The team’s work was published in the prestigious journal Proceedings of the National Academy of Sciences.
Dr Kale Sniderman of the University of Melbourne’s School of Earth Sciences said the findings show extinction is just as important to diversity of organisms as evolution.
“Traditionally scientists believed some places have more species than others because species evolved more rapidly in these places. We have overthrown this theory, which emphasizes evolution, by showing that extinction may be more important, ” he said.
The study compared two regions of Southern Australia and South Africa.
“South-western Australia has a huge diversity of tough-leaved shrubs and trees such as eucalypts, Banksia, Grevilleas and Acacias, making it one of the most biodiverse places on earth,” Dr Sniderman said.
“The southern tip of South Africa is even richer, with astonishing numbers of similar kinds of plants like proteas and ericas.”
Scientists have long maintained that this diversity is somehow related to the poor soils and dry summers of these places.
For the study researchers analysed plant fossils that accumulated in an ancient lake in South Eastern Australia. They found the region had at least as many tough-leaved plants 1.5 million years ago as Western Australia and South Africa do today.
The results were entirely unexpected.
“As Australia dried out over the past several million years, rainforest plants largely disappeared from most of the continent,” said Dr Sniderman
“It has been thought that this drying trend allowed Australia’s characteristic tough-leaved plants to expand and became more diverse. We have shown that the climate variability of the ice ages not only drove rainforest plants to extinction but also a remarkable number of tough-leaved, shrubby plants,” he said.
Dr Greg Jordan of the School of Plant Sciences at the University of Tasmanian said not only has the study overturned current thought on the role of extinction in plant diversity, it has implications for understanding how Australian plant diversity will deal with current and future climate change.
“The species that went extinct in SE Australia during the ice ages were likely to be the ones most sensitive to rapid climate change, meaning that the species that now grow in eastern Australia may be more capable of tolerating rapid changes than predicted by current science,” he said.
“However, the species in hotspots of diversity like Western Australia may be much more sensitive to future climate change, because they have been protected from past climate changes.”
Note: This story has been adapted from a news release issued by the University of Melbourne
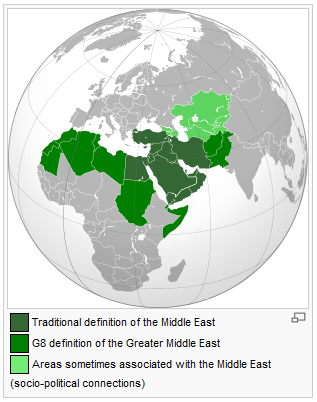
From Wikipedia Already strained by water scarcity and political tensions, the arid Middle East along the Tigris and Euphrates rivers is losing critical water reserves at a rapid pace, from Turkey upstream to Syria, Iran and Iraq below.
Unable to conduct measurements on the ground in the politically unstable region, UC Irvine scientists and colleagues used data from space to uncover the extent of the problem. They took measurements from NASA’s Gravity Recovery and Climate Experiment satellites, and found that between 2003 and 2010, the four nations lost 144 cubic kilometers (117 million acre feet) of water — nearly equivalent to all the water in the Dead Sea. The depletion was especially striking after a drought struck the area in 2007. Researchers attribute the bulk of it — about 60 percent — to pumping of water from underground reservoirs.
They concluded that the Tigris-Euphrates watershed is drying up at a pace second only to that in India. “This rate is among the largest liquid freshwater losses on the continents,” the scientists report in a paper to be published online Feb. 15 in Water Resources Research, a journal of the American Geophysical Union.
Water management is a complex issue in the Middle East, “a region that is dealing with limited water resources and competing stakeholders,” said Katalyn Voss, lead author and a water policy fellow with the University of California’s Center for Hydrologic Modeling in Irvine.
Turkey has jurisdiction over the Tigris and Euphrates headwaters, as well as the reservoirs and infrastructure of its Southeastern Anatolia Project, which dictates how much water flows downstream into Syria, Iran and Iraq. And due to varied interpretations of international laws, the basin does not have coordinated water management. Turkey’s control of water distribution to adjacent countries has caused tension, such as during the 2007 drought, when it continued to divert water to irrigate its own agricultural land.
“That decline in stream flow put a lot of pressure on downstream neighbors,” Voss said. “Both the United Nations and anecdotal reports from area residents note that once stream flow declined, the northern part of Iraq had to switch to groundwater. In a fragile social, economic and political environment, this did not help.”
The Gravity Recovery and Climate Experiment, which NASA launched in 2002 to measure Earth’s local gravitation pull from space, is providing a vital picture of global trends in water storage, said hydrologist Jay Famiglietti, the study’s principal investigator and a UC Irvine professor of Earth system science.
GRACE is “like having a giant scale in the sky,” he said. “Whenever you do international work, it’s exceedingly difficult to obtain data from different countries. For political, economic or security reasons, neighbors don’t want each other to know how much water they’re using. In regions like the Middle East, where data are relatively inaccessible, satellite observations are among the few options.”
Rising or falling water reserves alter Earth’s mass in particular areas, influencing the strength of the local gravitational attraction. By periodically quantifying that gravity, the satellites provide information about how much each region’s water storage changes over time.
The 754,000-square-kilometer (291,000-square-mile) Tigris-Euphrates River Basin jumped out as a hot spot when researchers from UC Irvine, NASA’s Goddard Space Flight Center and the National Center for Atmospheric Research looked at global water trends. Over the seven-year period, they calculated that available water there shrank by an average of 20 cubic kilometers (16 million acre feet) annually.
Meanwhile, the area’s demand for freshwater is rising at the worst possible time. “They just do not have that much water to begin with, and they’re in a part of the world that will be experiencing less rainfall with climate change. Those dry areas are getting drier,” Famiglietti said. “Everyone in the world’s arid regions needs to manage their available water resources as best they can.”
Other authors are MinHui Lo of National Taiwan University, Caroline de Linage of the University of California’s Center for Hydrologic Modeling, Matthew Rodell of NASA’s Goddard Space Flight Center, and Sean Swenson of the National Center for Atmospheric Research.
Note : The above story is reprinted from materials provided by University of California – Irvine.
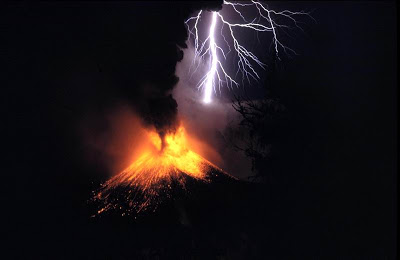
A small eruption of Mount Rinjani, with volcanic lightning. Location: Lombok, Indonesia
It has long been known that volcanic activity can cause short-term variations in climate. Now, researchers at the GEOMAR Helmholtz Centre for Ocean Research Kiel (Germany), together with colleagues from Harvard University (Cambridge, Massachusetts, USA) have found evidence that the reverse process also occurs: Climate affects volcanic activity.
Their study is now online in the international journal Geology.
In 1991, it was a disaster for the villages nearby the erupting Philippine volcano Pinatubo. But the effects were felt even as far away as Europe. The volcano threw up many tons of ash and other particles into the atmosphere causing less sunlight than usual to reach Earth’s surface. For the first few years after the eruption, global temperatures dropped by half a degree. In general, volcanic eruptions can have a strong short-term impact on climate. Conversely, the idea that climate may also affect volcanic eruptions on a global scale and over long periods of time is completely new. Researchers at GEOMAR Helmholtz Centre for Ocean Research Kiel (Germany) and Harvard University in Massachusetts (USA) have now found strong evidence for this relationship from major volcanic eruptions around the Pacific Ocean over the past 1 million years. They have presented their results in the latest issue of the international journal “Geology.”
The basic evidence for the discovery came from the work of the Collaborative Research Centre “Fluids and Volatiles in Subduction Zones (SFB 574). For more than ten years the project has been extensively exploring volcanoes of Central America. “Among others pieces of evidence, we have observations of ash layers in the seabed and have reconstructed the history of volcanic eruptions for the past 460,000 years,” says GEOMAR volcanologist Dr Steffen Kutterolf, who has been with SFB 574 since its founding. Particular patterns started to appear. “There were periods when we found significantly more large eruptions than in others” says Kutterolf, the lead author of the Geology article.After comparing these patterns with the climate history, there was an amazing match. The periods of high volcanic activity followed fast, global temperature increases and associated rapid ice melting.
To expand the scope of the discoveries, Dr Kutterolf and his colleagues studied other cores from the entire Pacific region. These cores had been collected as part of the International Integrated Ocean Drilling Program (IODP) and its predecessor programmes. They record more than a million years of Earth’s history. “In fact, we found the same pattern from these cores as in Central America” says geophysicist Dr Marion Jegen from GEOMAR, who also participated in the recent study.Together with colleagues at Harvard University, the geologists and geophysicists searched for a possible explanation. They found it with the help of geological computer models. “In times of global warming, the glaciers are melting on the continents relatively quickly. At the same time the sea level rises. The weight on the continents decreases, while the weight on the oceanic tectonic plates increases. Thus, the stress changes within in the Earth to open more routes for ascending magma” says Dr Jegen.
The rate of global cooling at the end of the warm phases is much slower, so there are less dramatic stress changes during these times. “If you follow the natural climate cycles, we are currently at the end of a really warm phase. Therefore, things are volcanically quieter now. The impact from human-made warming is still unclear based on our current understanding” says Dr Kutterolf. The next step is to investigate shorter-term historical variations to better understand implications for the present day.
Reference:
S. Kutterolf, M. Jegen, J. X. Mitrovica, T. Kwasnitschka, A. Freundt, P. J. Huybers. A detection of Milankovitch frequencies in global volcanic activity. Geology, 2012; DOI: 10.1130/G33419.1
Note : The above story is reprinted from materials provided by Helmholtz Centre for Ocean Research Kiel (GEOMAR)
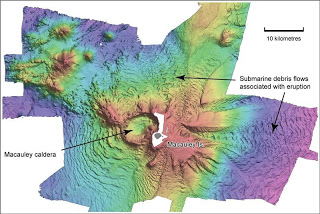
Macauley volcano. (Credit: Courtesy of National Oceanography Centre & National Institute of Water and Atmospheric Research)
Scientists based in the UK and New Zealand have described a “new” type of volcanic eruption.
Volcanic eruptions are commonly categorised as either explosive or effusive. But now, in research published this month in Nature Geoscience, researchers at Victoria University, Wellington and the National Oceanography Centre in Southampton have uncovered a previously undocumented type of eruption in underwater volcanoes — by looking at tiny original bubble spaces trapped in volcanic rock.
Inside volcanoes, gases are dissolved in the molten magma as a function of the very high pressures and chemistry of the magma. In the same way that gases dissolved in carbonated drinks bubble up when you take the lid off, when magma is erupted as lava, the pressure is relieved and the gases exsolve to form small gas bubbles or so-called “vesicles.” In explosive eruptions these vesicles expand so quickly they fragment the magma, violently ejecting lava, which cools and degasses to form solidified pumice that can be sufficiently light to float on water.
In air pumice is obviously associated with violent, explosive eruptions. Consequently underwater volcanoes flanked by highly vesicular pumice have, to date, also been interpreted as having erupted explosively.
But the results of this study indicate that there is a third eruptive style unique to underwater volcanoes, which is neither effusive nor explosive.
“By documenting the shape and density of bubbles in pumices generated by an underwater caldera volcano in the southwest Pacific Ocean — the Macauley volcano — we found large differences in the number and shape of “bubbles” in the same pebble-sized samples, different to anything previously documented,” said Professor Ian Wright of the National Oceanography Centre, who co-authored the paper.
“This range of bubble densities distinct in these pumice samples indicates that the lava erupting from the caldera was neither vigorous enough for an explosive eruption, nor gentle enough for an effusive flow.”
The study proposes that rather than exploding in the neck of the volcano, the formation and expansion of bubbles in the magma created a buoyant foam, which rose to the seafloor and then buoyantly detached from the volcano as molten pumice balloons but with chilled margins. During its ascent to the sea surface, the vesicles within the molten interior would have continued to expand as the pressure — this time from the weight of the seawater — reduced.
“These processes explain the unique bubble structure seen in the samples analysed, which could have only occurred with an intermediate eruption style and in an underwater setting,” said Professor Wright.
“We conclude that the presence of widespread deposits of pumice on underwater volcanoes does not necessarily indicate large-scale explosive volcanism.”
The authors proposed that this style of eruption be named Tangaroan, the Maori god of the sea, and name of the research vessel used to collect the samples.
The study was led by Melissa Rotella, Professor Colin Wilson and Simon Barker from the School of Geography, Environment and Earth Sciences at the Victoria University of Wellington, New Zealand.
Note : The above story is reprinted from materials provided by National Oceanography Centre.
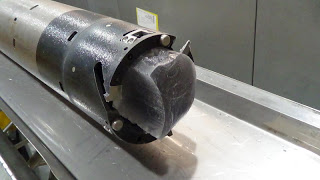
This chunk of ice has made history. A National Science Foundation-funded Replicate Core Drilling Team was able to retrieve cylinders of ice from the original ice core hole while leaving the borehole intact. (Credit: Image courtesy of South Dakota State University)
Studying Ice Cores from West Antarctica for Clues as to Why the Earth Began to Emerge from the Ice Age
A slice of ice from 17,500 years ago can help scientists figure out how Earth came out of the Ice Age and how climate change can happen in the future, according to South Dakota State University Professor Jihong Cole-Dai of the chemistry and biochemistry department. He and graduate student, Kari Peterson, spent nearly a month in Antarctica during Christmas break as part of the West Antarctica Ice Sheet Divide Ice Core project.
The main goal of the ice core project, Cole-Dai said “was to get an ice core more than two miles deep to give us nearly 70,000 years of history of the Earth’s climate.”
The National Science Foundation-funded project, which began eight years ago, involves more than 20 universities and national laboratories. The SDSU Ice Core and Environment Chemistry Lab, headed by Cole-Dai, has been a part of the project since 2006.
It took eight years to build the field camp and to collect the original ice core, because the harsh Antarctica conditions allow only a 60-day window each year in which to work. That task was completed in January 2012.
“This year was significant because of the completion of additional field work,” Cole-Dai said. Scientists wanted more ice to do further work on specific time periods. To do so, the team retrieved additional ice from five spots along the original ice core hole, while also leaving the lower portion of the hole intact.
“That in itself was quite a challenge and accomplishment,” Cole-Dai said. His former postdoctoral researcher, David Ferris, was part of the drilling team. Ferris became part of the project through the SDSU Ice Core and Environment Chemistry Lab during his doctoral work.
To accomplish this task, engineers had to design a special bit and drilling apparatus that used an actuator to push off to the side of the original borehole, explained Tony Wendricks, project coordinator for the Ice Drilling Design and Operations group at the University of Wisconsin, Madison. Ferris has worked on ice drilling team for three years and on the core handling team for one year.
“It’s a tricky thing — to maintain the parent hole,” Wendricks said.
“It’s never been done anywhere in the world,” Cole-Dai said. “You have a tool hanging at the end of a two-mile-long rope or cable and you want it to do very precise things, to move one degree in the direction you want and to bring the ice out.”
When the drillers brought up cylinders of ice, they handed them over to the core-processing team, Cole-Dai said. He and Peterson were on the team that took measurements and logged the information regarding the cores from the designated time periods. Then they packaged the ice cylinders to transport to the National Ice Core Laboratory in Denver.
Once the cores have been processed in Denver, each university lab will get its slice of the ice for analysis, which will likely take a year, Cole-Dai said. His SDSU team will work on a section of ice from 17,500 years ago that offers clues as to why Earth began to emerge from the Ice Age.
At that point in history, Cole-Dai said, “something big happened — a large volcanic eruption or a number of them.” Others speculate that it might have been an object from outer space that struck Earth.
“We want to gather more information from the ice and hopefully it will lead to better ideas, or support some of the ideas and disprove some of the others,” Cole-Dai said.
For this research, Cole-Dai’s team collaborates with a lab at the University of California, San Diego. SDSU analyzes the trace chemicals, while the California lab does the isotope measurements. Cole-Dai has three doctoral students working in his lab; two of them have been to Antarctica.
Researchers found fluoride, which is commonly associated with a volcanic eruption, in a previous ice core, explained Peterson. However, the levels were higher than those expected from an eruption. For her dissertation, Peterson will analyze the fluoride levels in the replicate core to confirm the original results.
In addition, Peterson took samples from a snow pit more than eight feet deep to look for signs of two volcanic eruptions a couple of years ago, one in Indonesia and one in Africa. “The eruptions were pretty small but very powerful,” Peterson said, “so the plume may have gotten into the stratosphere.”
When this happens, Cole-Dai explained, the wind patterns can carry the volcanic material to the entire world, including both poles. Because the snow at the Western Antarctica drill site never melts, the ice contains a history of the changing atmospheric environment and of the dynamic climate. As for the location to drill the ice core in the center of West Antarctica, Cole-Dai explained, “It’s like the continental divide. Ice flows away from this point; it doesn’t get ice from other locations.”
By measuring the kinds and quantities of chemicals in the ice cores and determining how those change over time, scientists can study the events that lead to global climate change, Cole-Dai said. This will lead to a better understanding of how human activities can influence climate. By studying Earth’s past, Cole-Dai said, “we can better predict the future.”
Note : The above story is reprinted from materials provided by South Dakota State University.
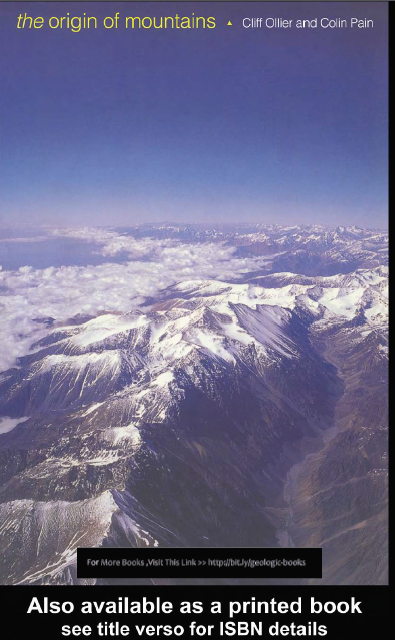
Book Name : The Origin of Mountains By : Cliff Ollier and Colin Pain Information about book :
The Origin of Mountains
The Origin of Mountains is ground breaking. This highly illustrated book describes
mountains from all over the world, emphasising their landforms, their rocks, and their
structure and age. This leads to a deduction on the mechanism that formed them, causing
the authors to reject the pre-conceived well-known hypothesis that plate tectonics and
folding creates mountains.
The Origins of Mountains approaches mountains from facts about mountain landscape
rather than from theory. It uses old and recent references, as well as field evidence. It
shows that mountains are not made directly by folding, but result from vertical uplift of
plains (planation surfaces) to form plateaus, which may later be eroded into rugged
mountains. It also assembles the evidence that this uplift occurred in the last few million
years, a time scale which does not fit the plate tectonic theory.
Another fascinating story is that the age of uplift correlates very well with climatic
change. Mountain building could have been responsible for the onset of the ice age and
the monsoon climate, and certainly created many new environments. Fossil plants and
animals are used to work out the time of mountain formation, which in turn helps to
explain biogeographic distributions.
Cliff Ollier is a Visiting Fellow, Centre for Resource and Environmental Studies,
Australian National University and also Emeritus Professor, University of New England.
Colin Pain is Assistant Director, Cooperative Research Centre for Landscape Evolution
and Mineral Exploration, Australian Geological Survey Organisation.
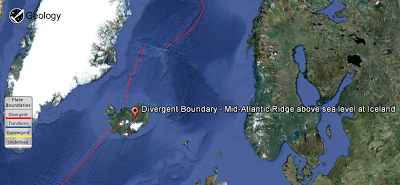
Mid-Atlantic Ridge above sea level at Iceland A geologically young land, Iceland is located on both the Iceland hotspot and the Mid-Atlantic Ridge, which runs right through it. This location means that the island is highly geologically active with many volcanoes, notably Hekla, Eldgjá, Herðubreið and Eldfell.
Iceland has many geysers, including Geysir, from which the English word is derived, and the famous Strokkur, which erupts every 5–10 minutes. After a phase of inactivity, Geysir started erupting again after a series of earthquakes in 2000. Geysir has since then grown quieter and does not erupt often.
With the widespread availability of geothermal power, and the harnessing of many rivers and waterfalls for hydroelectricity, most residents have access to inexpensive hot water, heating and electricity. The island itself is composed primarily of basalt, a low-silica lava associated with effusive volcanism as has occurred also in Hawaii. Iceland, however, has a variety of volcanic types (composite and fissure), many producing more evolved lavas such as rhyolite and andesite. Iceland has hundreds of volcanoes within approx. 30 volcanic systems active
Surtsey, one of the youngest islands in the world, is part of Iceland. Named after Surtr, it rose above the ocean in a series of volcanic eruptions between 8 November 1963 and 5 June 1968. Only scientists researching the growth of new life are allowed to visit the island.
On 21 March 2010, a volcano in Eyjafjallajökull in the south of Iceland erupted for the first time since 1821, forcing 600 people to flee their homes. Further eruptions on 14 April forced hundreds of people to abandon their homes. The resultant cloud of volcanic ash brought major disruption to air travel across Europe.
Another large eruption occurred on 21 May 2011. This time it was the Grímsvötn volcano, located under the thick ice of Europe’s largest glacier, Vatnajökull. Grímsvötn is one of Iceland’s most active volcanoes and this eruption was much more powerful than the 2010 Eyjafjallajökull activity. The eruption hurled ash and lava 20 km (12.43 mi) up into the atmosphere, creating a large cloud that for a while was thought to pose a danger to jet aircraft over a wide area of northern Europe.
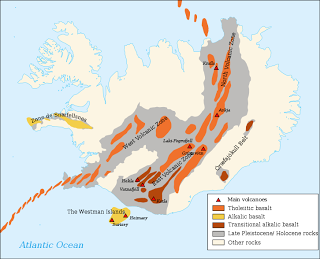
Volcanology of Iceland
Active volcanic areas and systems in Iceland
Iceland has a high concentration of active volcanoes due to its location on the mid-Atlantic Ridge, a divergent tectonic plate boundary. The island has 30 active volcanic systems, of which 13 have erupted since the settlement of Iceland in AD 874.
Of these 30 volcanic systems, the most active/volatile is Grímsvötn. Over the past 500 years, Iceland’s volcanoes have erupted a third of the total global lava output.
The most fatal volcanic eruption of Iceland’s history was the so-called Skaftáreldar (fires of Skaftá) in 1783-84. The eruption was in the crater row Lakagígar (craters of Laki) southeast of Vatnajökull glacier. The craters are a part of a larger volcanic system with the subglacial Grímsvötn as a central volcano. Roughly a quarter of the Icelandic nation died because of the eruption. Most died not because of the lava flow or other direct effects of the eruption, but from indirect effects, including changes in climate and illnesses in livestock in the following years caused by the ash and poisonous gases from the eruption. The 1783 eruption in Lakagígar is thought to have erupted the largest quantity of lava from a single eruption in historic times.
The eruption under Eyjafjallajökull (“glacier of Eyjafjöll”) in 2010 was notable because the volcanic ash plume disrupted air travel in northern Europe for several weeks; however this volcano is minor in Icelandic terms. In the past, eruptions of Eyjafjallajökull have been followed by eruption of the larger volcano Katla, but after the 2010 eruption no signs of an imminent eruption of Katla were seen.
The eruption in May 2011 at Grímsvötn under the Vatnajökull glacier sent thousands of tonnes of ash into the sky in a few days, raising concerns of a repeat of the travel chaos seen across northern Europe.
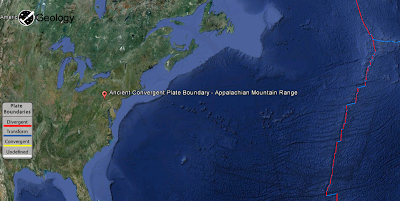
The Appalachian Mountains , often called the Appalachians, are a system of mountains in eastern North America. The Appalachians first formed roughly 480 million years ago during the Ordovician Period, and once reached elevations similar to those of the Alps and the Rocky Mountains before they were eroded. The Appalachian chain is a barrier to east-west travel as it forms a series of alternating ridgelines and valleys oriented in opposition to any road running east-west.
Definitions vary on the precise boundaries of the Appalachians. The United States Geological Survey (USGS) defines the Appalachian Highlands physiographic division as consisting of thirteen provinces: the Atlantic Coast Uplands, Eastern Newfoundland Atlantic, Maritime Acadian Highlands, Maritime Plain, Notre Dame and Mégantic Mountains, Western Newfoundland Mountains, Piedmont, Blue Ridge, Valley and Ridge, Saint Lawrence Valley, Appalachian Plateaus, New England province, and the Adirondack provinces. A common variant definition does not include the Adirondack Mountains, which geologically belong to the Grenville Orogeny and have a different geological history to the rest of the Appalachians.
Overview
The range is mostly located in the United States but extends into southeastern Canada, forming a zone from 100 to 300 mi (160 to 480 km) wide, running from the island of Newfoundland 1,500 mi (2,400 km) southwestward to Central Alabama in the United States. The range covers parts of the islands of Saint Pierre and Miquelon, which comprise an overseas territory of France. The system is divided into a series of ranges, with the individual mountains averaging around 3,000 ft (910 m). The highest of the group is Mount Mitchell in North Carolina at 6,684 feet (2,037 m), which is the highest point in the United States east of the Mississippi River.
The term Appalachian refers to several different regions associated with the mountain range. Most broadly, it refers to the entire mountain range with its surrounding hills and the dissected plateau region. However, the term is often used more restrictively to refer to regions in the central and southern Appalachian Mountains, usually including areas in the states of Kentucky, Tennessee, Virginia, Maryland, West Virginia, and North Carolina, as well as sometimes extending as far south as northern Georgia and western South Carolina, as far north as Pennsylvania and southern Ohio.
The Ouachita Mountains in Arkansas and Oklahoma were originally part of the Appalachians as well, but became disconnected through geologic history.
Geology of the Appalachians
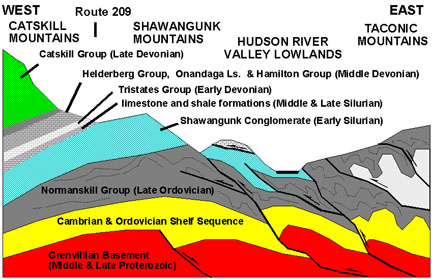
Generalized east-to-west cross section through the central Hudson Valley region. USGS image
The geology of the Appalachians dates back to more than 480 million years ago. A look at rocks exposed in today’s Appalachian Mountains reveals elongate belts of folded and thrust faulted marine sedimentary rocks, volcanic rocks and slivers of ancient ocean floor – strong evidence that these rocks were deformed during plate collision. The birth of the Appalachian ranges marks the first of several mountain building plate collisions that culminated in the construction of the supercontinent Pangaea with the Appalachians and neighboring Little Atlas (now in Morocco) near the center. These mountain ranges likely once reached elevations similar to those of the Alps and the Rocky Mountains before they were eroded.
Geological history
Paleozoic Era
During the earliest Paleozoic Era, the continent that would later become North America straddled the equator. The Appalachian region was a passive plate margin, not unlike today’s Atlantic Coastal Plain Province. During this interval, the region was periodically submerged beneath shallow seas. Thick layers of sediment and carbonate rock were deposited on the shallow sea bottom when the region was submerged. When seas receded, terrestrial sedimentary deposits and erosion dominated.
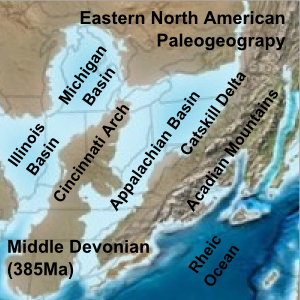
Paleogeographic reconstruction showing the Appalachian Basin area during the Middle Devonian period.
During the middle Ordovician Period (about 480-440 million years ago), a change in plate motions set the stage for the first Paleozoic mountain building event (Taconic orogeny) in North America. The once quiet Appalachian passive margin changed to a very active plate boundary when a neighboring oceanic plate, the Iapetus, collided with and began sinking beneath the North American craton. With the creation of this new subduction zone, the early Appalachians were born.
Along the continental margin, volcanoes grew, coincident with the initiation of subduction. Thrust faulting uplifted and warped older sedimentary rock laid down on the passive margin. As mountains rose, erosion began to wear them down. Streams carried rock debris downslope to be deposited in nearby lowlands.
This was just the first of a series of mountain building plate collisions that contributed to the formation of the Appalachians. Mountain building continued periodically throughout the next 250 million years (Caledonian, Acadian, Ouachita, Hercynian, and Allegheny orogenies). Continent after continent was thrust and sutured onto the North American craton as the Pangean supercontinent began to take shape. Microplates, smaller bits of crust, too small to be called continents, were swept in, one by one, to be welded to the growing mass.
By about 300 million years ago (Pennsylvanian Period) Africa was approaching the North American craton. The collisional belt spread into the Ozark-Ouachita region and through the Marathon Mountains area of Texas. Continent vs. continent collision raised the Appalachian-Ouachita chain to a lofty mountain range on the scale of the present-day Himalaya. The massive bulk of Pangea was completed near the end of the Paleozoic Era (Permian Period) when Africa (Gondwana) plowed into the continental agglomeration, with the Appalachian-Ouachita mountains near the core.
Mesozoic Era and later
Pangea began to break up about 220 million years ago, in the Early Mesozoic Era (Late Triassic Period). As Pangea rifted apart a new passive tectonic margin was born and the forces that created the Appalachian, Ouachita, and Marathon Mountains were stilled. Weathering and erosion prevailed, and the mountains began to wear away.
By the end of the Mesozoic Era, the Appalachian Mountains had been eroded to an almost flat plain. It was not until the region was uplifted during the Cenozoic Era that the distinctive topography of the present formed. Uplift rejuvenated the streams, which rapidly responded by cutting downward into the ancient bedrock. Some streams flowed along weak layers that define the folds and faults created many millions of years earlier. Other streams downcut so rapidly that they cut right across the resistant folded rocks of the mountain core, carving canyons across rock layers and geologic structures.