
Book Name : FUNDAMENTALS OF GEOMORPHOLOGY
Second Edition
By:Richard John Huggett
Routledge Fundamentals of Physical
Geography
Download >> http://www.mediafire.com/?qizfkhivefbvhha
Book Name : FUNDAMENTALS OF GEOMORPHOLOGY
Second Edition
By:Richard John Huggett
Routledge Fundamentals of Physical
Geography
Download >> http://www.mediafire.com/?qizfkhivefbvhha
A new study co-authored by a University of Florida researcher provides the first direct chronological test of sequence stratigraphy, a powerful tool for exploring Earth’s natural resources.
The model allows geologists to better understand how sedimentary rocks are related to one another in time and space and predict what types of rocks are located in different areas. The information may help scientists more reliably interpret various aspects of Earth’s history such as long-term climate changes or extinction events, and also benefit companies searching for the best locations to drill for oil.
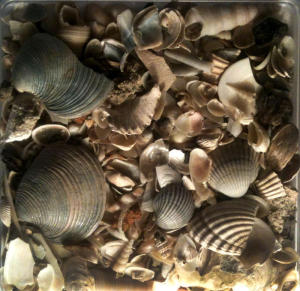
The study recently published online in Geology uses extensive numerical dating of fossil shells to verify key predictions of the sequence stratigraphy model. Although used successfully for more than 30 years as a theoretical framework for interpreting and exploring rock bodies, the model had never been proven quantitatively by direct numerical dating.
“Paleontologists and geologists are well aware of the fact that you should not take the fossil record at face value because you will then see changes through time that may not be meaningful,” said study co-author Michal Kowalewski, a curator of invertebrate paleontology at the Florida Museum of Natural History on the UF campus. “However, by using dating to quantify how the resolution changes through time, we can improve quality control on our data and develop better strategies for reconstructing the history of life more accurately.”
In the study, researchers used racemization, a technique in which amino acid ratios are obtained to estimate the age of fossils from the most recent geological record. Relative age estimates were calibrated using radiocarbon to date about 250 mollusk shells extracted from cores drilled in the Po Plain in northern Italy. The technique, developed over the last 30 years, has made dating of large numbers of shells affordable and efficient, Kowalewski said
Kowalewski is principal investigator on the National Science Foundation-funded project, a four-year study involving a team of scientists from the University of Bologna and Northern Arizona University.
“We were thrilled to learn that sedimentary rocks assemble through time exactly as predicted,” said Kowalewski, who recently relocated from Virginia Tech and is the Jon L. and Beverly A. Thompson Chair of Invertebrate Paleontology at the Florida Museum. “The results are not only a direct validation of the sequence stratigraphic model, but also provide us with direct numerical estimates of changes in the resolution of the fossil record as a function of relative changes in sea level.”
As the model predicted for the geological setting of the Po Plain, the sediments accumulated at an increasingly slower pace during initial phases of sea level rise, culminating with horizons that formed so slowly that shells from multiple millennia were mixed within the same sediment layers. Following the sea level rise, sediment was deposited at an increasingly faster pace.
“We are pretty confident that the primary driver of sea level changes in this time frame was climate, but that’s not always the case in the geological record,” Kowalewski said. ‘We can now provide a more informed constraint on timing of the most recent sea level rise in the northern Adriatic.”
Because the Po Plain contains young sediments dating to about the last 10,000 years, part of the cycle researchers tested includes changes occurring today, said Carlton Brett, a geology professor at the University of Cincinnati. As sea level rises quickly, sediment accumulates in bays and river mouths, leaving little sediment offshore, Brett said.
“I think what they’re doing is groundbreaking in the sense that they’re testing a model that is one of the most important models in sedimentary geology that has ever come down the pipe,” Brett said. “As one who uses that model a lot and makes those assumptions about why we are getting shell beds offshore, the fact that they have put numbers on the tests gives us very good confidence that we’re on the right track.”
The team plans to continue working in the Po Plain, a well-understood system that records the most recent millennia of the region’s geological history. The project can help researchers better understand human-induced changes because the Po Plain sediments document the fossil record of ecosystems that directly predate what many geologists refer to as the Anthropocene Epoch, the new geologic era of human modification of the natural world.
Study co-authors include Daniele Scarponi and Alessandro Amorosi of the University of Bologna, and Darell Kaufman of Northern Arizona University.
Note : The above story is reprinted from materials provided by University of Florida. The original article was written by Danielle Torrent.
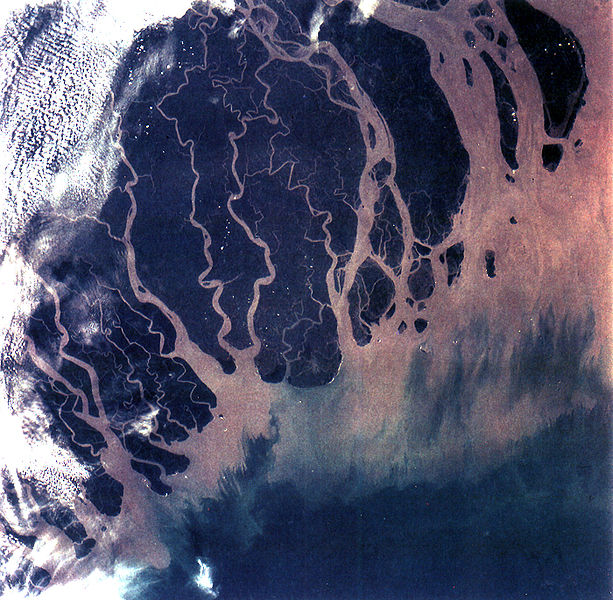
A river delta is a landform that is formed at the mouth of a river, where the river flows into an ocean, sea, estuary, lake, or reservoir. Deltas are formed from the deposition of the sediment carried by the river as the flow leaves the mouth of the river. Over long periods of time, this deposition builds the characteristic geographic pattern of a river delta.
Contrary to popular belief, this usage of the word delta was not coined by Herodotus
River deltas form when a river carrying sediment reaches either (1) a body of standing water, such as a lake, ocean, or reservoir, (2) another river that cannot remove the sediment quickly enough to stop delta formation, or (3) an inland region where the water spreads out and deposits sediments. When the flow enters the standing water, it is no longer confined to its channel and expands in width. This flow expansion results in a decrease in the flow velocity, which diminishes the ability of the flow to transport sediment. As a result, sediment drops out of the flow and deposits. Over time, this single channel will build a deltaic lobe (such as the bird’s-foot of the Mississippi or Ural River deltas), pushing its mouth further into the standing water. As the deltaic lobe advances, the gradient of the river channel becomes lower because the river channel is longer but has the same change in elevation (see slope). As the slope of the river channel decreases, it becomes unstable for two reasons. First, the water under the force of gravity will tend to flow in the most direct course down slope. If the river breaches its natural levees (i.e., during a flood), it will spill out onto a new course with a shorter route to the ocean, thereby obtaining a more stable steeper slope. Second, as its slope gets lower, the amount of sheer stress on the bed will decrease, which will result in deposition of sediment within the channel and a rise in the channel bed relative to the floodplain. This will make it easier for the river to breach its levees and cut a new channel that enters the body of standing water at a steeper slope. Often when the channel does this, some of its flow can remain in the abandoned channel. When these channel switching events occur a mature delta will gain a distributary network.
Another way in which these distributary networks may form is from the deposition of mouth bars (mid-channel sand and/or gravel bars at the mouth of a river). When this mid-channel bar is deposited at the mouth of a river, the flow is routed around it. This results in additional deposition on the upstream end of the mouth-bar, which splits the river into two distributary channels. A good example of the result of this process is the Wax Lake Delta in Louisiana.
In both of these cases, depositional processes force redistribution of deposition from areas of high deposition to areas of low deposition. This results in the smoothing of the planform (or map-view) shape of the delta as the channels move across its surface and deposit sediment. Because the sediment is laid down in this fashion, the shape of these deltas approximates a fan. It is closer to an ideal fan the more often the flow changes course because more rapid changes in channel position results in more uniform deposition of sediment on the delta front. The Mississippi and Ural River deltas, with their bird’s-feet, are examples of rivers that do not avulse often enough to form a symmetrical fan shape. Alluvial fan deltas, as seen in their name, avulse frequently and more closely approximate an ideal fan shape.

Erosion is also an important control in tide dominated deltas, such as the Ganges Delta, which may be mainly submarine, with prominent sand bars and ridges. This tends to produce a “dendritic” structure. Tidal deltas behave differently from river- and wave-dominated deltas, which tend to have a few main distributaries. Once a wave- or river- distributary silts up, it is abandoned, and a new channel forms elsewhere. In a tidal delta, new distributaries are formed during times when there’s a lot of water around – such as floods or storm surges. These distributaries slowly silt up at a pretty constant rate until they fizzle out.
A Gilbert delta (named after Grove Karl Gilbert) is a specific type of delta that is formed by coarse sediments, as opposed to gently-sloping muddy deltas such as that of the Mississippi. For example, a mountain river depositing sediment into a freshwater lake would form this kind of delta.While some authors describe both lacustrine and marine locations of Gilbert deltas, others note that their formation is more characteristic of the freshwater lakes, where it is easier for the river water to mix with the lakewater faster (as opposed to the case of a river falling into the sea or a salt lake, where less dense fresh water brought by the river stays on top longer).
G.K. Gilbert himself first described this type of delta on Lake Bonneville in 1885.Elsewhere, similar structures can be found e.g. at the mouths of several creeks flowing into Okanagan Lake in British Columbia and forming prominent peninsulas at Naramata (49°35′30″N 119°35′30″W), Summerland (49°34′23″N 119°37′45″W), or Peachland (49°47′00″N 119°42′45″W)
Other rivers, particularly those located on coasts with significant tidal range, do not form a delta but enter into the sea in the form of an estuary. Notable examples include the Saint Lawrence River and the Tagus estuary.
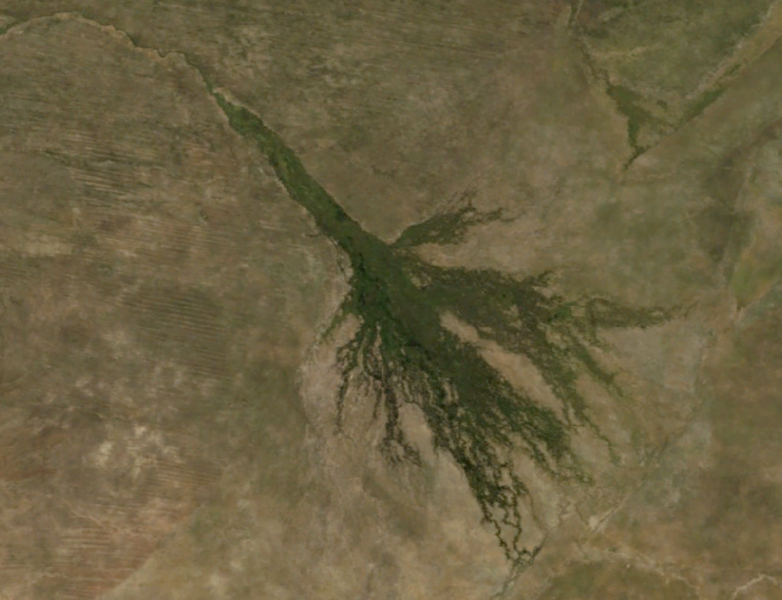
In rare cases the river delta is located inside a large valley and is called an inverted river delta. Sometimes a river will divide into multiple branches in an inland area, only to rejoin and continue to the sea; such an area is known as an inland delta, and often occur on former lake beds. The Inner Niger Delta and Peace–Athabasca Delta are notable examples. The Amazon has also an inland delta before the island of Marajó.
In some cases a river flowing into a flat arid area splits into channels which then evaporate as it progresses into the desert. Okavango Delta in Botswana is one well-known example.
The formation of a delta consists of three main forms: the topset, foreset/frontset, and bottomset.
Book Name : Deformation Microstructures and Mechanisms in Minerals and Rocks
By:
Tom Blenkinsop
Department of Geology,
University of Zimbabwe, Harane Zimbabwe
KLUWER

Book Name : Plate Tectonics and Crustal Evolution ,Fourth edition
By : Kent C. Condie
New Mexico Institute of Mining and Technology
Socorro, New Mexico
Book Name: GEOLOGICAL FIELD TECHNIQUES
Edited by : Angela L. Coe
Authors:
Angela L. Coe
Tom W. Argles
David A. Rothery
Robert A. Spicer
Department of Earth and Environmental Sciences,
The Open University, Walton Hall, Milton Keynes, UK
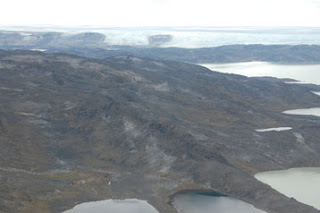
Rocks dating back 3.4 billion years from south-west Greenland’s Isua mountain range have yielded valuable information about the structure of Earth during its earliest stages of development. In these rocks, which witnessed the first billion years of Earth’s history, a French-Danish team led by researchers from the ‘Magmas and Volcanoes’ Laboratory (CNRS / Université Blaise Pascal / IRD) have highlighted a lack of neodymium-142, an essential chemical element for the study of Earth’s formation.
This deficit supports the hypothesis that between 100 and 200 million years after its formation, Earth was made up of an ocean of molten magma, which gradually cooled. The work, which was carried out in collaboration with the Laboratoire de Géologie de Lyon (CNRS / Université Lyon 1 / ENS de Lyon) and the University of Copenhagen, was published on 1 November 2012, in the journal Nature.
Earth is believed to have formed 4.58 billion years ago, by accretion of material in the Solar System. The heat produced by the accretion process, as well as by the decay of radioactive elements, caused this material to melt. As a result, 100 to 200 million years after its formation, Earth must have been made up of an ocean of molten magma, in the center of which a metallic core formed. The ocean gradually cooled. Earth’s crust then appeared, and the process of continental drift began. The crystallization of the molten magma is likely to have been accompanied by the chemical layering of Earth: concentric layers with distinct chemical compositions became differentiated. It is the signature of these primordial inhomogeneities that the researchers found in the Isua rocks.
The scientists were interested in a key chemical element, the isotope neodymium-142, formed by the decay of a now vanished radioactive isotope called samarium-146. The abundance of neodymium-142 is almost identical in all terrestrial rocks. Only two exceptions have been discovered to date, in Canada and Greenland, in certain rocks dating back 3.7 billion years. The composition of these rocks shows evidence of the primordial inhomogeneities that formed as the magma ocean crystallized.
In 2003, for the first time, two groups of French researchers observed an excess of neodymium-142 in certain rocks in the same region. If such excess can be found in some layers of the primordial Earth, it means that other layers must be depleted in this isotope. However, until these new findings by the French-Danish team, such neodymium-142 deficits remained hypothetical for nine years. Using a sophisticated method, thermal ionization mass spectrometry, the researchers carried out a very detailed analysis of the concentration of neodymium-142 in Isua rock samples. They discovered a neodymium-142 deficit of 10.6 parts per million, which lends weight to the ‘magma ocean’ theory.
These findings should help to improve models of the internal dynamics of Earth during its early stages of development. By discovering a neodymium-142 deficit in relatively young rocks, formed around a billion years after the crystallization of the magma ocean, the researchers have shown that the primordial inhomogeneities persisted longer than predicted before being eliminated by convective motion in Earth’s mantle. In order to obtain more comprehensive data, the scientists now intend to study the composition of other rocks of similar age outcropping for example in Canada, South Africa and China.
This study was mainly funded by an ERC Starting Grant.
The elusive Hadean enriched reservoir revealed by 142Nd deficits in Isua Archean rocks. Hanika Rizo, Maud Boyet, Janne Blichert-Toft, Jonathan O’Neil, Minik Rosing, Jean-Louis Paquette, Nature, 1 November 2012.
Note : The above story is reprinted from materials provided by Centre national de la recherche scientifique (CNRS).
–Book Name : Introduction to Mineral Exploration,Second Edition
– Edited by :
Charles J. Moon, Michael K.G. Whateley & Anthony M. Evans
– With contributions from:
William L. Barrett
Timothy Bell
Anthony M. Evans
John Milsom
Charles J. Moon
Barry C. Scott
Michael K.G. Whateley
Download Link >> http://www.mediafire.com/?pbybtkm7wuoa8fy
Book Name : Basic Geological Mapping , Fourth Edition
Author :
John W. Barnes
formerly of the Department of Earth Sciences,
University of Wales Swansea
with
Richard J. Lisle
Department of Earth, Ocean and Planetary Sciences
Cardiff University
Nestled within the vast and rugged landscape of the Vermilion Cliffs National Monument in northern Arizona lies a geological wonder that has captivated the imaginations of nature enthusiasts and adventurers alike – The Wave. This surreal and otherworldly sandstone formation is a testament to the awe-inspiring forces of nature that have shaped the American Southwest.
The Wave is a striking example of nature’s artistry, a sandstone formation that undulates in a wave-like pattern, creating an almost dreamlike landscape. Situated in the Coyote Buttes area of the Vermilion Cliffs, The Wave is renowned for its unique and colorful striations, resembling a painting crafted by the hand of a master artist. Its popularity has grown exponentially, drawing visitors from around the world eager to witness this geological masterpiece.
Understanding the geological origins of The Wave adds a layer of appreciation for its beauty. The formation is primarily composed of Jurassic-age Navajo Sandstone, deposited over 190 million years ago. Erosion, primarily by wind and water, has sculpted the sandstone into the undulating forms that we see today. The distinctive cross-bedding and layering tell a story of ancient dunes frozen in time, now revealed for all to marvel at.
“The Wave” consists of intersecting U-shaped troughs that have been eroded into Navajo Sandstone of Jurassic age. The two major troughs, which comprise this rock formation, are 19 meters wide by 36 meters long and 2 meters wide by 16 meters long. Initially, infrequent runoff eroded these troughs along joints within the Navajo Sandstone. After their formation, the drainage basin, which fed rainwater to these troughs, shrank to the point that the runoff became insufficient to contribute to the cutting of these troughs. As a result, the troughs are now almost exclusively eroded by wind as indicated by the orientation of erosional steps and risers cut into the sandstone along their steep walls. These erosional steps and risers are oriented relative to predominate direction of the wind as it is now naturally funneled into and through these troughs.
The Wave exposes large, eolian sets of cross-bedded sandstone composed of rhythmic and cyclic alternating grainflow and windripple laminae. The rhythmic and cyclic alternating laminae represent periodic changes in the prevailing winds during the Jurassic as huge sand dunes migrated across a sandy desert. The thin ridges and ribbing seen within The Wave are the result of the differential erosion of rhythmic and cyclic alternating grainflow and windripple laminae within the Navajo Sandstone. These laminae have differing resistance to erosion as they have been differentially cemented according to variations in the grain size of the sand composing them. The soft sandstone, including the ridges and ribbing, of The Wave is fragile. As a result, a person needs to walk carefully to not break the small ridges.
In places, The Wave exposes deformed laminae within the Navajo Sandstone. These laminae were deformed prior to the lithification of the sand to form sandstone. Judging from their physical characteristics, this deformation likely represents the trampling and churning of these sands by dinosaurs right after their deposition. Dinosaur tracks and the fossil burrows of desert-dwelling arthropods, such as beetles and other insects, have been found within the Navajo Sandstone within the North Coyote Buttes Wilderness Area.
The Wave’s popularity comes with a caveat – access is strictly regulated. The Bureau of Land Management (BLM) issues a limited number of permits each day to preserve the delicate environment and ensure a peaceful experience for visitors. Securing one of these coveted permits has become a challenge in itself, adding an element of exclusivity to the journey. However, the effort required to obtain a permit only amplifies the anticipation and excitement for those fortunate enough to embark on this adventure.
Access to The Wave involves a moderate to strenuous hike, adding a sense of adventure and accomplishment to the visit. The journey begins at the Wire Pass Trailhead, leading hikers through a maze of slickrock and sandy terrain. Navigating the path, often marked only by small cairns, enhances the feeling of discovery and exploration. The final approach to The Wave unveils the iconic formation, a reward for those who have ventured into the heart of the Coyote Buttes.
One of The Wave’s most enchanting features is its vibrant color palette. The interplay of reds, oranges, yellows, and whites creates a mesmerizing display, especially during the golden hours of sunrise and sunset. The varying hues are a result of mineral deposits in the sandstone, with iron and manganese producing the warm tones that dance across the undulating surfaces. Photographers, in particular, find The Wave to be a captivating subject, with every angle revealing a new perspective of its kaleidoscopic beauty.
While the surrounding desert may appear harsh and barren, The Wave supports a surprising diversity of flora and fauna. Hardy desert plants, adapted to the arid conditions, cling to life in crevices and pockets of soil. The resilient desert tortoise and the elusive bighorn sheep are among the native inhabitants, showcasing the remarkable ability of life to thrive in seemingly inhospitable environments.
The fragility of The Wave’s ecosystem and its popularity among visitors have prompted conservation efforts to protect this natural wonder. Leave No Trace principles are emphasized, urging visitors to minimize their impact on the delicate environment. Education about responsible hiking practices and adherence to established trails help preserve The Wave for future generations, ensuring that its beauty endures.
Beyond its visual appeal, The Wave has inspired artists, writers, and creatives across disciplines. Its surreal forms and timeless beauty have been the muse for countless works of art, literature, and even scientific studies. The intersection of art and nature is vividly apparent in this remote corner of the American Southwest.
The popularity of The Wave has not been without challenges and controversies. The delicate balance between accessibility and preservation has led to ongoing discussions about visitor limits, permit systems, and the overall impact of human presence on this fragile landscape. Striking the right balance is crucial to ensuring the long-term sustainability of this natural treasure.
In conclusion, The Wave, Arizona, stands as a testament to the raw beauty and geological wonders that grace the American Southwest. Its surreal landscapes, vibrant colors, and the sense of exclusivity granted by limited permits make it a destination like no other. The journey to The Wave is not merely a physical one; it is a voyage into the heart of Earth’s history, where the forces of time and nature have collaborated to create a masterpiece that transcends the ordinary.
As visitors marvel at the undulating sandstone and vibrant hues, The Wave remains a beacon of inspiration, reminding us of the profound beauty that can be found in the most unexpected corners of our planet. Whether captured through the lens of a camera or etched into the memory of those fortunate enough to experience it firsthand, The Wave leaves an indelible mark, inviting all who encounter it to contemplate the wonders of our natural world.
Event Time
2012-10-28 03:04:10 UTC
2012-10-27 20:04:10 UTC-07:00 at epicenter
2012-10-28 05:04:10 UTC+02:00 system time
Location
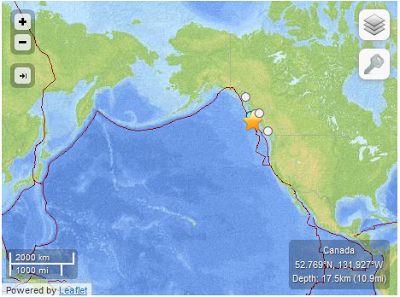
52.769°N 131.927°W depth=17.5km (10.9mi)
Nearby Cities
139km (86mi) S of Masset, Canada
202km (126mi) SSW of Prince Rupert, Canada
293km (182mi) SW of Terrace, Canada
556km (345mi) NW of Campbell River, Canada
635km (395mi) SSE of Juneau, Alaska
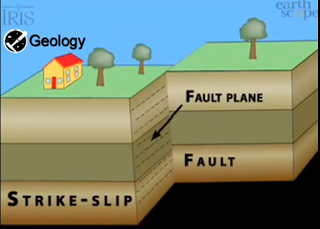
The October 28th, 2012 (October 27 at the location of the epicenter) M 7.7 earthquake south of Masset, Canada, occurred as a result of oblique-thrust faulting near the plate boundary between the Pacific and North America plates. At the location of this event, the Pacific plate moves approximately north-northwest with respect to the North America plate at a rate of approximately 50 mm/yr.
This earthquake is likely associated with relative motion across the Queen Charlotte fault system offshore of British Columbia, Canada. Studies of tectonics in this region suggest plate motions are taken up by strike slip faulting parallel to the plate boundary, accompanied by lesser amounts of thrust motion to accommodate the oblique nature of the plate motion vector between the two plates with respect to the orientation of the main plate boundary fault structure. This oblique component of plate motion may involve either underthrusting of the western edge of the Pacific Plate beneath North America, or be taken up on crustal faults within the North America plate. The October 28th earthquake is consistent with either scenario. Its rupture extended approximately 100-150 km along strike, along the shallow extent of the source fault. Slip amounts reached approximately 5m, in a patch to the south of the epicenter. Aftershocks delineate the rupture well, as shown here.
This region of the Pacific:North America plate boundary has hosted 7 earthquakes of magnitude 6 or greater over the past 40 years – the largest of which was a M 6.6 earthquake in 2009, 80 km to the south east of the 2012 earthquake. In 1949, a M 8.1 earthquake occurred closer to the Pacific:North America plate boundary, likely as a result of strike-slip faulting, approximately 100 km northwest of the October 28th earthquake, near the northern extent of Haida Gwaii region (formerly Queen Charlotte Islands).
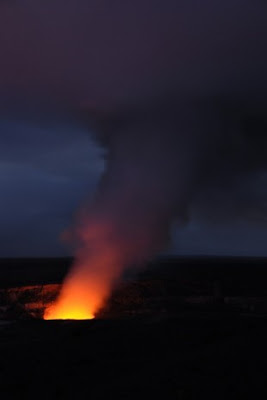
A new Rice University-led study finds that a deep connection about 50 miles underground can explain the enigmatic behavior of two of Earth’s most notable volcanoes, Hawaii’s Mauna Loa and Kilauea. The study, the first to model paired volcano interactions, explains how a link in Earth’s upper mantle could account for Kilauea and Mauna Loa’s competition for the same deep magma supply and their simultaneous “inflation,” or bulging upward, during the past decade.
The study appears in the November issue of Nature Geoscience.
The research offers the first plausible model that can explain both the opposing long-term eruptive patterns at Mauna Loa and Kilauea — when one is active the other is quiet — as well as the episode in 2003-2007 when GPS records showed that each bulged notably due to the pressure of rising magma. The study was conducted by scientists at Rice University, the University of Hawaii, the U.S. Geological Survey (USGS) and the Carnegie Institution of Washington.
“We know both volcanoes are fed by the same hot spot, and over the past decade we’ve observed simultaneous inflation, which we interpret to be the consequence of increased pressure of the magma source that feeds them,” said lead author Helge Gonnermann, assistant professor of Earth science at Rice University. “We also know there are subtle chemical differences in the lava that each erupts, which means each has its own plumbing that draws magma from different locations of this deep source.
“In the GPS records, we first see inflation at Kilauea and then about a half a year later at Mauna Loa,” he said. “Our hypothesis is that the pressure is transmitted slowly through a partially molten and thereby porous region of the asthenosphere, which would account for the simultaneous inflation and the lag time in inflation. Because changes in pore pressure are transmitted between both volcanoes at a faster rate than the rate of magma flow within the porous region, this can also explain how both volcanoes are dynamically coupled, while being supplied by different parts of the same source region.”
Gonnermann said the transmission of pressure through the permeable rock in the asthenosphere is akin to the processes that cause water and oil to flow through permeable layers of rock in shallower regions of Earth’s crust.
“When we fitted the deformation, which tells us how much a volcano inflates and deflates, and the lava eruption rate at Kilauea, we found that our model could simultaneously match the deformation signal recorded over on Mauna Loa,” said James Foster, co-author and assistant researcher at the University of Hawaii School of Ocean and Earth Science and Technology. “The model also required an increase in the magma supply rate to the deep system that matched very nicely with our interpretations and the increased magma supply suggested by the jump in CO2 emissions that occurred in late 2003.”
Mauna Loa and Kilauea, Earth’s largest and most active volcanoes, respectively, are located about 22 miles apart in the Hawaii Volcanoes National Park on the island of Hawaii. They are among the planet’s most-studied and best-instrumented volcanoes and have been actively monitored by scientists at USGS’s Hawaiian Volcano Observatory (HVO) since 1912. Kilauea has erupted 48 times on HVO’s watch, with a nearly continuous flank eruption since 1983. Mauna Loa has erupted 12 times in the same period, most recently in 1984.
“To continue this research, we submitted a proposal to the National Science Foundation (NSF) earlier this summer to extend our study back in time to cover the last 50 years,” Foster said. “We plan to refine the model to include further details of the magma transport within each volcano and also explore how some known prehistoric events and some hypothetical events at one volcano might impact the other. This work should help improve our understanding of volcanic activity of each volcano.”
Gonnermann said there has been disagreement among Earth scientists about the potential links between adjacent volcanoes, and he is hopeful the new model could be useful in studying other volcanoes like those in Iceland or the Galapagos Islands.
“At this point it is unclear whether Hawaii is unique or whether similar volcano coupling may exist at other locations,” Gonnermann said. “Given time and ongoing advances in volcano monitoring, we can test if similar coupling between adjacent volcanoes exists elsewhere.”
Study co-authors include Michael Poland and Asta Miklius, both of HVO; Benjamin Brooks of the University of Hawaii; and Cecily Wolfe of the University of Hawaii and the Carnegie Institution of Washington.
The research was supported by the USGS and the NSF. The Kilauea and Mauna Loa GPS networks are supported by grants from the USGS, NSF and NASA and operated in collaboration by the USGS, Stanford University and the Pacific GPS Facility at the University of Hawaii.
Note : The above story is reprinted from materials provided by Rice University. The original article was written by Jade Boyd.
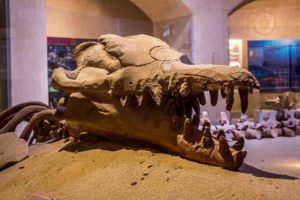
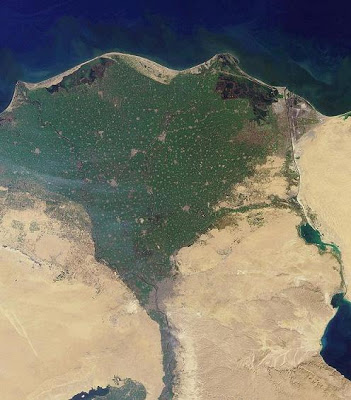
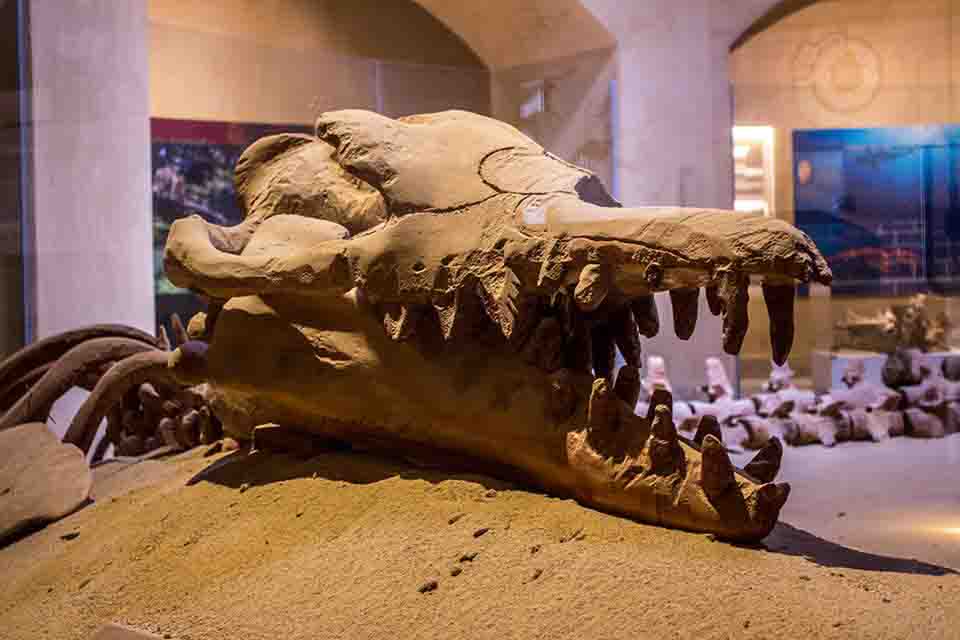
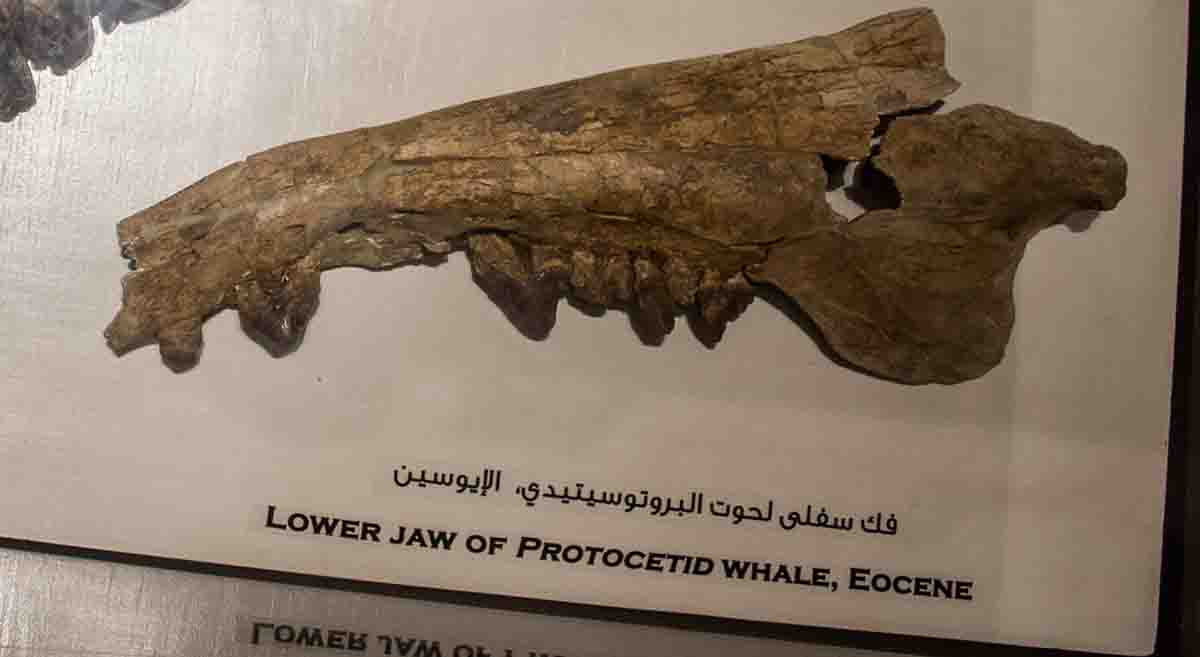
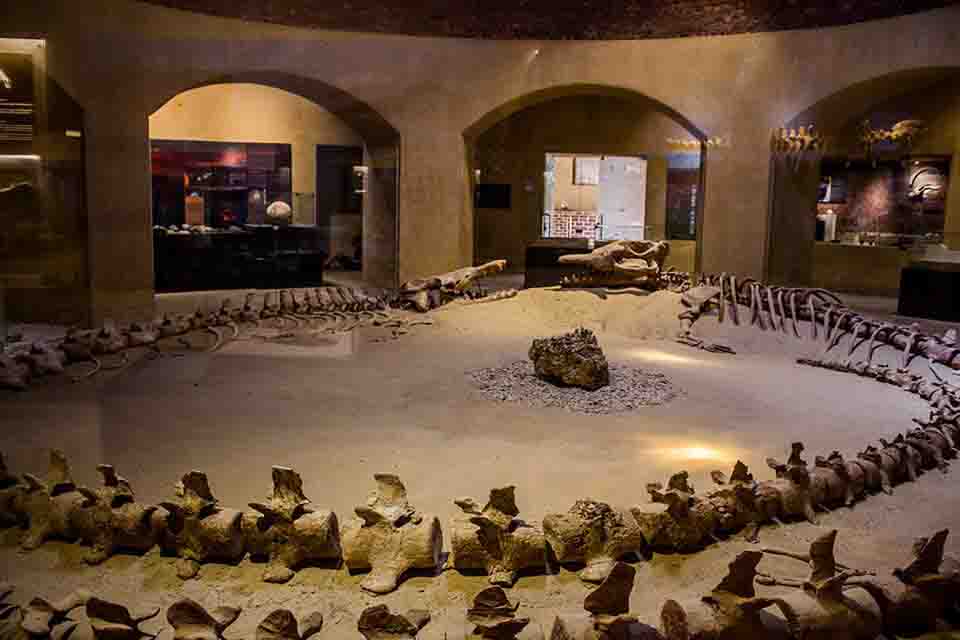
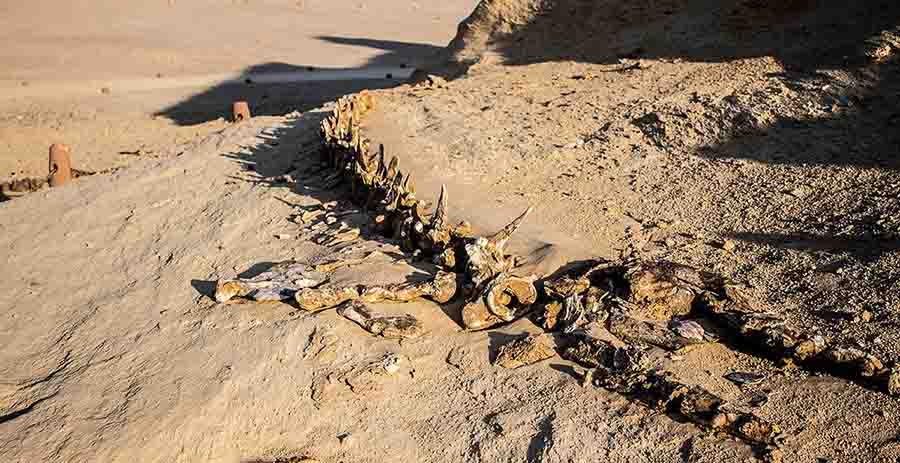
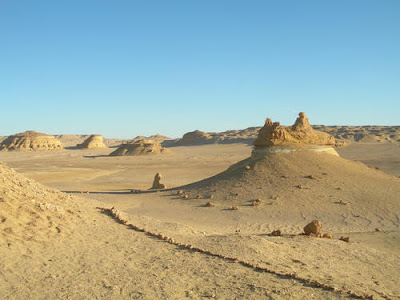
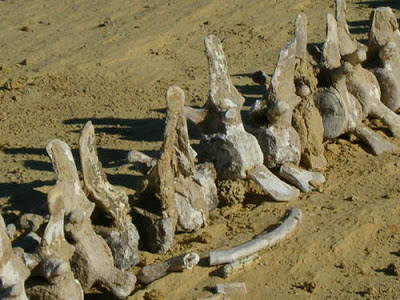
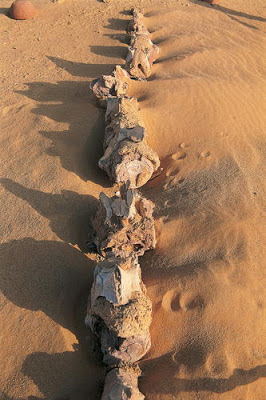
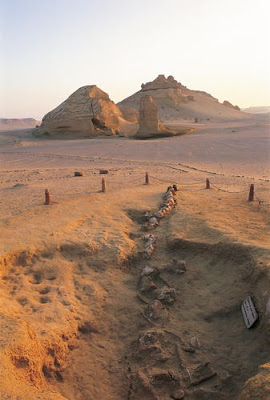
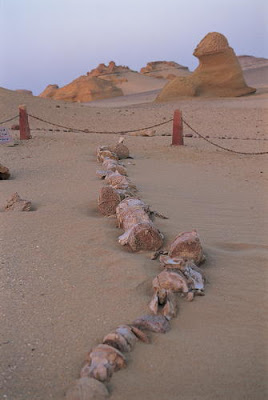
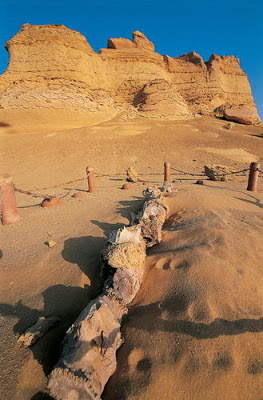
Wadi Al-Hitan “Whales Valley” is a paleontological site in the Al Fayyum Governorate of Egypt, some 150 km southwest of Cairo. It was designated a UNESCO World Heritage Site in July 2005 for its hundreds of fossils of some of the earliest forms of whale, the archaeoceti (a now extinct sub-order of whales). The site reveals evidence for the explanation of one of the greatest mysteries of the evolution of whales: the emergence of the whale as an ocean-going mammal from a previous life as a land-based animal. No other place in the world yields the number, concentration and quality of such fossils, as is their accessibility and setting in an attractive and protected landscape. This is why it was added by the UNESCO to the list of protected World Heritage sites.
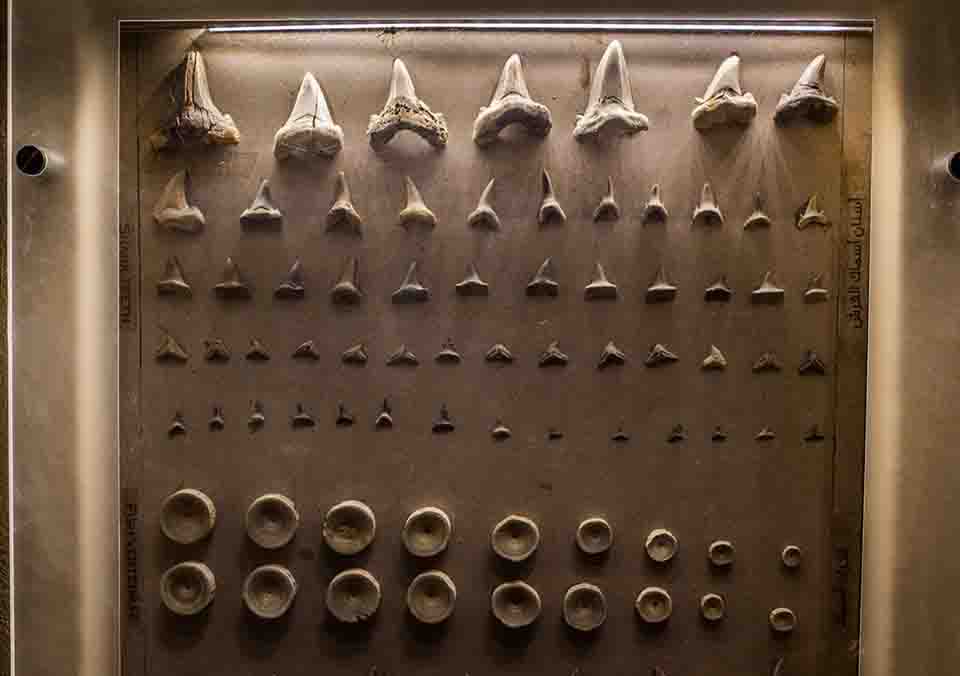
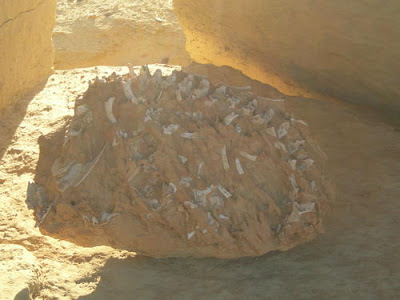
The fossils found at the site may not be the oldest but their great concentration in the area and the degree of their preservation is to the extent that even some stomach contents are intact. The presence of fossils of other early animals such as sharks, crocodiles, sawfish, turtles and rays found at Wadi El-Hitan makes it possible to reconstruct the surrounding environmental and ecological conditions of the time, adding to its justification to be cited as a Heritage site.
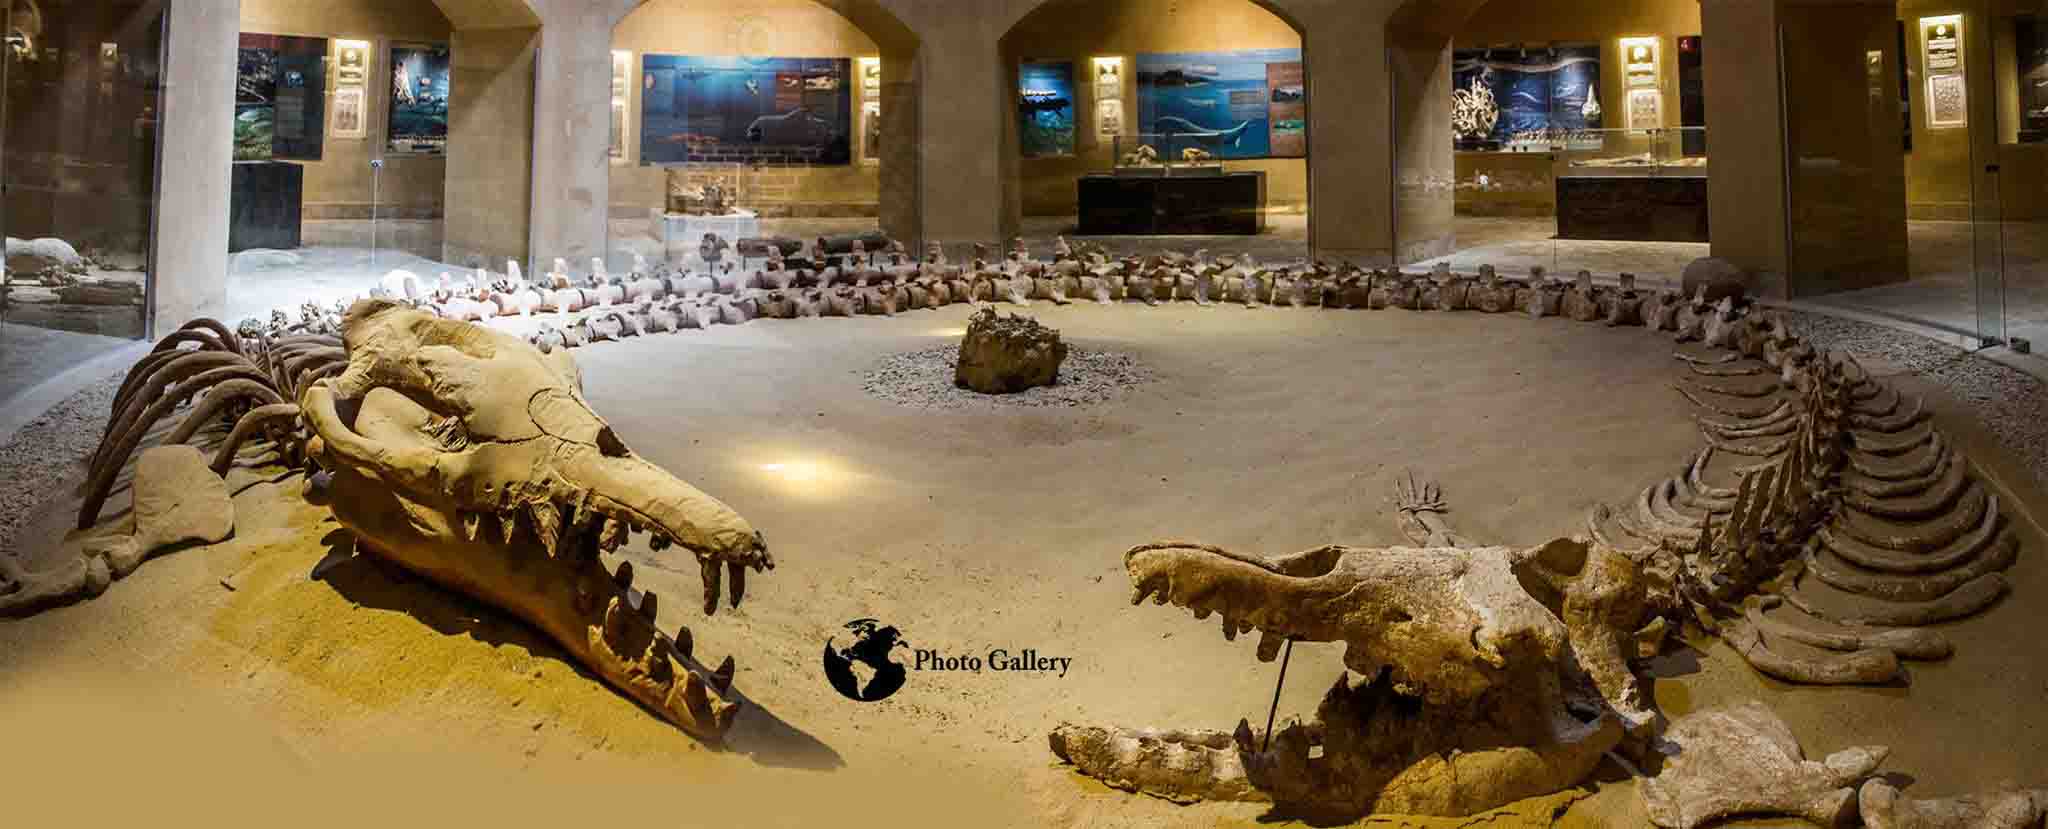
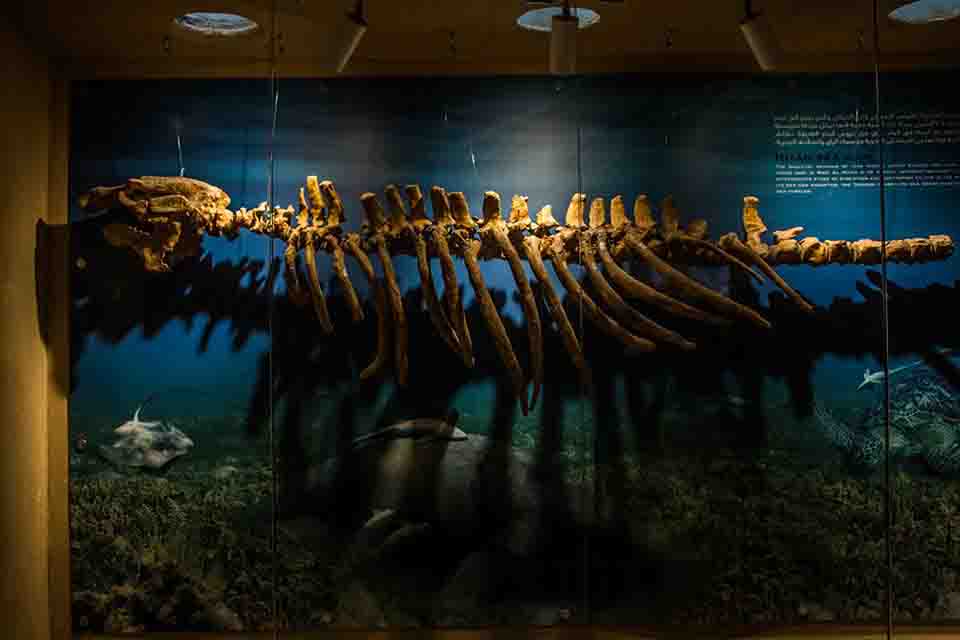
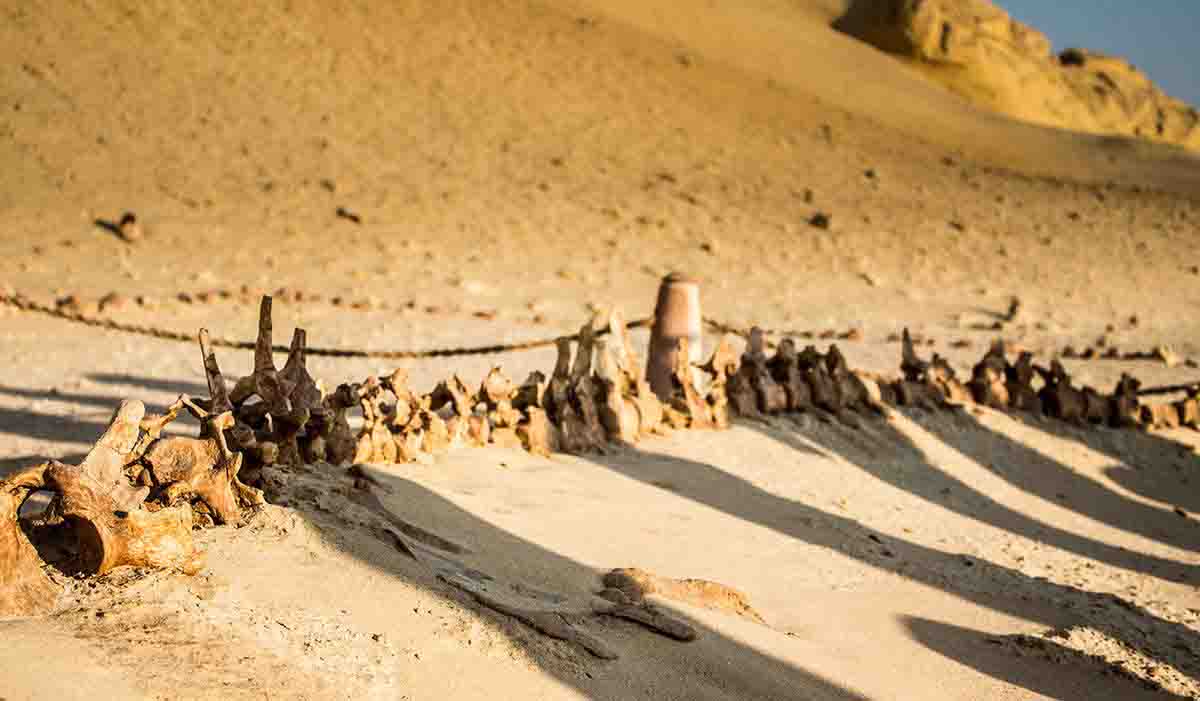
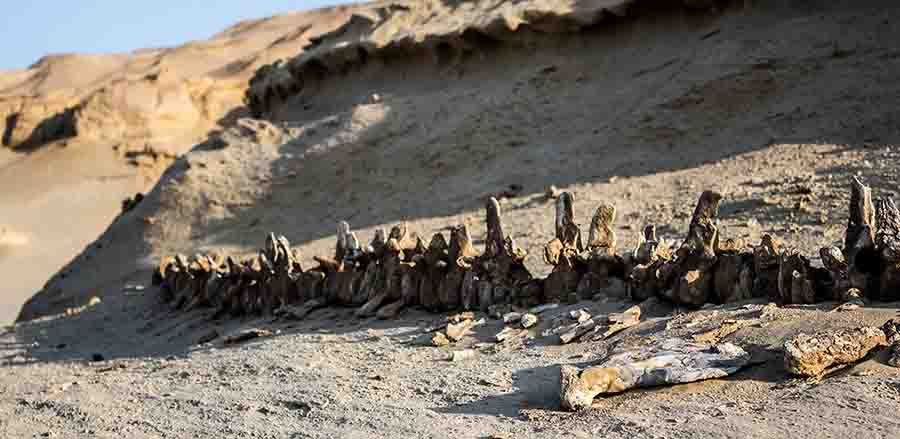
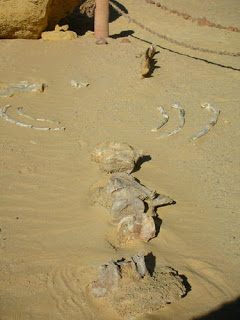
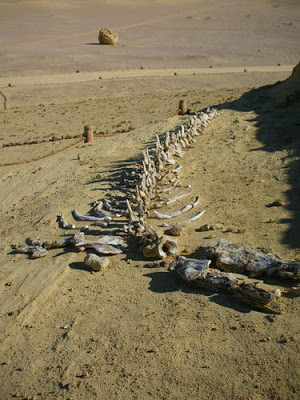
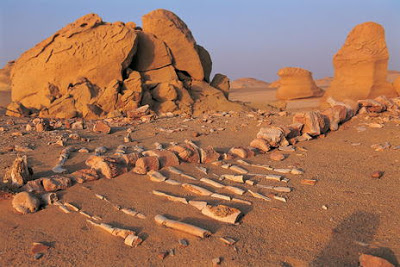
The first fossil skeletons of whales were discovered in the winter of 1902-3. For the next 80 years they attracted relatively little interest, largely due to the difficulty of reaching the area. In the 1980s interest in the site resumed as four wheel drive vehicles became more readily available. Continuing interest coincided with the site being visited by fossil collectors, and many bones were removed, prompting calls for the site to be conserved. The remains display the typical streamlined body form of modern whales, yet retaining some of the primitive aspects of skull and tooth structure. The largest skeleton found reached up to 21 m in length, with well-developed five-fingered flippers on the forelimbs and the unexpected presence of hind legs, feet, and toes, not known previously in any archaeoceti. Their form was serpentine and they were carnivorous. A few of these skeletal remains are exposed but most are shallowly buried in sediments, slowly uncovered by erosion. Wadi El-Hitan provides evidences of millions of years of coastal marine life.
Fossils are present in high numbers and often show excellent quality of preservation. The most conspicuous fossils are the skeletons and bones of whales and sea cows, and over several hundred fossils of these have been documented.
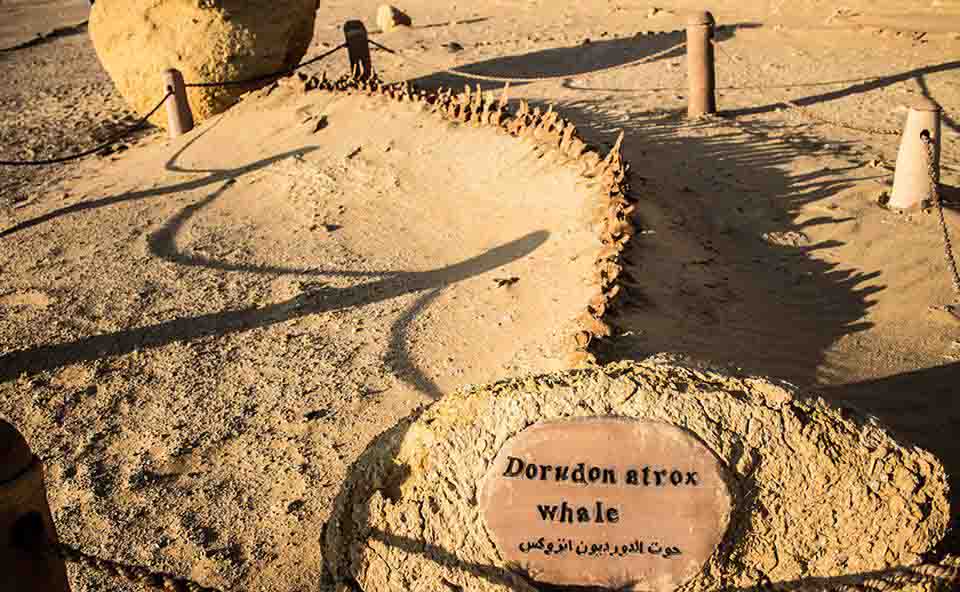
The fossils of whales vary from single bones to entire skeletons, and a number of partial skeletons are currently on display in the public part of the park. The two common whales are the large Basilosaurus, and the smaller (3 to 5 metre) Dorudon. At least two other species are known from rarer remains.
The whales possess small hind limbs, that are not seen in modern whales, and a powerful skull with teeth similar to those of carnivorous land mammals. Other mammals are represented by the skeletons of three species of sirenia or sea cows. These were fully marine like the whales, and likewise show primitive features not seen in modern species and possess teeth that suggest that they grazed on seagrasses and other marine plants.
Bones of the primitive elephant Moeritherium have also been recorded. Fossil reptiles are represented by fossils of crocodiles and sea turtles, and bones of sea snakes have also been recorded. There are many species of bony fish, sharks and rays represented, but most of the fossils are isolated small teeth and these are not often conspicuous. Larger fish fossils include the rostra and pegs of sawfish; a sawfish rostrum of 1.8 metres long is laid out in the park.
Fossil shells are not common in the main whale-bearing rocks, but are very common in other rocks; many fallen rocks can be seen to be full of a wide variety of fossil shells. Disc-shaped nummulite fossils are common in places, and often coat the desert floor. A large log is present in the park, and this is full of tubular shipworm fossils. Some fossil seagrasses are also known.
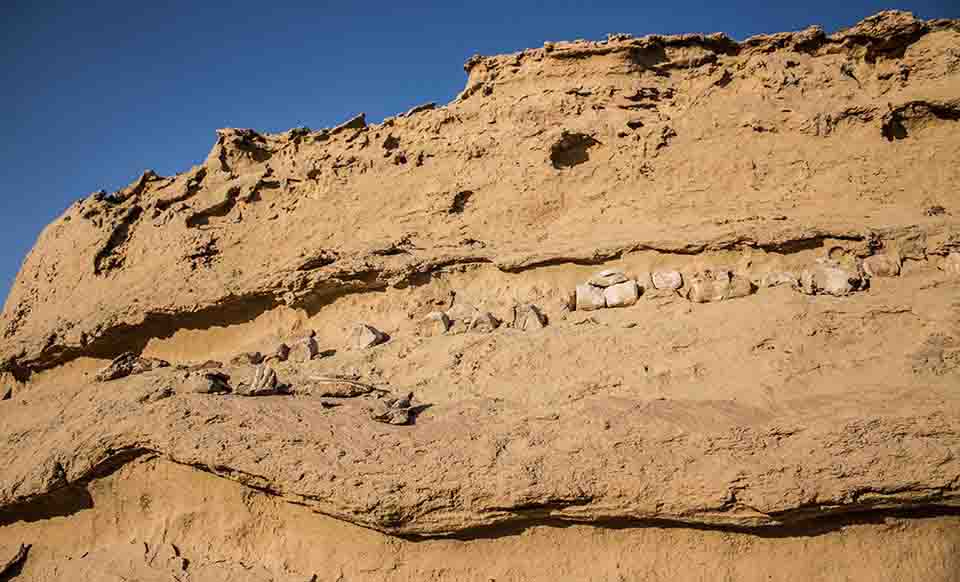
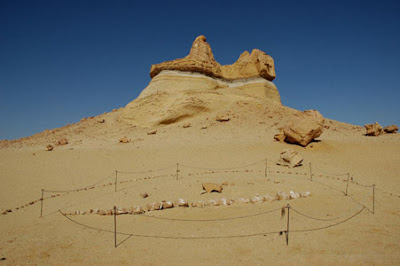
The geology of the valley gives rise to the scenery, with wind and water erosion producing spectacular cliffs and buttes. The rocks present at Wadi Al-Hitan are all Middle to Late Eocene in age and comprise three main rock units. The Gehannam Formation comprises open marine mudstones, which are largely present on the flatter ground to the East of the public park.
The rock unit that contains most of the whale fossils is the Birket Qarun Formation. This comprises yellowish open marine sandstones that form most of the cliffs and buttes. The monotony of these sandstones is broken by a white layer full of well preserved animal burrows (previously thought to be mangrove roots) and a layer of black mudstone above that. When the cliffs of the Birket Qarun Formation are followed to the East, they are replaced by Gehannam Formation mudstones, indicating a change in water depth from shallower to deeper in that direction. The tops of the higher cliffs are within the Qasr el Sagha Formation, which comprises dark mudstones alternating with limestones full of shells and represents a lagoonal environment.
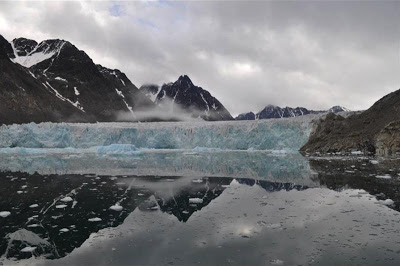
Summers on the Norwegian archipelago of Svalbard are now warmer than at any other time in the last 1,800 years, including during medieval times when parts of the northern hemisphere were as hot as, or hotter, than today, according to a new study in the journal Geology.
“The Medieval Warm Period was not as uniformly warm as we once thought–we can start calling it the Medieval Period again,” said the study’s lead author, William D’Andrea, a climate scientist at Columbia University’s Lamont-Doherty Earth Observatory. “Our record indicates that recent summer temperatures on Svalbard are greater than even the warmest periods at that time.”
The naturally driven Medieval Warm Period, from about 950 to 1250, has been a favorite time for people who deny evidence that humans are heating the planet with industrial greenhouse gases. But the climate reconstruction from Svalbard casts new doubt on that era’s reach, and undercuts skeptics who argue that current warming is also natural. Since 1987, summers on Svalbard have been 2 degrees to 2.5 degrees C (3.6 to 4.5 degrees F) hotter than they were there during warmest parts of the Medieval Warm Period, the study found.
Researchers produced the 1,800 year climate record by analyzing levels of unsaturated fats in algae buried in the sediments of Kongressvatnet lake, in western Svalbard. In colder water, algae make more unsaturated fats, or alkenones; in warmer water, they produce more saturated fats. Like pages in a book, the unsaturation level of fats can provide a record of past climate. So far, most Arctic climate records have come from ice cores that preserve only annual layers of cold-season snowfall, and thus cold-season temperatures. But lake sediments, with their record of summertime temperatures, can tell scientists how climate varied the rest of the year and in places where ice sheets are absent.
“We need both ice core and lake sediment records,” said Elisabeth Isaksson, a glaciologist at the Norwegian Polar Institute who was not involved in the study. “Here, Billy has found something that tells a different, more detailed story.”
In looking at how summers on Svalbard varied, researchers also discovered that the region was not particularly cold during another recent anomalous period–the “Little Ice Age” of the 18th and 19th centuries, when glaciers on Svalbard surged to their greatest extent in the last 10,000 years and glaciers in many parts of Western Europe also grew.They suggest that more snow, rather than colder temperatures, may have fed the growth of Svalbard glaciers.
Evidence from tree rings and ice cores shows that southern Greenland and parts of North America were warmer from 950 to 1250 than today, with the Vikings taking advantage of ice-free waters to settle Greenland. Some regions also saw prolonged drought, including California, Nevada and the Mississippi Valley, leading some scientists to coin the term Medieval Climate Anomaly to emphasize the extreme shift in precipitation rather than temperature. A natural increase in solar radiation during this time was responsible for warming parts of the northern hemisphere, with a rise in volcanic activity from 1100 to 1260 causing milder winters, University of Massachusetts scientist Ray Bradley explained in a 2003 Perspective piece in Science. Bradley is a co-author of the Svalbard lake sediment study.
Western Svalbard began to gradually warm in 1600, the researchers found, when the northern arm of the Gulf Stream, known as the West Spitsbergen Current, may have brought more tropical water to the region. In 1890, the warming began to accelerate, with researchers attributing most of the warming since about 1960 to rising industrial greenhouse gas levels. Ice cores from Svalbard, by contrast, show a slight cooling over the last 1,800 years. The conflicting evidence suggests that temperatures may have fluctuated more sharply between winter and summer, said Anne Hormes, a quaternary geologist at the University Centre in Svalbard who was not involved in the study.
D’Andrea and his colleagues dated their lake cores by analyzing grains of glass spewed by volcanoes hundreds of miles away in Iceland. Those past eruptions– Snæfellsjökullin 170, Hekla in 1104 and Öræfajökull in 1362 — all left unique chemical time markers on Svalbard’s lake sediments. “We know fairly precisely when these eruptions occurred, which is rare in the geologic record,” said study co-author Nicholas Balascio, a scientist at University of Massachusetts, Amherst.
Recent temperature measurements show that the Arctic is warming twice as fast as the rest of the planet, with sea ice this summer shrinking to its smallest extent on record. Natural feedbacks are amplifying the warming as loss of reflective sea ice causes the ocean to absorb more of the sun’s energy, melting more sea ice, which causes more energy absorption, and so on. Climate models suggest that by 2100 Svalbard will warm more than any other landmass on earth, due to a combination of sea-ice loss and changes in atmospheric and oceanic circulation, according to the International Panel on Climate Change 2007 report. In a study published last year in the journal Advances in Meteorology, Norwegian researchers estimate that average winter temperature in Svalbard could rise by as much as 10 degrees C, or 18 degrees Fahrenheit.
The study was funded by the U.S. National Science Foundation and the Keck Geology Consortium.
Note : The above story is reprinted from materials provided by The Earth Institute at Columbia University.
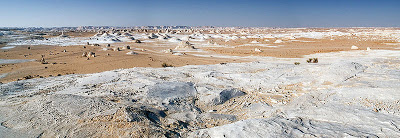
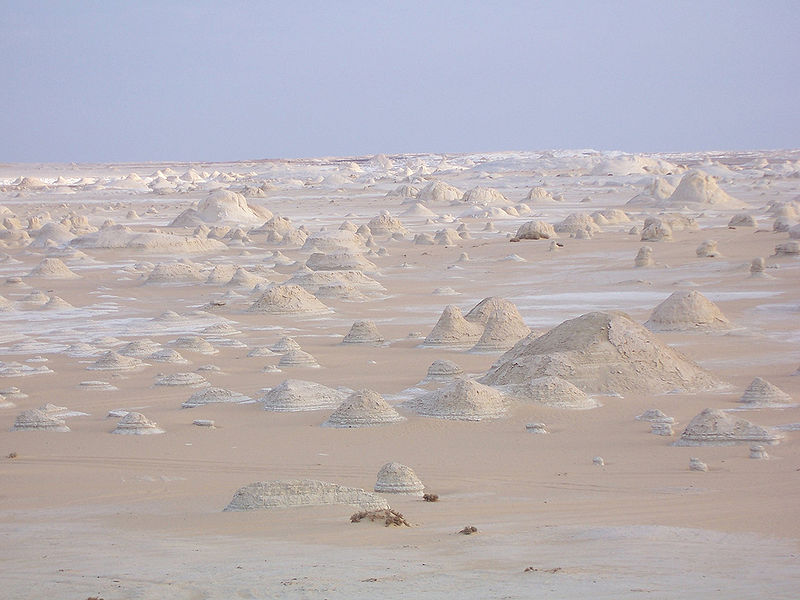
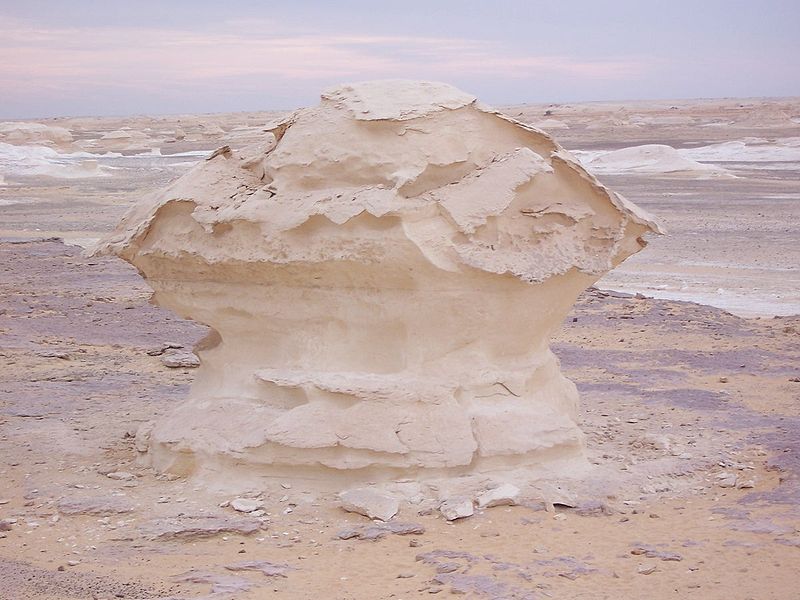
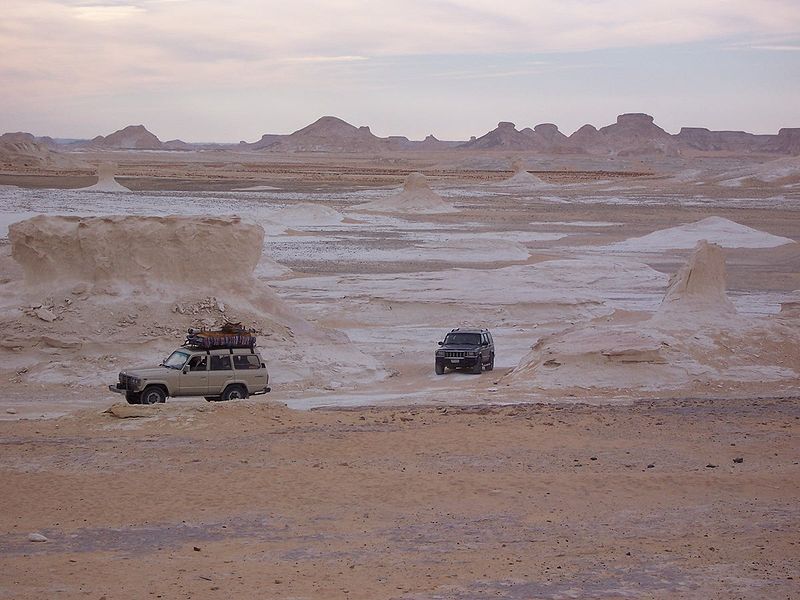
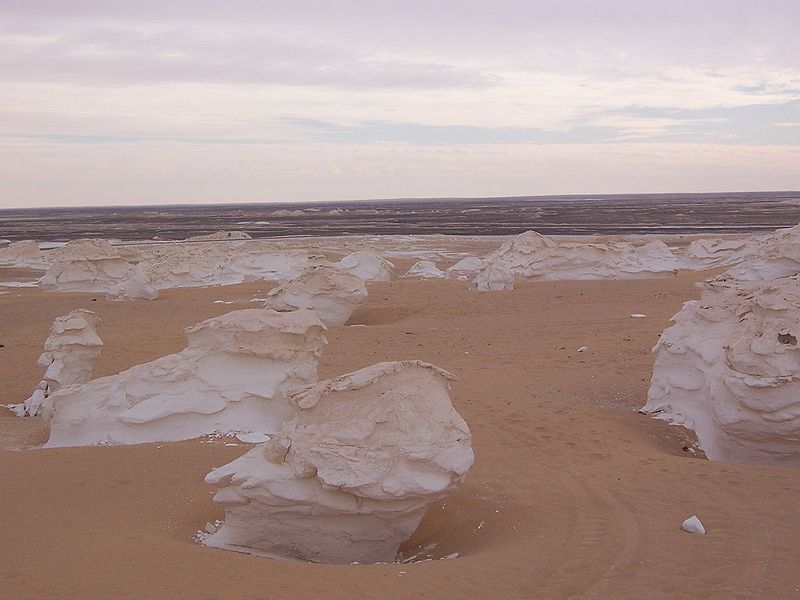
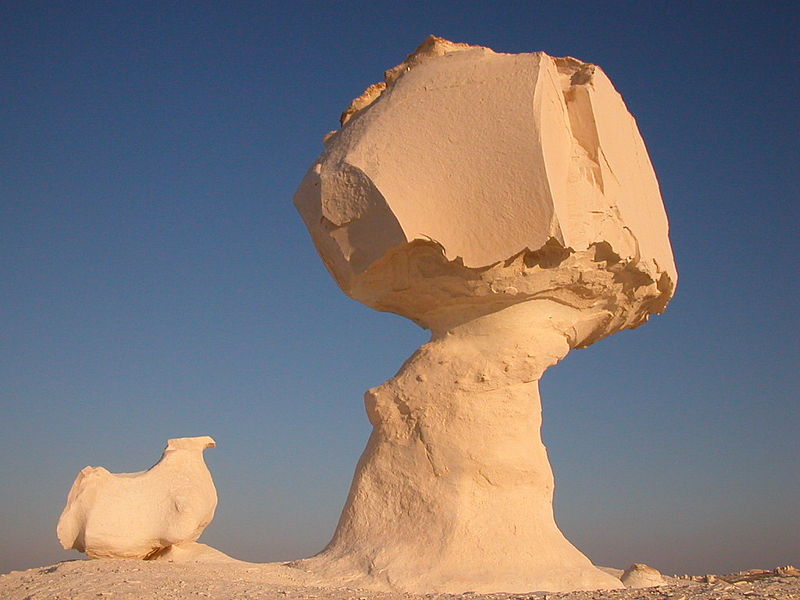
The Farafra depression is the second biggest depression by size located in Western Egypt and the smallest by population, near latitude 27.06° North and longitude 27.97° East. It is located in the Western Desert of Egypt, approximately mid-way between Dakhla and Bahariya.
Farafra has an estimated 5,000 inhabitants (2002) mainly living in the town of Farafra and is mostly inhabited by the local Bedouins. Parts of the town have complete quarters of traditional architecture, simple, smooth, unadorned, all in mud colour. Local pride has also secured endeavours to secure local culture. Also located near Farafra are the hot springs at Bir Sitta and the El-Mufid lake.
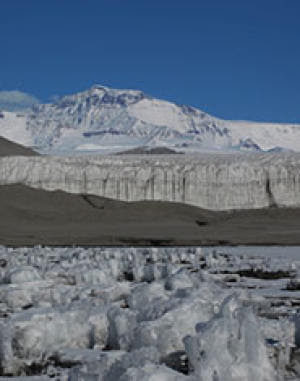 The Antarctic Ice Sheet could be an overlooked but important source of methane, a potent greenhouse gas, according to a report in the August 30 issue of Nature by an international team of scientists.
The new study demonstrates that old organic matter in sedimentary basins located beneath the Antarctic Ice Sheet may have been converted to methane by micro-organisms living under oxygen-deprived conditions. The methane could be released to the atmosphere if the ice sheet shrinks and exposes these old sedimentary basins.
Coauthor Slawek Tulaczyk, a professor of Earth and planetary sciences at UC Santa Cruz, said the project got its start five years ago in discussions with first author Jemma Wadham at the University of Bristol School of Geographical Sciences, where Tulaczyk was on sabbatical
“It is easy to forget that before 35 million years ago, when the current period of Antarctic glaciations started, this continent was teeming with life,” Tulaczyk said. “Some of the organic material produced by this life became trapped in sediments, which then were cut off from the rest of the world when the ice sheet grew. Our modeling shows that over millions of years, microbes may have turned this old organic carbon into methane.”
The science team estimated that 50 percent of the West Antarctic Ice Sheet (1 million square kilometers) and 25 percent of the East Antarctic Ice Sheet (2.5 million square kilometers) overlies pre-glacial sedimentary basins containing about 21,000 billion metric tons of organic carbon.
“This is an immense amount of organic carbon, more than ten times the size of carbon stocks in northern permafrost regions,” Wadham said. “Our laboratory experiments tell us that these sub-ice environments are also biologically active, meaning that this organic carbon is probably being metabolized to carbon dioxide and methane gas by microbes.”
The researchers numerically simulated the accumulation of methane in Antarctic sedimentary basins using an established one-dimensional hydrate model. They found that sub-ice conditions favor the accumulation of methane hydrate (that is, methane trapped within a structure of water molecules, forming a solid similar to regular ice).
They also calculated that the potential amount of methane hydrate and free methane gas beneath the Antarctic Ice Sheet could be up to 4 billion metric tons, a similar order of magnitude to some estimates made for Arctic permafrost. The predicted shallow depth of these potential reserves also makes them more susceptible to climate forcing than other methane hydrate reserves on Earth.
Coauthor Sandra Arndt, a NERC fellow at the University of Bristol, who conducted the numerical modeling, said, “It’s not surprising that you might expect to find significant amounts of methane hydrate trapped beneath the ice sheet. Just like in sub-seafloor sediments, it is cold and pressures are high, which are important conditions for methane hydrate formation.”
If substantial methane hydrate and gas are present beneath the Antarctic Ice Sheet, methane release during episodes of ice-sheet collapse could act as a positive feedback on global climate change during past and future ice-sheet retreat.
“Our study highlights the need for continued scientific exploration of remote sub-ice environments in Antarctica, because they may have far greater impact on Earth’s climate system than we have appreciated in the past,” Tulaczyk said.
Note : The above story is reprinted from materials provided by University of California – Santa Cruz.
PASADENA, Calif. — NASA’s Mars Curiosity has debuted the first recorded human voice that traveled from Earth to another planet and back.
In spoken words radioed to the rover on Mars and back to NASA’s Deep Space Network (DSN) on Earth, NASA Administrator Charles Bolden noted the difficulty of landing a rover on Mars, congratulated NASA employees and the agency’s commercial and government partners on the successful landing of Curiosity earlier this month, and said curiosity is what drives humans to explore.
“The knowledge we hope to gain from our observation and analysis of Gale Crater will tell us much about the possibility of life on Mars as well as the past and future possibilities for our own planet. Curiosity will bring benefits to Earth and inspire a new generation of scientists and explorers, as it prepares the way for a human mission in the not too distant future,” Bolden said in the recorded message.
The voice playback was released along with new telephoto camera views of the varied Martian landscape during a news conference today at NASA’s Jet Propulsion Laboratory, Pasadena, Calif.
“With this voice, another small step is taken in extending human presence beyond Earth, and the experience of exploring remote worlds is brought a little closer to us all,” said Dave Lavery, NASA Curiosity program executive. “As Curiosity continues its mission, we hope these words will be an inspiration to someone alive today who will become the first to stand upon the surface of Mars. And like the great Neil Armstrong, they will speak aloud of that next giant leap in human exploration.”
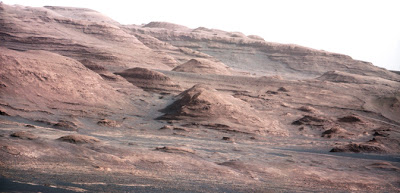
The telephoto images beamed back to Earth show a scene of eroded knobs and gulches on a mountainside, with geological layering clearly exposed. The new views were taken by the 100-millimeter telephoto lens and the 34-milllimeter wide angle lens of the Mast Camera (Mastcam) instrument. Mastcam has photographed the lower slope of the nearby mountain called Mount Sharp.
“This is an area on Mount Sharp where Curiosity will go,” said Mastcam principal investigator Michael Malin, of Malin Space Science Systems in San Diego. “Those layers are our ultimate objective. The dark dune field is between us and those layers. In front of the dark sand you see redder sand, with a different composition suggested by its different color. The rocks in the foreground show diversity — some rounded, some angular, with different histories. This is a very rich geological site to look at and eventually to drive through.”
A drive early Monday placed Curiosity directly over a patch where one of the spacecraft’s landing engines scoured away a few inches of gravelly soil and exposed underlying rock. Researchers plan to use a neutron-shooting instrument on the rover to check for water molecules bound into minerals at this partially excavated target.
During the news conference, the rover team reported the results of a test on Curiosity’s Sample Analysis at Mars (SAM) instrument, which can measure the composition of samples of atmosphere, powdered rock or soil. The amount of air from Earth’s atmosphere remaining in the instrument after Curiosity’s launch was more than expected, so a difference in pressure on either side of tiny pumps led SAM operators to stop pumping out the remaining Earth air as a precaution. The pumps subsequently worked, and a chemical analysis was completed on a sample of Earth air.
“As a test of the instrument, the results are beautiful confirmation of the sensitivities for identifying the gases present,” said SAM principal investigator Paul Mahaffy of NASA’s Goddard Space Flight Center in Greenbelt, Md. “We’re happy with this test and we’re looking forward to the next run in a few days when we can get Mars data.”
Curiosity already is returning more data from the Martian surface than have all of NASA’s earlier rovers combined.
“We have an international network of telecommunications relay orbiters bringing data back from Curiosity,” said JPL’s Chad Edwards, chief telecommunications engineer for NASA’s Mars Exploration Program. “Curiosity is boosting its data return by using a new capability for adjusting its transmission rate.”
Curiosity is 3 weeks into a two-year prime mission on Mars. It will use 10 science instruments to assess whether the selected study area ever has offered environmental conditions favorable for microbial life.
JPL manages the mission for NASA’s Science Mission Directorate in Washington. The rover was designed, developed and assembled at JPL. NASA’s DSN is an international network of antennas that supports interplanetary spacecraft missions and radio and radar astronomy observations for the exploration of the solar system and the universe. The network also supports selected Earth-orbiting missions

Mars Science Laboratory/Curiosity Mission Status Report
PASADENA, Calif. – Today, NASA’s Mars rover Curiosity fired its laser for the first time on Mars, using the beam from a science instrument to interrogate a fist-size rock called “Coronation.”
The mission’s Chemistry and Camera instrument, or ChemCam, hit the fist-sized rock with 30 pulses of its laser during a 10-second period. Each pulse delivers more than a million watts of power for about five one-billionths of a second.
The energy from the laser excites atoms in the rock into an ionized, glowing plasma. ChemCam catches the light from that spark with a telescope and analyzes it with three spectrometers for information about what elements are in the target.
“We got a great spectrum of Coronation — lots of signal,” said ChemCam Principal Investigator Roger Wiens of Los Alamos National Laboratory, N.M. “Our team is both thrilled and working hard, looking at the results. After eight years building the instrument, it’s payoff time!”
ChemCam recorded spectra from the laser-induced spark at each of the 30 pulses. The goal of this initial use of the laser on Mars was to serve as target practice for characterizing the instrument, but the activity may provide additional value. Researchers will check whether the composition changed as the pulses progressed.
If it did change, that could indicate dust or other surface material being penetrated to reveal different composition beneath the surface. The spectrometers record intensity at 6,144 different wavelengths of ultraviolet, visible and infrared light.
“It’s surprising that the data are even better than we ever had during tests on Earth, in signal-to-noise ratio,” said ChemCam Deputy Project Scientist Sylvestre Maurice of the Institut de Recherche en Astrophysique et Planetologie (IRAP) in Toulouse, France. “It’s so rich, we can expect great science from investigating what might be thousands of targets with ChemCam in the next two years.”
The technique used by ChemCam, called laser-induced breakdown spectroscopy, has been used to determine composition of targets in other extreme environments, such as inside nuclear reactors and on the sea floor, and has had experimental applications in environmental monitoring and cancer detection. Today’s investigation of Coronation is the first use of the technique in interplanetary exploration.
Curiosity landed on Mars two weeks ago, beginning a two-year mission using 10 instruments to assess whether a carefully chosen study area inside Gale Crater has ever offered environmental conditions favorable for microbial life.
ChemCam was developed, built and tested by the U.S. Department of Energy’s Los Alamos National Laboratory in partnership with scientists and engineers funded by the French national space agency, Centre National d’Etudes Spatiales (CNES) and research agency, Centre National de la Recherche Scientifique (CNRS).
NASA’s Jet Propulsion Laboratory, a division of the California Institute of Technology, Pasadena, manages the Mars Science Laboratory Project, including Curiosity, for NASA’s Science Mission Directorate, Washington. JPL designed and built the rover.
More information about Curiosity is online at http://www.nasa.gov/msl and http://mars.jpl.nasa.gov/msl/ .
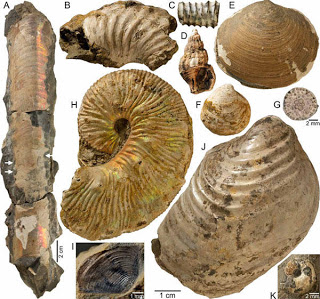
Research led by scientists at the American Museum of Natural History shows that ammonites-an extinct type of shelled mollusk that’s closely related to modern-day nautiluses and squids-made homes in the unique environments surrounding methane seeps in the seaway that once covered America’s Great Plains. The findings, published online this week in the journal Geology, provide new insights into the mode of life and habitat of these ancient animals.
Geologic formations in parts of South Dakota, Wyoming, and Montana formed as sediments were deposited in the Western Interior Seaway-a broad expanse of water that split North America into two land masses-during the Late Cretaceous, 80 to 65 million years ago. These formations are popular destinations for paleontologists looking for everything from fossilized dinosaur bones to ancient clam shells. In the last few years, groups of researchers have honed in on giant mounds of fossilized material in these areas where, many millions of years ago, methane-rich fluids migrated through the sediments onto the sea floor.
“We’ve found that these methane seeps are little oases on the sea floor, little self-perpetuating ecosystems,” said Neil Landman, lead author of the Geology paper and a curator in the Division of Paleontology at the American Museum of Natural History. “Thousands of these seeps have been found in the Western Interior Seaway, most containing a very rich fauna of bivalves, sponges, corals, fish, crinoids, and, as we’ve recently documented, ammonites.”
In the Black Hills region of South Dakota, Landman and researchers from Stony Brook University’s School of Marine and Atmospheric Science, the Black Hills Museum of Natural History, Brooklyn College, the South Dakota School of Mines and Technology, and the University of South Florida are investigating a 74-million-year-old seep with extremely well-preserved fossils.
“Most seeps have eroded significantly over the last 70 million years,” Landman said. “But this seep is part of a cliff whose face recently slumped off. As the cliff fell away, it revealed beautiful, glistening shells of all sorts of marine life.”
Studying these well-preserved shells, the researchers tried to determine the role of ammonites in the unique seep ecosystem. By analyzing the abundance of isotopes (alternative forms) of carbon, oxygen, and strontium, the group made a surprising discovery. The ammonites at the seep, once thought to be just passersby, had spent their whole lives there.
“Ammonites are generally considered mobile animals, freely coming and going” Landman said. “That’s a characteristic that really distinguishes them from other mollusks that sit on the sea floor. But to my astonishment, our analysis showed that these ammonites, while mobile, seemed to have lived their whole life at a seep, forming an integral part of an interwoven community.”
The seeps, which the researchers confirmed through oxygen isotope analysis to be “cold” (about 27 degrees Celsius, 80 degrees Fahrenheit), also likely attracted large clusters of plankton Ð the ammonites’ preferred prey.
With these findings in mind, the researchers think that the methane seeps probably played a role in the evolution of ammonites and other faunal elements in the Western Interior Seaway. The seeps might have formed small mounds that rose above the oxygen-poor sea floor, creating mini oases in a less-hospitable setting. This could be a reason why ammonites were able to inhabit the seaway over millions of years in spite of occasional environmental disturbances.
“If a nearby volcano erupted and ash covered part of the basin, it would have decimated ammonites in that area,” Landman said. “But if these communities of seep ammonites survived, they could have repopulated the rest of the seaway. These habitats might have been semi-permanent, self-sustaining sites that acted as hedges against extinction.”
Isotope analysis of strontium also revealed an interesting geologic finding: seep fluids coming into the seaway were in contact with granite, meaning that they traveled from deep in the Earth. This suggests that the Black Hills, a small mountain range in the area, already were beginning to form in the Late Cretaceous, even though the uplift wasn’t fully complete until many millions of years later.
This research was supported by the American Museum of Natural History and a National Science Foundation Research Experience for Undergraduates grant for two students from Brooklyn College to participate in the field work.
Note : The above story is reprinted from materials provided by American Museum of Natural History.