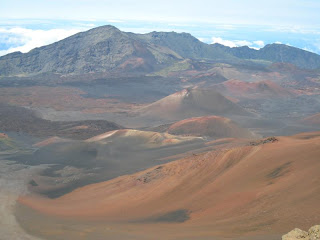
The Spinx and the Great Pyramid of Giza, Egypt are pictured here. USGS and University of Pennsylvania research shows that ancient pollen and charcoal preserved in deeply buried sediments in Egypt’s Nile Delta document the region’s ancient droughts and fires, including a huge drought 4,200 years ago associated with the demise of Egypt’s Old Kingdom, the era known as the pyramid-building time. (Credit: Benjamin P. Horton , University of Pennsylvania)
Ancient pollen and charcoal preserved in deeply buried sediments in Egypt’s Nile Delta document the region’s ancient droughts and fires, including a huge drought 4,200 years ago associated with the demise of Egypt’s Old Kingdom, the era known as the pyramid-building time.
“Humans have a long history of having to deal with climate change,” said Christopher Bernhardt, a researcher with the U.S. Geological Survey. “Along with other research, this study geologically reveals that the evolution of societies is sometimes tied to climate variability at all scales — whether decadal or millennial.”
Bernhardt conducted this research as part of his Ph.D. at the University of Pennsylvania, along with Benjamin Horton, an associate professor in Penn’s Department of Earth and Environmental Science. Jean-Daniel Stanley at the Smithsonian Institution also participated in the study, published in July’s edition of Geology.
“Even the mighty builders of the ancient pyramids more than 4,000 years ago fell victim when they were unable to respond to a changing climate,” said USGS Director Marcia McNutt. “This study illustrates that water availability was the climate-change Achilles Heel then for Egypt, as it may well be now, for a planet topping seven billion thirsty people.”
The researchers used pollen and charcoal preserved in a Nile Delta sediment core dating from 7,000 years ago to the present to help resolve the physical mechanisms underlying critical events in ancient Egyptian history.
They wanted to see if changes in pollen assemblages would reflect ancient Egyptian and Middle East droughts recorded in archaeological and historical records. The researchers also examined the presence and amount of charcoal because fire frequency often increases during times of drought, and fires are recorded as charcoal in the geological record. The scientists suspected that the proportion of wetland pollen would decline during times of drought and the amount of charcoal would increase.
And their suspicions were right.
Large decreases in the proportion of wetland pollen and increases in microscopic charcoal occurred in the core during four different times between 3,000 and 6,000 years ago. One of those events was the abrupt and global mega-drought of around 4,200 years ago, a drought that had serious societal repercussions, including famines, and which probably played a role in the end of Egypt’s Old Kingdom and affected other Mediterranean cultures as well.
“Our pollen record appears very sensitive to the decrease in precipitation that occurred in the mega-drought of 4,200 years ago,” Bernhardt said. “The vegetation response lasted much longer compared with other geologic proxy records of this drought, possibly indicating a sustained effect on delta and Nile basin vegetation.”
Similarly, pollen and charcoal evidence recorded two other large droughts: one that occurred some 5,000 to 5,500 years ago and another that occurred around 3,000 years ago.
These events are also recorded in human history — the first one started some 5,000 years ago when the unification of Upper and Lower Egypt occurred and the Uruk Kingdom in modern Iraq collapsed. The second event, some 3,000 years ago, took place in the eastern Mediterranean and is associated with the fall of the Ugarit Kingdom and famines in the Babylonian and Syrian Kingdoms.
“The study geologically demonstrates that when deciphering past climates, pollen and other micro-organisms, such as charcoal, can augment or verify written or archaeological records — or they can serve as the record itself if other information doesn’t exist or is not continuous,” said Horton.
This study, Nile delta response to Holocene climate variability, was published in the July edition of Geology, and was authored by Christopher Bernhardt, USGS; Benjamin Horton, Penn; and Jean-Daniel Stanley, Smithsonian Institution. Support for the work came from the University of Pennsylvania, the U.S. Geological Survey, and the Smithsonian Institution.
Note : The above story is reprinted from materials provided by United States Geological Survey.
A new study has successfully reconstructed temperature from the deep sea to reveal how global ice volume has varied over the glacial-interglacial cycles of the past 1.5 million years.
Scientists have announced a major breakthrough in understanding Earth’s climate machine by reconstructing highly accurate records of changes in ice volume and deep-ocean temperatures over the last 1.5 million years.
The study, which is reported in the journal Science, offers new insights into a decades-long debate about how the shifts in Earth’s orbit relative to the sun have taken Earth into and out of an ice-age climate.
Being able to reconstruct ancient climate change is a critical part of understanding why the climate behaves the way it does. It also helps us to predict how the planet might respond to human-made changes, such as the injection of large quantities of carbon dioxide into the atmosphere, in the future.
Unfortunately, scientists trying to construct an accurate picture of how such changes caused past climatic shifts have been thwarted by the fact that the most readily available marine geological record of ice-ages — changes in the ratio of oxygen isotopes (Oxygen 18 to Oxygen 16) preserved in tiny calcareous deep sea fossils called foraminifera — is compromised.
This is because the isotope record shows the combined effects of both deep sea temperature changes, and changes in the amount of ice volume. Separating these has in the past proven difficult or impossible, so researchers have been unable to tell whether changes in Earth’s orbit were affecting the temperature of the ocean more than the amount of ice at the Poles, or vice-versa.
The new study, which was carried out by researchers in the University of Cambridge Department of Earth Sciences, appears to have resolved this problem by introducing a new set of temperature-sensitive data. This allowed them to identify changes in ocean temperatures alone, subtract that from the original isotopic data set, and then build what they describe as an unprecedented picture of climatic change over the last 1.5 million years — a record of changes in both oceanic temperature and global ice volume.
Included in this is a much fuller representation of what happened during the “Mid-Pleistocene Transition” (MPT) — a major change in Earth’s climate system which took place sometime between 1.25 million and 600 thousand years ago. Before the MPT, the alternation between glacial periods of extreme cold, and warmer interglacials, happened at intervals of approximately 41,000 years. After the MPT, the major cycles became much longer, regularly taking 100,000 years. The second pattern of climate cycles is the one we are in now. Interestingly, this change occurred with little or no orbital forcing.
“Previously, we didn’t really know what happened during this transition, or on either side of it,” Professor Harry Elderfield, who led the research team, said. “Before you separate the ice volume and temperature signals, you don’t know whether you’re seeing a climate record in which ice volume changed dramatically, the oceans warmed or cooled substantially, or both.”
“Now, for the first time, we have been able to separate these two components, which means that we stand a much better chance of understanding the mechanisms involved. One of the reasons why that is important, is because we are making changes to the factors that influence the climate now. The only way we can work out what the likely effects of that will be in detail is by finding analogues in the geological past, but that depends on having an accurate picture of the past behaviour of the climate system.”
Researchers have developed more than 30 different models for how these features of the climate might have changed in the past, in the course of a debate which has endured for more than 60 years since pioneering work by Nobel Laureate Harold Urey in 1946. The new study helps resolve these problems by introducing a new dataset to the picture — the ratio of magnesium (Mg) to calcium (Ca) in foraminifera. Because it is easier for magnesium to be incorporated at higher temperatures, larger quantities of magnesium in the tiny marine fossils imply that the deep sea temperature was higher at that point in geological time.
The Mg/Ca dataset was taken from the fossil record contained in cores drilled on the Chatham Rise, an area of ocean east of New Zealand. It allowed the Cambridge team to map ocean temperature change over time. Once this had been done, they were able to subtract that information from the oxygen isotopic record. “The calculation tells us the difference between what water temperature was doing and what the ice sheets were doing across a 1.5 million year period,” Professor Elderfield explained.
The resulting picture shows that ice volume has changed much more dramatically than ocean temperatures in response to changes in orbital geometry. Glacial periods during the 100,000-year cycles have been characterised by a very slow build-up of ice which took thousands of years, the result of ice volume responding to orbital change far more slowly than the ocean temperatures reacted. Ocean temperature change, however, reached a lower limit, probably because the freezing point of sea water put a restriction on how cold the deep ocean could get.
In addition, the record shows that the transition from 41,000-year cycles to 100,000-year cycles, the characteristic changeover of the MPT, was not as gradual as previously thought. In fact, the build-up of larger ice sheets, associated with longer glacials, appears to have begun quite suddenly, around 900,000 years ago. The pattern of Earth’s response to orbital forcing changed dramatically during this “900,000 year event,” as the paper puts it.
The research team now plan to apply their method to the study of deep-sea temperatures elsewhere to investigate how orbital changes affected the climate in different parts of the world.
“Any uncertainty about Earth’s climate system fuels the sense that we don’t really know how the climate is behaving, either in response to natural effects or those which are man-made,” Professor Elderfield added. “If we can understand how earlier changes were initiated and what the impacts were, we stand a much better chance of being able to predict and prepare for changes in the future.”
Note : The above story is reprinted from materials provided by University of Cambridge, via EurekAlert!, a service of AAAS. The original story is licensed under a Creative Commons license.
A type of fault formed when the hanging wall fault block moves up along a fault surface relative to the footwall. Such movement can occur in areas where the Earth’s crust is compressed. A thrust fault, sometimes called an overthrust if the displacement is particularly great, is a reverse fault in which the fault plane has a shallow dip, typically much less than 45o.
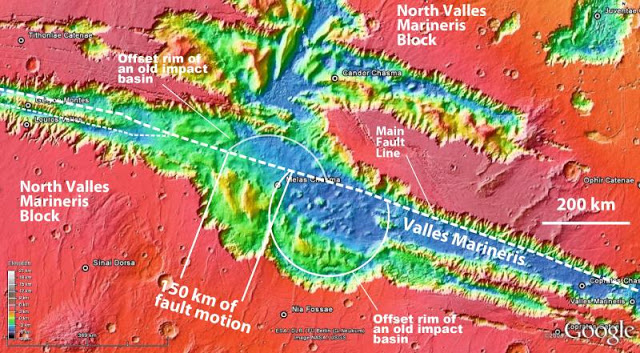
view of central segment of Mars’ Valles Marineris, in which an older circular basin created by an impact is offset for about 93 miles (150 kilometers) by a fault. (Credit: Image from Google Mars created by MOLA Science Team)
For years, many scientists had thought that plate tectonics existed nowhere in our solar system but on Earth. Now, a UCLA scientist has discovered that the geological phenomenon, which involves the movement of huge crustal plates beneath a planet’s surface, also exists on Mars.
“Mars is at a primitive stage of plate tectonics. It gives us a glimpse of how the early Earth may have looked and may help us understand how plate tectonics began on Earth,” said An Yin, a UCLA professor of Earth and space sciences and the sole author of the new research.
Yin made the discovery during his analysis of satellite images from a NASA spacecraft known as THEMIS (Time History of Events and Macroscale Interactions during Substorms) and from the HIRISE (High Resolution Imaging Science Experiment) camera on NASA’s Mars Reconnaissance Orbiter. He analyzed about 100 satellite images — approximately a dozen were revealing of plate tectonics.
Yin has conducted geologic research in the Himalayas and Tibet, where two of Earth’s seven major plates divide.
“When I studied the satellite images from Mars, many of the features looked very much like fault systems I have seen in the Himalayas and Tibet, and in California as well, including the geomorphology,” said Yin, a planetary geologist.
For example, he saw a very smooth, flat side of a canyon wall, which can be generated only by a fault, and a steep cliff, comparable to cliffs in California’s Death Valley, which also are generated by a fault. Mars has a linear volcanic zone, which Yin said is a typical product of plate tectonics.
“You don’t see these features anywhere else on other planets in our solar system, other than Earth and Mars,” said Yin, whose research is featured as the cover story in the August issue of the journal Lithosphere.
The surface of Mars contains the longest and deepest system of canyons in our solar system, known as Valles Marineris (Latin for Mariner Valleys and named for the Mariner 9 Mars orbiter of 1971-72, which discovered it). It is nearly 2,500 miles long — about nine times longer than Earth’s Grand Canyon. Scientists have wondered for four decades how it formed. Was it a big crack in Mars’ shell that opened up?
“In the beginning, I did not expect plate tectonics, but the more I studied it, the more I realized Mars is so different from what other scientists anticipated,” Yin said. “I saw that the idea that it is just a big crack that opened up is incorrect. It is really a plate boundary, with horizontal motion. That is kind of shocking, but the evidence is quite clear.
“The shell is broken and is moving horizontally over a long distance. It is very similar to the Earth’s Dead Sea fault system, which has also opened up and is moving horizontally.”
The two plates divided by Mars’ Valles Marineris have moved approximately 93 miles horizontally relative to each other, Yin said. California’s San Andreas Fault, which is over the intersection of two plates, has moved about twice as much — but Earth is about twice the size of Mars, so Yin said they are comparable.
Yin, whose research is partly funded by the National Science Foundation, calls the two plates on Mars the Valles Marineris North and the Valles Marineris South.
“Earth has a very broken ‘egg shell,’ so its surface has many plates; Mars’ is slightly broken and may be on the way to becoming very broken, except its pace is very slow due to its small size and, thus, less thermal energy to drive it,” Yin said. “This may be the reason Mars has fewer plates than on Earth.”
Mars has landslides, and Yin said a fault is shifting the landslides, moving them from their source.
Does Yin think there are Mars-quakes?
“I think so,” he said. “I think the fault is probably still active, but not every day. It wakes up every once in a while, over a very long duration — perhaps every million years or more.”
Yin is very confident in his findings, but mysteries remain, he said, including how far beneath the surface the plates are located.
“I don’t quite understand why the plates are moving with such a large magnitude or what the rate of movement is; maybe Mars has a different form of plate tectonics,” Yin said. “The rate is much slower than on Earth.”
Earth has a broken shell with seven major plates; pieces of the shell move, and one plate may move over another. Yin is doubtful that Mars has more than two plates.
“We have been able to identify only the two plates,” he said. “For the other areas on Mars, I think the chances are very, very small. I don’t see any other major crack.”
Did the movement of Valles Marineris North and Valles Marineris South create the enormous canyons on Mars? What led to the creation of plate tectonics on Earth?
Yin, who will continue to study plate tectonics on Mars, will answer those questions in a follow-up paper that he also plans to publish in the journal Lithosphere.
Reference:
A. Yin. Structural analysis of the Valles Marineris fault zone: Possible evidence for large-scale strike-slip faulting on Mars. Lithosphere, 2012; 4 (4): 286 DOI: 10.1130/L192.1
Note : The above story is reprinted from materials provided by University of California, Los Angeles. The original article was written by Stuart Wolpert.
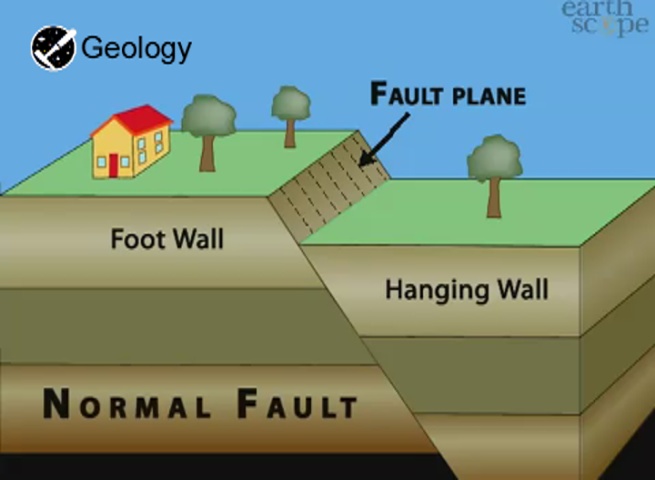
A type of fault in which the hanging wall moves down relative to the footwall, and the fault surface dips steeply, commonly from 50o to 90o. Groups of normal faults can produce horst and graben topography, or a series of relatively high- and low-standing fault blocks, as seen in areas where the crust is rifting or being pulled apart by plate tectonic activity. A growth fault is a type of normal fault that forms during sedimentation and typically has thicker strata on the downthrown hanging wall than the footwall.
Video :
Photos :
Normal fault. This outcrop of the eolian Entrada formation of Colorado (USA) contains numerous normal faults.Photo courtesy of T.N. Diggs.
Conjugate normal faults, Black Mountains frontal fault zone, Death Valley,California. | Photo credit: Martin Miller
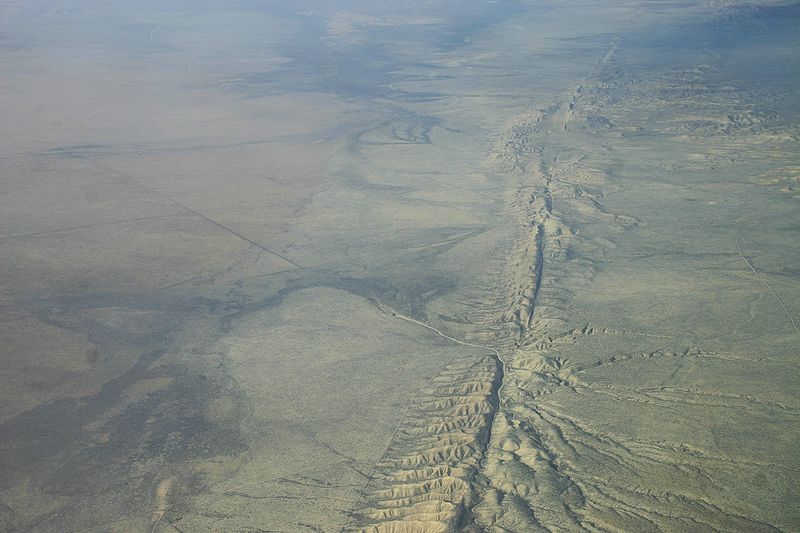
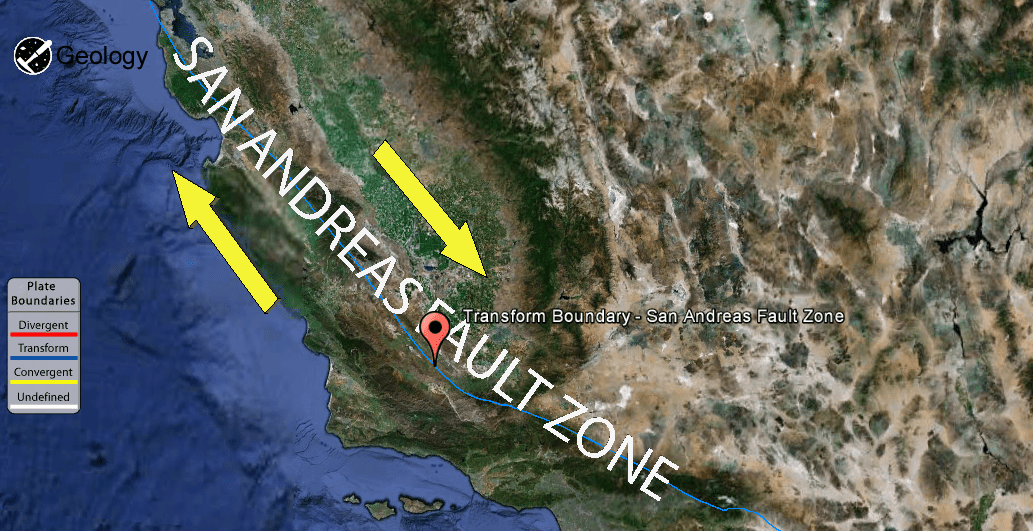
The San Andreas Fault is a continental transform fault that runs a length of roughly 810 miles (1,300 km) through California in the United States. The fault’s motion is right-lateral strike-slip (horizontal motion). It forms the tectonic boundary between the Pacific Plate and the North American Plate
The fault was first identified in Northern California by UC Berkeley geology professor Andrew Lawson in 1895 and named by him after a small lake which lies in a linear valley formed by the fault just south of San Francisco, the Laguna de San Andreas. After the 1906 San Francisco Earthquake, Lawson also discovered that the San Andreas Fault stretched southward into southern California. Large-scale (hundreds of miles) lateral movement along the fault was first proposed in a 1953 paper by geologists Mason Hill and Thomas Dibblee
Segments of the Fault
The San Andreas Fault can be divided into three segments.
Southern segment
The southern segment (known as the Mojave segment) begins near Bombay Beach, California. Box Canyon, near the Salton Sea, contains upturned strata resulting from that section of the fault. The fault then runs along the southern base of the San Bernardino Mountains, crosses through the Cajon Pass and continues to run northwest along the northern base of the San Gabriel Mountains. These mountains are a result of movement along the San Andreas Fault and are commonly called the Transverse Range. In Palmdale, a portion of the fault is easily examined as a roadcut for the Antelope Valley Freeway runs directly through it.
After crossing through Frazier Park, the fault begins to bend northward. This area is referred to as the “Big Bend” and is thought to be where the fault locks up in Southern California as the plates try to move past each other. This section of the fault has an earthquake-recurrence interval of roughly 140–160 years. Northwest of Frazier Park, the fault runs through the Carrizo Plain, a long, treeless plain within which much of the fault is plainly visible. The Elkhorn Scarp defines the fault trace along much of its length within the plain.
Research has shown that the Southern segment, which stretches from Parkfield in Monterey County, California all the way down to the Salton Sea, is capable of a Richter scale 8.1 earthquake. An earthquake of that size on the Southern segment (which, at its closest, is 40 miles away from Los Angeles) would kill thousands of people in Los Angeles, San Bernandino, Riverside, and other areas, and cause hundreds of billions of dollars in property and economic damage
Central segment
The central segment of the San Andreas fault runs in a northwestern direction from Parkfield to Hollister. While the southern section of the fault and the parts through Parkfield experience earthquakes, the rest of the central section of the fault exhibits a phenomenon called aseismic creep, where the fault slips continuously without causing earthquakes.
Northern segment
The northern segment of the fault runs from Hollister, through the Santa Cruz Mountains, epicenter of the 1989 Loma Prieta earthquake, then on up the San Francisco Peninsula, where it was first identified by Professor Lawson in 1895, then offshore at Daly City near Mussel Rock. This is the approximate location of the epicenter of the 1906 San Francisco earthquake. The fault returns onshore at Bolinas Lagoon just north of Stinson Beach in Marin County. It returns underwater through the linear trough of Tomales Bay which separates the Point Reyes Peninsula from the mainland, runs just east of the Bodega Heads through Bodega Bay and back underwater, returning onshore at Fort Ross. (In this region around the San Francisco Bay Area several significant “sister faults” run more-or-less parallel, and each of these can create significantly destructive earthquakes.) From Fort Ross the northern segment continues overland, forming in part a linear valley through which the Gualala River flows. It goes back offshore at Point Arena. After that, it runs underwater along the coast until it nears Cape Mendocino, where it begins to bend to the west, terminating at the Mendocino Triple Junction.
Evolution
The evolution of the San Andreas dates back to the mid Cenozoic, to about 30 Mya (million years ago). At this time, a spreading center between the Pacific Plate and the Farallon Plate (which is now mostly subducted, with remnants including the Juan de Fuca Plate, Rivera Plate, Cocos Plate, and the Nazca Plate) was beginning to interact with the subduction zone off the western coast of North America. The relative motion between the Pacific and North American Plates was different from the relative motion between the Farallon and North American Plates, so when the spreading ridge was ‘subducted’, a new relative motion caused a new style of deformation. This style is chiefly the San Andreas Fault, but also includes a possible driver for the deformation of the Basin and Range, separation of Baja California, and rotation of the Transverse Range.
The San Andreas Fault proper, at least the Southern Segment, has only existed for about 5 million years. The first known incarnation of the southern part of the fault was Clemens Well-Fenner-San Francisquito fault zone around 22–13 Ma. This system added the San Gabriel Fault as a primary focus of movement between 10–5 Ma. Currently, it is believed that the modern San Andreas will eventually transfer its motion toward a fault within the Eastern California Shear Zone. This complicated evolution, especially along the southern segment, is mostly caused by either the “Big Bend” and/or a difference in the motion vector between the plates and the trend of the fault(s).
Plate movement
All land west of the fault on the Pacific Plate is moving slowly to the northwest while all land east of the fault is moving southwest (relatively southeast as measured at the fault) under the influence of plate tectonics. The rate of slippage averages approximately 33 to 37 millimetres (1.3 to 1.5 in) annually across California.
The westward component of the motion of the North American Plate creates compressional forces which are expressed as uplift in the Coast Ranges. Likewise, the northwest motion of the Pacific Plate creates significant compressional forces where the North American Plate stands in its way, creating the Transverse Ranges in Southern California, and to a lesser, but still significant, extent the Santa Cruz Mountains, site of the Loma Prieta Earthquake of 1989.Studies of the relative motions of the Pacific and North American plates have shown that only about 75 percent of the motion can be accounted for in the movements of the San Andreas and its various branch faults. The rest of the motion has been found in an area east of the Sierra Nevada mountains called the Walker Lane or Eastern California Shear Zone. The reason for this is not as yet clear, although several hypotheses have been offered and research is ongoing. One hypothesis which gained some currency following the Landers Earthquake in 1992 is that the plate boundary may be shifting eastward, away from the San Andreas to the Walker Lane.Assuming the plate boundary does not change as hypothesized, projected motion indicates that the landmass west of the San Andreas Fault, including Los Angeles, will eventually slide past San Francisco, then continue northwestward toward the Aleutian Trench, over a period of perhaps twenty million years.
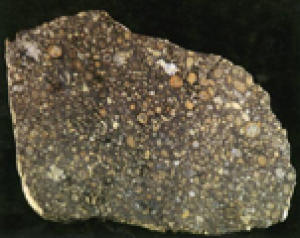
This is a cross-section of a chondritic meteorite. (Credit: Image courtesy of Carnegie Institution)
Scientists have long believed that comets and, or a type of very primitive meteorite called carbonaceous chondrites were the sources of early Earth’s volatile elements — which include hydrogen, nitrogen, and carbon — and possibly organic material, too. Understanding where these volatiles came from is crucial for determining the origins of both water and life on the planet. New research led by Carnegie’s Conel Alexander focuses on frozen water that was distributed throughout much of the early Solar System, but probably not in the materials that aggregated to initially form Earth.
The evidence for this ice is now preserved in objects like comets and water-bearing carbonaceous chondrites. The team’s findings contradict prevailing theories about the relationship between these two types of bodies and suggest that meteorites, and their parent asteroids, are the most-likely sources of Earth’s water. Their work is published July 12 by Science Express.
Looking at the ratio of hydrogen to its heavy isotope deuterium in frozen water (H2O), scientists can get an idea of the relative distance from the Sun at which objects containing the water were formed. Objects that formed farther out should generally have higher deuterium content in their ice than objects that formed closer to the Sun, and objects that formed in the same regions should have similar hydrogen isotopic compositions. Therefore, by comparing the deuterium content of water in carbonaceous chondrites to the deuterium content of comets, it is possible to tell if they formed in similar reaches of the Solar System.
It has been suggested that both comets and carbonaceous chondrites formed beyond the orbit of Jupiter, perhaps even at the edges of our Solar System, and then moved inward, eventually bringing their bounty of volatiles and organic material to Earth. If this were true, then the ice found in comets and the remnants of ice preserved in carbonaceous chondrites in the form of hydrated silicates, such as clays, would have similar isotopic compositions.
Alexander’s team included Carnegie’s Larry Nitler, Marilyn Fogel, and Roxane Bowden, as well as Kieren Howard from the Natural History Museum in London and Kingsborough Community College of the City University of New York and Christopher Herd of the University of Alberta. They analyzed samples from 85 carbonaceous chondrites, and were able to show that carbonaceous chondrites likely did not form in the same regions of the Solar System as comets because they have much lower deuterium content. If so, this result directly contradicts the two most-prominent models for how the Solar System developed its current architecture.
The team suggests that carbonaceous chondrites formed instead in the asteroid belt that exists between the orbits of Mars and Jupiter. What’s more, they propose that most of the volatile elements on Earth arrived from a variety of chondrites, not from comets.
“Our results provide important new constraints for the origin of volatiles in the inner Solar System, including the Earth,” Alexander said. “And they have important implications for the current models of the formation and orbital evolution of the planets and smaller objects in our Solar System.”
Note : The above story is reprinted from materials provided by Carnegie Institution.
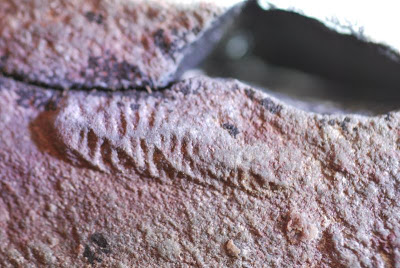
Caption: Juvenile example of the rangeomorph fossil Charnia, measuring just 17 millimetres in length. Note the fine detail of the branches. (Credit: OU/Jack Matthews)
A volcanic eruption around 579 million years ago buried a ‘nursery’ of the earliest-known animals under a Pompeii-like deluge of ash, preserving them as fossils in rocks in Newfoundland, new research suggests.
A team from the Universities of Oxford and Cambridge, in collaboration with the Memorial University of Newfoundland, looked for evidence of life from the mysterious Ediacaran period (635-542 million years ago) in which the first ‘animals’ — complex multicellular organisms — appeared.
The team discovered over 100 fossils of what are believed to be ‘baby’ rangeomorphs; bizarre frond-shaped organisms which lived 580-550 million years ago and superficially resemble sea-pen corals but, on closer inspection, are unlike any creature alive today. This ‘nursery’ of baby rangeomorphs was found in rocks at the Mistaken Point Ecological Reserve in Newfoundland,Canada.
A report of the research will appear in the July issue of the Journal of the Geological Society.
The fossil remains of rangeomorphs are often described as ‘fern-like’ and where exactly they fit in the tree of life is unclear. Because they lived deep beneath the ocean where there would have been no light they are not thought to be plants but they may not have had all of the characteristics of animals. Mysteriously, their frond-shaped body-plan, which might have helped them gather oxygen or food, does not survive into the Cambrian period (542-488 million years ago).
The fossilised ‘babies’ we found are all less than three centimetres long and are often as small as six millimetres; many times smaller than the ‘parent’ forms, seen in neighbouring areas, which can reach up to two metres in length,’ said Professor Martin Brasier of Oxford University’s Department of Earth Sciences, one of the authors of the report. ‘This new discovery comes from the very bottom of the fossil-bearing rocks, making it one of the oldest bedding planes to preserve ‘animal’ fossils in the whole of the geological record.
‘We think that, around 579 million years ago, an underwater ‘nursery’ of baby Ediacaran fronds was overwhelmed, Pompeii-style, by an ash fall from a volcanic eruption on a nearby island that smothered and preserved them for posterity.’
Dr Alexander Liu of Cambridge University’s Department of Earth Sciences, an author of the report, said: ‘These juveniles are exceptionally well preserved, and include species never before found in rocks of this age, increasing the known taxonomic diversity of the earliest Ediacaran fossil sites. The discovery confirms a remarkable variety of rangeomorph fossil forms so early in their evolutionary history.’
The find reinforces the idea that ‘life got large’ around 580 million years ago, with the advent of these frond-like forms, some of which grew up — in better times — to reach almost two metres in length.
Professor Brasier said: ‘We are now exploring even further back in time to try and discover exactly when these mysterious organisms first appeared and learn more about the processes that led to their diversification in an ‘Ediacaran explosion’ that may have mirrored the profusion of new life forms we see in the Cambrian.’
Note : The above story is reprinted from materials provided by University of Oxford.
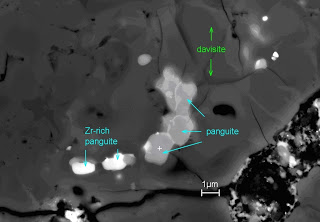
Panguite is embedded in a piece of the Allende meteorite. – Chi Ma / Caltech
In 1969, an exploding fireball tore through the sky over Mexico, scattering thousands of pieces of meteorite across the state of Chihuahua. More than 40 years later, the Allende meteorite is still serving the scientific community as a rich source of information about the early stages of our solar system’s evolution. Recently, scientists from the California Institute of Technology (Caltech) discovered a new mineral embedded in the space rock-one they believe to be among the oldest minerals formed in the solar system.
Dubbed panguite, the new titanium oxide is named after Pan Gu, the giant from ancient Chinese mythology who established the world by separating yin from yang to create the earth and the sky. The mineral and the mineral name have been approved by the International Mineralogical Association’s Commission on New Minerals, Nomenclature and Classification. A paper outlining the discovery and the properties of this new mineral will be published in the July issue of the journal American Mineralogist, and is available online now.
“Panguite is an especially exciting discovery since it is not only a new mineral, but also a material previously unknown to science,” says Chi Ma, a senior scientist and director of the Geological and Planetary Sciences division’s Analytical Facility at Caltech and corresponding author on the paper.
The Allende meteorite is the largest carbonaceous chondrite-a diverse class of primitive meteorites-ever found on our planet and is considered by many the best-studied meteorite in history. As a result of an ongoing nanomineralogy investigation of primitive meteorites-which Ma has been leading since 2007-nine new minerals, including panguite, have been found in the Allende meteorite. Some of those new finds include the minerals allendeite, hexamolybdenum, tistarite, and kangite. Nanomineralogy looks at tiny particles of minerals and the minuscule features within those minerals.
“The intensive studies of objects in this meteorite have had a tremendous influence on current thinking about processes, timing, and chemistry in the primitive solar nebula and small planetary bodies,” says coauthor George Rossman, the Eleanor and John R. McMillan Professor of Mineralogy at Caltech.
Panguite was observed first under a scanning electron microscope in an ultra-refractory inclusion embedded in the meteorite. Refractory inclusions are among the first solid objects formed in our solar system, dating back to before the formation of Earth and the other planets. “Refractory” refers to the fact that these inclusions contain minerals that are stable at high temperatures and in extreme environments, which attests to their likely formation as primitive, high-temperature liquids produced by the solar nebula.
According to Ma, studies of panguite and other newly discovered refractory minerals are continuing in an effort to learn more about the conditions under which they formed and subsequently evolved. “Such investigations are essential to understand the origins of our solar system,” he says.
Note: This story has been adapted from a news release issued by the California Institute of Technology
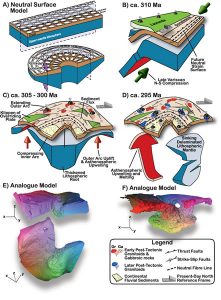
(A) Block diagram depicting the effect of lithospheric bending around a vertical axis and the resultant strain field (modified tangential longitudinal strain). Strain ellipses depict arc-parallel shortening in the inner arc and arc-parallel stretching in the outer arc. Note the different behavior of the mantle lithosphere in the inner and outer arcs and the increase in thickness of mantle lithosphere below the inner arc and thinning below the outer arc. (B) Snapshot illustration of arc development starting with a linear belt resulting from a Gondwana–Laurentia collision. (C) Second snapshot illustrating oroclinal bending, which causes lithospheric stretching in the outer arc and thickening beneath the inner arc (Gutiérrez-Alonso et al., 2004). (D) The final stage of oroclinal bending, depicting delamination and collapse of thickened lithospheric root beneath the inner arc, replacement of sinking lithosphere by upwelling asthenospheric mantle, and associated magmatism in the inner and outer arc regions. (E) Two tomographic views of the analogue modeled mantle lithosphere geometry after buckling around a vertical axis where the lithospheric root is developed under the inner arc (top—frontal view from the concave part of the model; bottom—view from below); 3-D coordinate axes given. (F) Tomographic 3-D image of the delaminated lithospheric root obtained with analogue modeling; 3-D coordinate axes given.
Mountain belts on Earth are most commonly formed by collision of one or more tectonic plates. The process of collision, uplift, and subsequent erosion of long mountain belts often produces profound global effects, including changes in regional and global climates, as well as the formation of important economic resources, including oil and gas reservoirs and ore deposits. Understanding the formation of mountain belts is thus a very important element of earth science research.
One common but poorly understood aspect of mountain belts are the many examples of curved (arcuate) mountain ranges. The Appalachian range in Pennsylvania, the Rocky Mountains in central Montana, the Blue Mountains in Oregon, the Bolivian Andes of South America, and the Cantabrian Arc in Spain and northern Africa are among many examples of noticeably curved mountain belts.
The cause of these curvy mountains is among the oldest topics of research in geology, and there is still extensive debate on what mechanisms are most important for making a curvy mountain range.
A common question is whether these presently curvy mountain ranges were originally straight and then later bent or whether they were uplifted in more or less their present shape.
Another important aspect of the origin of these curved mountain ranges is the thickness of the rock units involved in their formation. Some workers have proposed that these ranges are composed of relatively thin slices of crustal rocks (limited to several kilometers in thickness), while others have argued that at least some of these curvy ranges involve the entire thickness of the lithospheric plates (30 to 100 km thick). One of the most promising ways to answer these questions utilizes comparisons of the orientation of structural features in rocks (fault planes and joints), records of the ancient magnetic field directions found in rocks, and the timing of deformation and uplift of the mountain belts.
An international group of researchers from Spain, Canada, and the United States, led by Dr. Gabriel Gutiérrez-Alonso, have presented a compelling study of one of the best examples of curved mountain ranges: the Cantabrian Arc in Spain and northern Africa. They have compiled an extensive collection of fault and joint orientation data and directions of the ancient geomagnetic field recorded by Paleozoic rocks collected in Spain.
The Cantabrian Arc was formed during the collision of a southern set of continents (Gondwanaland [present day Africa-South America-Australia-India-Antarctica]) with a northern set of continents (Laurentia [present day North America and Eurasia]) to produce the supercontinent Pangea. In a nutshell, their combined study has found that the curved pattern of the Cantabrian Arc was produced by the bending of an originally straight mountain range.
The main line of evidence supporting this view is the patterns of rotation that are obtained from the directions of the ancient geomagnetic field recorded by the rocks of these mountain ranges. Combined with an analysis of the faults and joints in the rocks, and the ages of rocks that have variations in the amount of rotation indicated by the magnetic directions, the age of the bending of the Cantabrian Arc is confined to a relatively narrow window of geological time between 315 and 300 million years ago.
Gutiérrez-Alonso and colleagues compare the age range of this mountain bending event to the ages of igneous activity and uplift of the region and propose that widespread changes in the deeper (mantle) portion of the lithospheric plate in the area are coeval, and likely linked to, the rotation of the Cantabrian Arc to produce its characteristic sharp curviness. Based on this linkage, they propose that this, and perhaps many other, curvy mountain ranges are produced by rotation of entire portions of the lithosphere of tectonic plates, rather than just thin slices of crustal rocks.
Note : The above story is reprinted from materials provided by Geological Society of America.
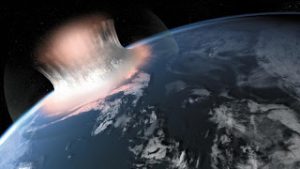
An artistic expression of how a large meteorite impact into the sea might have looked in the first second of the impacting. We do not know if the area that was hit was actually covered by water or if there was just a sea nearby. Source: (Credit: Carsten Egestal Thuesen, GEUS)
A 100 kilometre-wide crater has been found in Greenland, the result of a massive asteroid or comet impact a billion years before any other known collision on Earth.
The spectacular craters on the Moon formed from impacts with asteroids and comets between 3 and 4 billion years ago. The early Earth, with its far greater gravitational mass, must have experienced even more collisions at this time — but the evidence has been eroded away or covered by younger rocks. The previously oldest known crater on Earth formed 2 billion years ago and the chances of finding an even older impact were thought to be, literally, astronomically low.
Now, a team of scientists from Cardiff, the Geological Survey of Denmark and Greenland (GEUS) in Copenhagen, Lund University in Sweden and the Institute of Planetary Science in Moscow has upset these odds. Following a detailed programme of fieldwork, funded by GEUS and the Danish ‘Carlsbergfondet’ (Carlsberg Foundation), the team have discovered the remains of a giant 3 billion year old impact near the Maniitsoq region of West Greenland.
“This single discovery means that we can study the effects of cratering on the Earth nearly a billion years further back in time than was possible before,” according to Dr Iain McDonald of the School of Earth and Ocean Sciences, who was part of the team.
Finding the evidence was made all the harder because there is no obvious bowl-shaped crater left to find. Over the 3 billion years since the impact, the land has been eroded down to expose deeper crust 25 km below the original surface. All external parts of the impact structure have been removed, but the effects of the intense impact shock wave penetrated deep into the crust — far deeper than at any other known crater — and these remain visible.
However, because the effects of impact at these depths have never been observed before it has taken nearly three years of painstaking work to assemble all the key evidence. “The process was rather like a Sherlock Holmes story,” said Dr McDonald. “We eliminated the impossible in terms of any conventional terrestrial processes, and were left with a giant impact as the only explanation for all of the facts.”
Only around 180 impact craters have ever been discovered on Earth and around 30% of them contain important natural resources of minerals or oil and gas. The largest and oldest known crater prior to this study, the 300 kilometre wide Vredefort crater in South Africa, is 2 billion years in age and heavily eroded.
Dr McDonald added that “It has taken us nearly three years to convince our peers in the scientific community of this but the mining industry was far more receptive. A Canadian exploration company has been using the impact model to explore for deposits of nickel and platinum metals at Maniitsoq since the autumn of 2011.”
Note : The above story is reprinted from materials provided by Cardiff University.
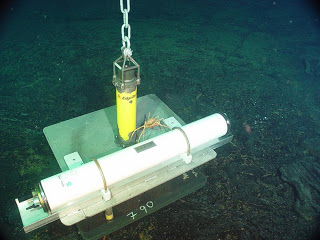
A spider crab inspects an ocean-bottom hydrophone (OBH) as it sits on the seafloor at Axial Seamount before the 2011 eruption. The OBH is a monitoring instrument designed to detect undersea earthquakes. The chain is connected to flotation above the view of the photo. (Credit: Bill Chadwick, Oregon State University)
A team of scientists that last year created waves by correctly forecasting the 2011 eruption of Axial Seamount years in advance now says that the undersea volcano located some 250 miles off the Oregon coast gave off clear signals just hours before its impending eruption.
The researchers’ documentation of inflation of the undersea volcano from gradual magma intrusion over a period of years led to the long-term eruption forecast. But new analyses using data from underwater hydrophones also show an abrupt spike in seismic energy about 2.6 hours before the eruption started, which the scientists say could lead to short-term forecasting of undersea volcanoes in the future.
They also say that Axial could erupt again — as soon as 2018 — based on the cyclic pattern of ground deformation measurements from bottom pressure recorders.
Results of the research, which was funded by the National Science Foundation, the National Oceanic and Atmospheric Administration, and the Monterey Bay Aquarium Research Institute (MBARI), are being published this week in three separate articles in the journal Nature Geoscience.
Bill Chadwick, an Oregon State University geologist and lead author on one of the papers, said the link between seismicity, seafloor deformation and the intrusion of magma has never been demonstrated at a submarine volcano, and the multiple methods of observation provide fascinating new insights.
“Axial Seamount is unique in that it is one of the few places in the world where a long-term monitoring record exists at an undersea volcano — and we can now make sense of its patterns,” said Chadwick, who works out of Oregon State’s Hatfield Marine Science Center in Newport, Ore. “We’ve been studying the site for years and the uplift of the seafloor has been gradual and steady beginning in about 2000, two years after it last erupted.
“But the rate of inflation from magma went from gradual to rapid about 4-5 months before the eruption,” added Chadwick. “It expanded at roughly triple the rate, giving a clue that the next eruption was coming.”
Bob Dziak, an Oregon State University marine geologist, had previously deployed hydrophones on Axial that monitor sound waves for seismic activity. During a four-year period prior to the 2011 eruption, there was a gradual buildup in the number of small earthquakes (roughly magnitude 2.0), but little increase in the overall “seismic energy” resulting from those earthquakes.
That began to change a few hours before the April 6, 2011, eruption, said Dziak, who also is lead author on one of the Nature Geoscience articles.
“The hydrophones picked up the signal of literally thousands of small earthquakes within a few minutes, which we traced to magma rising from within the volcano and breaking through the crust,” Dziak said. “As the magma ascends, it forces its way through cracks and creates a burst of earthquake activity that intensifies as it gets closer to the surface.
“Using seismic analysis, we were able to clearly see how the magma ascends within the volcano about two hours before the eruption,” Dziak said. “Whether the seismic energy signal preceding the eruption is unique to Axial or may be replicated at other volcanoes isn’t yet clear — but it gives scientists an excellent base from which to begin.”
The researchers also used a one-of-a-kind robotic submersible to bounce sound waves off the seafloor from an altitude of 50 meters, mapping the topography of Axial Seamount both before and after the 2011 eruption at a one-meter horizontal resolution. These before-and-after surveys allowed geologists to clearly distinguish the 2011 lava flows from the many previous flows in the area.
MBARI researchers used three kinds of sonar to map the seafloor around Axial, and the detailed images show lava flows as thin as eight inches, and as thick as 450 feet.
“These autonomous underwater vehicle-generated maps allowed us, for the first time, to comprehensively map the thickness and extent of lava flows from a deep-ocean submarine in high resolution,” said David Caress, an MBARI engineer and lead author on one of the Nature Geoscience articles. “These new observations allow us to unambiguously differentiate between old and new lava flows, locate fissures from which these flows emerged, and identify fine-scale features formed as the lava flowed and cooled.”
The researchers also used shipboard sonar data to map a second, thicker lava flow about 30 kilometers south of the main flow — also a likely result of the 2011 eruption.
Knowing the events leading up to the eruption — and the extent of the lava flows — is important because over the next few years researchers will be installing many new instruments and underwater cables around Axial Seamount as part of the Ocean Observatories Initiative. These new instruments will greatly increase scientists’ ability to monitor the ocean and seafloor off of the Pacific Northwest.
“Now that we know some of the long-term and short-term signals that precede eruptions at Axial, we can monitor the seamount for accelerated seismicity and inflation,” said OSU’s Dziak. “The entire suite of instruments will be deployed as part of the Ocean Observatories Initiative in the next few years — including new sensors, samplers and cameras — and next time they will be able to catch the volcano in the act.”
The scientists also observed and documented newly formed hydrothermal vents with associated biological activity, Chadwick said.
“We saw snowblower vents that were spewing out nutrients so fast that the microbes were going crazy,” he pointed out. “Combining these biological observations with our knowledge of the ground deformation, seismicity and lava distribution from the 2011 eruption will further help us connect underwater volcanic activity with the life it supports.”
Scientists from Columbia University, the University of Washington, North Carolina State University, and the University of California at Santa Cruz also participated in the project and were co-authors on the Nature Geoscience articles.
Note : The above story is reprinted from materials provided by Oregon State University.
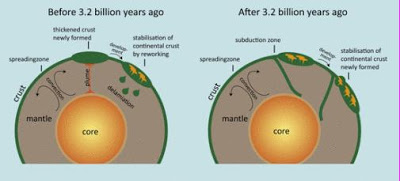
“Plate tectonics theory can be applied to about 3 billion years of the Earth’s history. However, the Earth is older, up to 4.567 billion years old. We can now demonstrate that there has been a significant shift in the Earth’s dynamics. Thus, the Earth, under the first third of its history, developed under conditions other than what can be explained using the plate tectonics model,” explains Tomas Næraa. (Credit: Image courtesy of University of Copenhagen)
The current theory of continental drift provides a good model for understanding terrestrial processes through history. However, while plate tectonics is able to successfully shed light on processes up to 3 billion years ago, the theory isn’t sufficient in explaining the dynamics of Earth and crust formation before that point and through to the earliest formation of planet, some 4.6 billion years ago. This is the conclusion of Tomas Naæraa of the Nordic Center for Earth Evolution at the Natural History Museum of Denmark, a part of the University of Copenhagen. His new doctoral dissertation has just been published by the journal Nature.
“Using radiometric dating, one can observe that Earth’s oldest continents were created in geodynamic environments which were markedly different than current environments characterised by plate tectonics. Therefore, plate tectonics as we know it today is not a good model for understanding the processes at play during the earliest episodes of Earths’s history, those beyond 3 billion years ago. There was another crust dynamic and crust formation that occurred under other processes,” explains Tomas Næraa, who has been a PhD student at the Natural History Museum of Denmark and the Geological Survey of Denmark and Greenland — GEUS.
Plate tectonics is a theory of continental drift and sea floor spreading. A wide range of phenomena from volcanism, earthquakes and undersea earthquakes (and pursuant tsunamis) to variations in climate and species development on Earth can be explained by the plate tectonics model, globally recognized during the 1960’s. Tomas Næraa can now demonstrate that the half-century old model no longer suffices.
“Plate tectonics theory can be applied to about 3 billion years of the Earth’s history. However, the Earth is older, up to 4.567 billion years old. We can now demonstrate that there has been a significant shift in the Earth’s dynamics. Thus, the Earth, under the first third of its history, developed under conditions other than what can be explained using the plate tectonics model,” explains Tomas Næraa. Tomas is currently employed as a project researcher at GEUS.
Central research topic for 30 years
Since 2006, the 40-year-old Tomas Næraa has conducted studies of rocks sourced in the 3.85 billion year-old bedrock of the Nuuk region in West Greenland. Using isotopes of the element hafnium (Hf), he has managed to shed light upon a research topic that has puzzled geologists around the world for 30 years. Næraa’s instructor, Professor Minik Rosing of the Natural History Museum of Denmark considers Næraa’s dissertation a seminal work:
“We have come to understand the context of the Earth’s and continent’s origins in an entirely new way. Climate and nutrient cycles which nourish all terrestrial organisms are driven by plate tectonics. So, if the Earth’s crust formation was controlled and initiated by other factors, we need to find out what controlled climate and the environments in which life began and evolved 4 billion years ago. This fundamental understanding can be of great significance for the understanding of future climate change,” says Minik Rosing, who adds that: “An enormous job waits ahead, and Næraas’ dissertation is an epochal step.”
Note : The above story is reprinted from materials provided by University of Copenhagen.
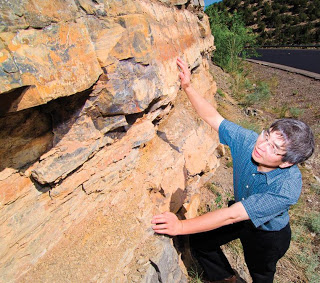
Yifeng Wang examines a sedimentary outcrop in New Mexico’s Tijeras Canyon. Wang is the lead author of a paper published recently in Nature Communications that offers new insights into pore size and distribution in horizontal slices of sedimentary rock. (Credit: Randy Montoya)
A Sandia modeling study contradicts a long-held belief of geologists that pore sizes and chemical compositions are uniform throughout a given strata, which are horizontal slices of sedimentary rock.
By understanding the variety of pore sizes and spatial patterns in strata, geologists can help achieve more production from underground oil reservoirs and water aquifers. Better understanding also means more efficient use of potential underground carbon storage sites, and better evaluations of the possible movement of radionuclides in nuclear waste depositories to determine how well the waste will be isolated.
“I think our paper for the first time provides a reasonable explanation for the origin of patterns,” said lead researcher Yifeng Wang. “We found we could predict the variations in pores as well as the heterogeneity of a reservoir.”
The analysis, published Feb. 21 in Nature Communications, was able to match the field observations published in 2006 by second author David Budd, professor of geological sciences at the University of Colorado at Boulder.
Budd said Wang put together a session at the 2010 annual meeting of the Geochemical Society at which Budd presented field studies of porosity and chemical composition. “He recognized that the data I showed could be explained by stress-induced chemical waves. He subsequently developed the numerical model to test his idea. Then we used the 2006 data set to demonstrate the correspondence between his model’s outcomes and the field data.”
A chemical wave in this context relies upon mineral dissolution and precipitation, powered by geologic stress, to penetrate surrounding material, just as an ocean wave powered by the moon’s gravitational pull rides up on a beach. Ocean waves shift sand; Wang found that chemical waves modify the spatial distribution of rock porosity.
As Wang puts it, a chemical wave is “like water rippling. The concentration of a chemical species varies periodically in space (a standing wave) or sometime such variations propagate through space (a travelling wave).
“The one we revealed in dolomite (a type of sedimentary rock) may be the largest chemical wave ever known, because no one has thought to look for chemical waves in strata. It occurred on the scale of meters to tens of meters and propagated between a hundred to a thousand years.” Chemical waves are usually observed on much smaller scales in laboratories.
Using the chemical wave concept and well-known equations for material stresses, Wang formulated a mathematical model.
The upper diagram portrays the mechanism driving a chemical wave, with stress from surrounding formations acting to percolate water through a horizontal layer of dolomite. The bottom graph shows the results of high-resolution sampling performed every 0.3 meters showing complex patterns of lateral porosity and permeability in dolomite strata. The solid red line is a three-day moving average. The images are modified from the technical paper. (Image by Yifeng Wang) Click on thumbnail for high-resolution image.
“The remarkable thing is that the model predictions match very well with many seemingly uncorrelated observations. The model predictions not only match the observed porosity patterns, but also match very well with chemical and isotopic signatures. This is the power of mathematical analysis,” Wang said.
Wang’s model isn’t large enough yet to derive equations meaningful to an entire reservoir — a process called upscaling. Still, he said, “Another way to capture this variability is to use mathematical analysis to derive upscaled flow-transport equations. This work is on the way.”
The work may help trounce geologists’ belief that each layer of sedimentary rock, deposited over eons, is more or less homogenous in porosity and composition. Thus a single core sample obtained from a given depth was thought to chemically represent the entire layer.
But Budd’s findings showed that horizontal variations within a layer of sedimentary rock could be quite significant — in some cases, as large as vertical variations. This would affect not only the amount of fluid stored or percolating through a rock but the amount of pressure needed to shoot liquids to Earth’s surface. No one knew why these variations occurred, nor had anyone measured their magnitude.
The problem has always been how to extend horizontally the knowledge gained from vertical bore holes that may be 1,300 feet apart, Budd said.
Wang’s model also reveals important information about Earth’s geological changes.
“Even the shape of a variation may reveal important facts about past times,” he said. “Our work may have geologists rethinking their method of field sampling and their interpretation of data about Earth’s evolution.”
Note : The above story is reprinted from materials provided by Sandia National Laboratories, via Newswise.
The influence of the ground beneath us on the air around us could be greater than scientists had previously thought, according to new research that links the long-ago proliferation of oxygen in Earth’s atmosphere to a sudden change in the inner workings of our planet. (Credit: Copyright Michele Hogan)
Princeton University researchers report in the journal Nature that rocks preserved in Earth’s crust reveal that a steep decline in the intensity of melting within the planet’s mantle — the hot, heat-transferring rock layer between the crust and molten outer core — brought about ideal conditions for the period known as the Great Oxygenation Event (GOE) that occurred roughly 2.5 billion years
During the GOE — which may have lasted up to 900 million years — oxygen levels in the atmosphere exploded and eventually gave rise to our present atmosphere.
Blair Schoene, a Princeton assistant professor of geosciences, and lead author C. Brenhin Keller, a Princeton geosciences doctoral student, compiled a database of more than 70,000 geological samples to construct a 4-billion-year geochemical timeline. Their analysis uncovered a sharp drop in mantle melting 2.5 billion years ago that coincides with existing rock evidence of atmospheric changes related to the GOE.
Based on this correlation, the researchers suggest in Nature that diminished melting in the mantle decreased the depth of melting in Earth’s crust, which in turn reduced the output of reactive, iron oxide-based volcanic gases into the atmosphere. A lower concentration of these gases — which react with and remove oxygen from the atmosphere — allowed free oxygen molecules to proliferate.
The Princeton research offers the strongest data-driven correlation yet between deep Earth processes and the GOE, Schoene said. Previous hypotheses are largely based on qualitative observations of the rock record and computational models that simulate how this rapid oxygenation might have occurred. The Princeton research, however, is based on a statistical analysis of the geologic record and the chemical traces of deep-Earth activity it has preserved, Schoene said.
“The perspective behind past efforts to connect geologic processes to the Great Oxygenation Event has been hypothetical, saying that ‘If the Earth had been X, there would have been reaction Y,'” Schoene said. “But these ideas cannot be tested experimentally because they are largely notional. In our paper, we have the evidence to say, ‘The Earth was like this,’ and then propose a hypothesis that can be tested by examining the same rich database of mantle and deep-crust changes we used in our work.”
A change in subsurface activity around the time of the GOE has been noted before, Keller explained. But evidence of that shift is geochemically subtle, especially after billions of years. The database he and Schoene created allowed them to show more precisely how the geochemical makeup of the crust changed through time, resulting in a more detailed hypotheses about how this would affect the atmosphere, Keller said.
“Research in this area has been largely qualitative, but with this much data, we can pick up finer features in the geologic record, particularly a level of detail related to this sudden change 2.5 billion years ago that people had not seen with such clarity before,” Keller said.
A missing piece of the GOE puzzle?
Woodward Fischer, an assistant professor of geobiology at the California Institute of Technology who specializes in the GOE, said that the Princeton research could help shed more light on an important factor in Earth’s oxygenation that is not well understood. Fischer is familiar with the paper but had no role in it.
The dominant theory of oxygenation is that an abundance of photosynthetic life emerged some hundreds of millions of years before the GOE and began producing oxygen via photosynthesis, Fischer said. The problem is that this output would not have been enough to overcome “sinks” that were absorbing more oxygen from the atmosphere than was being put into it. So, a lingering question is what happened to those sinks to bring about oxygenation.
Keller and Schoene show how one of the primary sinks — volcanic gases — might have suddenly been neutralized, Fischer said. The exact effect this would have had on atmospheric oxygen levels is difficult to know — even recent fluctuations are hard to gauge, he said. Nonetheless, the clear and objective data the researchers use strongly suggests that a quick reduction in volcanic gases brought about by a drop in mantle-melt intensity was an important precursor to oxygenation, Fischer said.
“This paper offers a really striking assessment of changes occurring in the solid Earth that greatly helped set the stage for one of the most marked environmental transitions in Earth history,” Fischer said.
“And their methodology precludes a strong tendency that researchers, as humans invested in our work, have to look for anecdotal geological evidence and conclude based on coincidence that events co-occurring in time must have been related,” Fischer said. “The statistical approach taken by the authors in this paper really lets the data shine and reveals that there were important secular changes in the way the Earth made igneous rocks, and that these changes were possibly part of an interplay between life and deep-Earth processes.”
Keller and Schoene fashioned their expansive database from previously reported rock and trace element analyses, which are increasingly available through online databases. They focused on changes in the chemical composition of basalt, a byproduct of melting in Earth’s mantle.
When melting in the mantle is high, Keller said, basalt contains greater concentrations of “compatible” elements such as chromium and magnesium that are ordinarily found in the mantle. Less intense melting, on the other hand, results in basalt with a higher content of incompatible elements such as sodium and potassium that are found closer to Earth’s surface.
From their examination, Keller and Schoene saw that Earth’s mantle has undergone a gradual cooling since the planet’s early history, which is consistent with scientists’ expectations based on heat loss at Earth’s surface. Around 2.5 billion years ago, however, the levels of compatible elements in the sampled basalt plummeted, indicating that the magnitude of melting deep in the mantle dropped off suddenly.
Keller and Schoene confirmed their findings by checking them against existing analyses of crust-level “felsic” rocks such as granite, which form when hot basalt merges with other minerals. Heightened melt activity in the mantle leads to deeper melting in Earth’s crust, and felsic rocks can indicate the intensity of mantle melting, Keller said.
The researchers conclude that when melting happens at a great depth in the crust then the concentration of the iron-oxide gases in magma increases. When emitted into the air by volcanoes, these gases bond with free oxygen and essentially remove it from the air. On the other hand, when crust melting becomes shallower, as they observed, atmospheric levels of those volcanic gases drop and free oxygen molecules can flourish.
Connecting the Earth’s systems
In a broader sense, said Schoene, his and Keller’s research depicts a close interaction between Earth’s geologic and biological systems that is becoming more apparent. “In science, it is becoming increasingly obvious that seemingly different systems act together and the question is how,” Schoene said.
“Overall, this analysis strengthens emerging arguments that interaction between the solid Earth and biosphere are very intimate and important,” he said. “This is strong evidence of how biological and geological systems might work together, and it suggests that important planetary change is not simply the result of life dragging the rest of the planet along.”
Fischer of Caltech added that this interplay of systems applies to various events in the planet’s history — such as mass extinctions — that are the result of multiple factors both above and below Earth’s surface. Decidedly more difficult is tracing how these events influenced one another and ultimately led to a greater planetary change, he said.
“Because of the complicated questions of how solid Earth changes lead to biological innovations, scientists now have to start thinking deeply and working across the boundaries of what have traditionally been pretty rigid subdisciplines in the Earth sciences,” Fischer said.
“It’s clear from research like this,” he said, “that there is hay to be made by interdisciplinary efforts to connect processes and mechanisms from the solid to the fluid Earth, and to understand that interplay with an ever-evolving biology.”
Note : The above story is reprinted from materials provided by Princeton University.
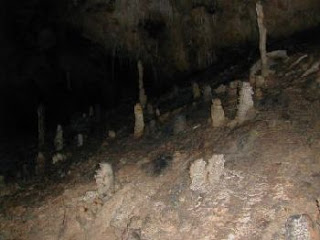
Stalagmites like these from northern Borneo are the ice cores of the tropics. – Adkins/Caltech
There is an old trick for remembering the difference between stalactites and stalagmites in a cave: Stalactites hold tight to the ceiling while stalagmites might one day grow to reach the ceiling. Now, it seems, stalagmites might also fill a hole in our understanding of Earth’s climate system and how that system is likely to respond to the rapid increase in atmospheric carbon dioxide since preindustrial times.
Many existing historical climate records are biased to the high latitudes- coming from polar ice cores and North Atlantic deep ocean sediments. Yet a main driver of climate variability today is El Niño, which is a completely tropical phenomenon. All of this begs the question: How do we study such tropical climate influences? The answer: stalagmites.
“Stalagmites are the ice cores of the tropics,” says Jess Adkins, professor of geochemistry and global environmental science at the California Institute of Technology (Caltech). He and geochemist Kim Cobb of the Georgia Institute of Technology led a team that collected samples from stalagmites in caves in northern Borneo and measured their levels of oxygen isotopes to reconstruct a history of the tropical West Pacific’s climate over four glacial cycles during the late Pleistocene era (from 570,000 to 210,000 years ago).
The results appear in the May 3 issue of Science Express. The lead author of the paper, Nele Meckler, completed most of the work as a postdoctoral scholar at Caltech and is now at the Geological Institute of ETH Zürich.
Throughout Earth’s history, global climate has shifted between periods of glacial cooling that led to ice ages, and interglacial periods of relative warmth, such as the present. Past studies from high latitudes have indicated that about 430,000 years ago-at a point known as the Mid-Brunhes Event (MBE)-peak temperatures and levels of atmospheric carbon dioxide in interglacial cycles were suddenly bumped up by about a third. But no one has known whether this was also the case closer to the equator.
By studying the records from tropical stalagmites, Adkins and his team found no evidence of such a bump. Instead, precipitation levels remained the same across the glacial cycles, indicating that the tropics did not experience a major shift in peak interglacial conditions following the MBE. “The stalagmite records have glacial cycles in them, but the warm times-the interglacials-don’t change in the same way as they do at high latitudes,” Adkins says. “We don’t know what that tells us yet, but this is the first time the difference has been recorded.”
At the same time, some changes did appear in the climate records from both the high latitudes and the tropics. The researchers found that extreme drying in the tropics coincided with abrupt climate changes in the North Atlantic, at the tail end of glacial periods. It is thought that these rapid climate changes, known as Heinrich events, are triggered by large ice sheets suddenly plunging into the ocean.
“In the tropics, we see these events as very sharp periods of drying in the stalagmite record,” Adkins says. “We think that these droughts indicate that the tropics experienced a more El Niño-like climate at those times, causing them to dry out.” During El Niño events, warm waters from the tropics, near Borneo, shift toward the center of the Pacific Ocean, often delivering heavier rainfall than usual to the western United States while leaving Indonesia and its neighbors extremely dry and prone to forest fires.
The fact that the tropics responded to Heinrich events, but not to the shift that affected the high latitudes following the MBE, suggests that the climate system has two modes of responding to significant changes. “It makes you wonder if maybe the climate system cares about what sort of hammer you hit it with,” Adkins says. “If you nudge the system consistently over long timescales, the tropics seem to be able to continue independently of the high latitudes. But if you suddenly whack the climate system with a big hammer, the impact spreads out and shows up in the tropics.”
This work raises questions about the future in light of recent increases in atmospheric carbon dioxide: Is this increase more like a constant push? Or is it a whack with a big hammer? A case could be made for either one of these scenarios, says Adkins, but he adds that it would be easiest to argue that the forcing is more like a sudden whack, since the amount of carbon dioxide in the atmosphere has increased at such an unprecedented rate.
Note: This story has been adapted from a news release issued by the California Institute of Technology
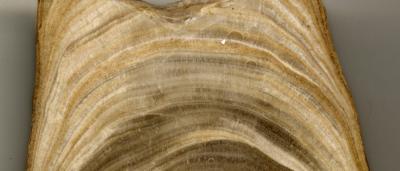
A slice through a stalagmite from a cave in northern Borneo reveals the gradual growth of the calcite structure. By measuring the ratio of oxygen isotopes in such samples, Caltech’s Adkins and his colleagues were able to reconstruct a history of the climate in the tropics throughout the late Pleistocene era. (Credit: Adkins/Caltech)
There is an old trick for remembering the difference between stalactites and stalagmites in a cave: Stalactites hold tight to the ceiling while stalagmitesmight one day grow to reach the ceiling. Now, it seems, stalagmites might also fill a hole in our understanding of Earth’s climate system and how that system is likely to respond to the rapid increase in atmospheric carbon dioxide since preindustrial times.
Many existing historical climate records are biased to the high latitudes — coming from polar ice cores and North Atlantic deep ocean sediments. Yet a main driver of climate variability today is El Niño, which is a completely tropical phenomenon. All of this begs the question: How do we study such tropical climate influences? The answer: stalagmites.
“Stalagmites are the ice cores of the tropics,” says Jess Adkins, professor of geochemistry and global environmental science at the California Institute of Technology (Caltech). He and geochemist Kim Cobb of the Georgia Institute of Technology led a team that collected samples from stalagmites in caves in northern Borneo and measured their levels of oxygen isotopes to reconstruct a history of the tropical West Pacific’s climate over four glacial cycles during the late Pleistocene era (from 570,000 to 210,000 years ago).
The results appear in the May 3 issue of Science Express. The lead author of the paper, Nele Meckler, completed most of the work as a postdoctoral scholar at Caltech and is now at the Geological Institute of ETH Zürich.
Throughout Earth’s history, global climate has shifted between periods of glacial cooling that led to ice ages, and interglacial periods of relative warmth, such as the present. Past studies from high latitudes have indicated that about 430,000 years ago — at a point known as the Mid-Brunhes Event (MBE) — peak temperatures and levels of atmospheric carbon dioxide in interglacial cycles were suddenly bumped up by about a third. But no one has known whether this was also the case closer to the equator.
By studying the records from tropical stalagmites, Adkins and his team found no evidence of such a bump. Instead, precipitation levels remained the same across the glacial cycles, indicating that the tropics did not experience a major shift in peak interglacial conditions following the MBE. “The stalagmite records have glacial cycles in them, but the warm times — the interglacials — don’t change in the same way as they do at high latitudes,” Adkins says. “We don’t know what that tells us yet, but this is the first time the difference has been recorded.”
At the same time, some changes did appear in the climate records from both the high latitudes and the tropics. The researchers found that extreme drying in the tropics coincided with abrupt climate changes in the North Atlantic, at the tail end of glacial periods. It is thought that these rapid climate changes, known as Heinrich events, are triggered by large ice sheets suddenly plunging into the ocean.
“In the tropics, we see these events as very sharp periods of drying in the stalagmite record,” Adkins says. “We think that these droughts indicate that the tropics experienced a more El Niño-like climate at those times, causing them to dry out.” During El Niño events, warm waters from the tropics, near Borneo, shift toward the center of the Pacific Ocean, often delivering heavier rainfall than usual to the western United States while leaving Indonesia and its neighbors extremely dry and prone to forest fires.
The fact that the tropics responded to Heinrich events, but not to the shift that affected the high latitudes following the MBE, suggests that the climate system has two modes of responding to significant changes. “It makes you wonder if maybe the climate system cares about what sort of hammer you hit it with,” Adkins says. “If you nudge the system consistently over long timescales, the tropics seem to be able to continue independently of the high latitudes. But if you suddenly whack the climate system with a big hammer, the impact spreads out and shows up in the tropics.”
This work raises questions about the future in light of recent increases in atmospheric carbon dioxide: Is this increase more like a constant push? Or is it a whack with a big hammer? A case could be made for either one of these scenarios, says Adkins, but he adds that it would be easiest to argue that the forcing is more like a sudden whack, since the amount of carbon dioxide in the atmosphere has increased at such an unprecedented rate.
In addition to Adkins, Cobb, and Meckler, other coauthors on the paper, “Interglacial hydroclimate in the tropical West Pacific through the late Pleistocene,” are Matthew Clarkson of the University of Edinburgh and Harald Sodemann of ETH Zürich. Cobb is also a former postdoctoral scholar in Adkins’s group and has been collaborating on this project since her time at Caltech. The work was supported by the National Science Foundation, the Swiss National Science Foundation, the German Research Foundation, and by an Edinburgh University Principal’s Career Development PhD Scholarship.
Note : The above story is reprinted from materials provided by California Institute of Technology. The original article was written by Kimm Fesenmaier.
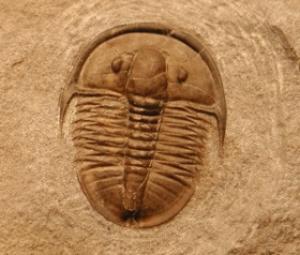
Cambrian trilobite, with a shell made of calcium carbonate. (Credit: Shanan Peters)
The oceans teemed with life 600 million years ago, but the simple, soft-bodied creatures would have been hardly recognizable as the ancestors of nearly all animals on Earth today.
Then something happened. Over several tens of millions of years — a relative blink of an eye in geologic terms — a burst of evolution led to a flurry of diversification and increasing complexity, including the expansion of multicellular organisms and the appearance of the first shells and skeletons.
The results of this Cambrian explosion are well documented in the fossil record, but its cause — why and when it happened, and perhaps why nothing similar has happened since — has been a mystery.
New research shows that the answer may lie in a second geological curiosity — a dramatic boundary, known as the Great Unconformity, between ancient igneous and metamorphic rocks and younger sediments.
“The Great Unconformity is a very prominent geomorphic surface and there’s nothing else like it in the entire rock record,” says Shanan Peters, a geoscience professor at the University of Wisconsin-Madison who led the new work. Occurring worldwide, the Great Unconformity juxtaposes old rocks, formed billions of years ago deep within Earth’s crust, with relatively young Cambrian sedimentary rock formed from deposits left by shallow ancient seas that covered the continents just a half billion years ago.
Named in 1869 by explorer and geologist John Wesley Powell during the first documented trip through the Grand Canyon, the Great Unconformity has posed a longstanding puzzle and has been viewed — by Charles Darwin, among others — as a huge gap in the rock record and in our understanding of Earth’s history.
But Peters says the gap itself — the missing time in the geologic record — may hold the key to understanding what happened.
In the April 19 issue of the journal Nature, he and colleague Robert Gaines of Pomona College report that the same geological forces that formed the Great Unconformity may have also provided the impetus for the burst of biodiversity during the early Cambrian.
“The magnitude of the unconformity is without rival in the rock record,” Gaines says. “When we pieced that together, we realized that its formation must have had profound implications for ocean chemistry at the time when complex life was just proliferating.”
“We’re proposing a triggering mechanism for the Cambrian explosion,” says Peters. “Our hypothesis is that biomineralization evolved as a biogeochemical response to an increased influx of continental weathering products during the last stages in the formation of the Great Unconformity.”
Peters and Gaines looked at data from more than 20,000 rock samples from across North America and found multiple clues, such as unusual mineral deposits with distinct geochemistry, that point to a link between the physical, chemical, and biological effects.
During the early Cambrian, shallow seas repeatedly advanced and retreated across the North American continent, gradually eroding away surface rock to uncover fresh basement rock from within the crust. Exposed to the surface environment for the first time, those crustal rocks reacted with air and water in a chemical weathering process that released ions such as calcium, iron, potassium, and silica into the oceans, changing the seawater chemistry.
The basement rocks were later covered with sedimentary deposits from those Cambrian seas, creating the boundary now recognized as the Great Unconformity.
Evidence of changes in the seawater chemistry is captured in the rock record by high rates of carbonate mineral formation early in the Cambrian, as well as the occurrence of extensive beds of glauconite, a potassium-, silica-, and iron-rich mineral that is much rarer today.
The influx of ions to the oceans also likely posed a challenge to the organisms living there. “Your body has to keep a balance of these ions in order to function properly,” Peters explains. “If you have too much of one you have to get rid of it, and one way to get rid of it is to make a mineral.”
The fossil record shows that the three major biominerals — calcium phosphate, now found in bones and teeth; calcium carbonate, in invertebrate shells; and silicon dioxide, in radiolarians — appeared more or less simultaneously around this time and in a diverse array of distantly related organisms.
The time lag between the first appearance of animals and their subsequent acquisition of biominerals in the Cambrian is notable, Peters says. “It’s likely biomineralization didn’t evolve for something, it evolved in response to something — in this case, changing seawater chemistry during the formation of the Great Unconformity. Then once that happened, evolution took it in another direction.” Today those biominerals play essential roles as varied as protection (shells and spines), stability (bones), and predation (teeth and claws).
Together, the results suggest that the formation of the Great Unconformity may have triggered the Cambrian explosion.
“This feature explains a lot of lingering questions in different arenas, including the odd occurrences of many types of sedimentary rocks and a very remarkable style of fossil preservation. And we can’t help but think this was very influential for early developing life at the time,” Gaines says.
Far from being a lack of information, as Darwin thought, the gaps in the rock record may actually record the mechanism as to why the Cambrian explosion occurred in the first place, Peters says.
“The French composer Claude Debussy said, ‘Music is the space between the notes.’ I think that is the case here,” he says. “The gaps can have more information, in some ways, about the processes driving Earth system change, than the rocks do. It’s both together that give the whole picture.”
The work was supported by the National Science Foundation.
Note : The above story is reprinted from materials provided by University of Wisconsin-Madison, via Newswise. The original article was written by Jill Sakai.
International scientists have shown that a dramatic sea-level rise occurred at the onset of the first warm period of the last deglaciation, known as the Bølling warming, approximately 14,600 years ago. This event, referred to as Melt-Water Pulse 1A (MWP-1A), corresponds to a rapid collapse of massive ice sheets 14,600 years ago and resulted in global sea-level rise of ~14 m. These findings are published in the 29 March 2012 issue of the journal Nature (Volume 483, Issue 7391).
Collaboration between CEREGE (UMR Aix-Marseille Univ. – CNRS – IRD – College de France) and the Universities of Oxford and Tokyo, allowed an international science team to publish on research stemming from the Tahiti Sea-Level Expedition 310 of the Integrated Ocean Drilling Program (IODP). The Tahiti Sea-Level Expedition was carried out in 2005 by the European Consortium for Ocean Research Drilling (ECORD) and the ECORD Science Operator (ESO) on behalf of IODP.
Using U-Th dating of coral samples obtained from cores drilled in the Tahiti coral reefs, the researchers were able to reconstruct sea-level rise over the last deglaciation. Coral is extremely sensitive to sea-level changes and fossilized corals are therefore an excellent indicator for sea-level changes over time.
“Corals are outstanding archives to reconstruct past sea-level changes as they can be dated to within plus or minus 30 years stretching back thousands of years. Moreover, Tahitian reefs are ideally located to reconstruct the deglacial sea-level rise and to constrain short-term events that are thought to have punctuated the period between the Last Glacial Maximum and the present days. Tahiti is located at a sufficiently considerable distance from the major former ice sheets to give us close to the average of sea levels across the globe, as a non-volcanic island it is also subsiding into the ocean at a steady pace that we can easily adjust for.” Pierre Deschamps, first author based at CEREGE said.
The Nature article presents the view that most of the melting water that contributed to MWP-1A was sourced from the Antarctic ice sheet, highlighting dynamical behavior of this ice sheet in the past. The authors note that further research is needed using cored fossilized corals to better understand the sequence of events related to ice sheet collapse during the last deglaciation.
Today, half of world’s population, approximately 3.2 billion people, lives within 200 km of coastline, and a tenth of the population lives less than 10 meters above sea level. Tahiti itself is, of course, at risk from modern sea-level rise. The government of Tahiti cooperated on the IODP Expedition 310 by providing the necessary regulatory clearances to drill on the fossilized coral reefs.
Pierre Deschamps says “Insights into past sea-level changes may help to better constrain future changes. Our work sheds light onto an extreme event of rise in global sea levels in which ice-sheet collapse coincided with a rapid warming. Whether the freshwater pulse was a result of an already warming word or helped to warm the climate is currently unclear. However, our finding will help scientists currently modelling future climate change scenarios to factor in the dynamic behaviour of major ice sheets and finally to provide more reliable predictions of ice sheet responses to a warming climate”.
Much is yet unknown about the dynamics of sea-level change, in response to massive water discharge. However, IODP Expedition 310 has helped international scientists shed light on one of the most important climate event of the last deglaciation, the MWP-1A event, based on fossil corals obtained from off the coast of Tahiti.
Note: This story has been adapted from a news release issued by the Integrated Ocean Drilling Program Management International
This garnet pyroxenite xenolith from Sierra Nevada, Calif., is an example of the deepest products of crystallization within the magmatic belts of subduction zones. Rice University’s Cin-Ty Lee and colleagues showed that most of the copper in arc magmas eventually end up in these deep-seated rocks. (Credit: Image courtesy of Rice University)
Earth is clingy when it comes to copper. A new Rice University study recently published in the journal Science finds that nature conspires at scales both large and small — from the realms of tectonic plates down to molecular bonds — to keep most of Earth’s copper buried dozens of miles below ground.
“Everything throughout history shows us that Earth does not want to give up its copper to the continental crust,” said Rice geochemist Cin-Ty Lee, the lead author of the study. “Both the building blocks for continents and the continental crust itself, dating back as much as 3 billion years, are highly depleted in copper.”
Finding copper is more than an academic exercise. With global demand for electronics growing rapidly, some studies have estimated the world’s demand for copper could exceed supply in as little as six years. The new study could help, because it suggests where undiscovered caches of copper might lie.
But the copper clues were just a happy accident.
“We didn’t go into this looking for copper,” Lee said. “We were originally interested in how continents form and more specifically in the oxidation state of volcanoes.”
Earth scientists have long debated whether an oxygen-rich atmosphere might be required for continent formation. The idea stems from the fact that Earth may not have had many continents for at least the first billion years of its existence and that Earth’s continents may have begun forming around the time that oxygen became a significant component of the atmosphere.
In their search for answers, Lee and colleagues set out to examine Earth’s arc magmas — the molten building blocks for continents. Arc magmas get their start deep in the planet in areas called subduction zones, where one of Earth’s tectonic plates slides beneath another. When plates subduct, two things happen. First, they bring oxidized crust and sediments from Earth’s surface into the mantle. Second, the subducting plate drives a return flow of hot mantle upwards from Earth’s deep interior. During this return flow, the hot mantle not only melts itself but may also cause melting of the recycled sediments. Arc magmas are thought to form under these conditions, so if oxygen were required for continental crust formation, it would mostly likely come from these recycled segments.
“If oxidized materials are necessary for generating such melts, we should see evidence of it all the way from where the arc magmas form to the point where the new continent-building material is released from arc volcanoes,” Lee said.
Lee and colleagues examined xenoliths, rocks that formed deep inside Earth and were carried up to the surface in volcanic eruptions. Specifically, they studied garnet pyroxenite xenoliths thought to represent the first crystallized products of arc magmas from the deep roots of an arc some 50 kilometers below Earth’s surface. Rather than finding evidence of oxidation, they found sulfides — minerals that contain reduced forms of sulfur bonded to metals like copper, nickel and iron. If conditions were highly oxidizing, Lee said, these sulfide minerals would be destabilized and allow these elements, particularly copper, to bond with oxygen.
Because sulfides are also heavy and dense, they tend to sink and get left behind in the deep parts of arc systems, like a blob of dense material that stays at the bottom of a lava lamp while less dense material rises to the top.
“This explains why copper deposits, in general, are so rare,” Lee said. “The Earth wants to hold it deep and not give it up.”
Lee said deciding where to look for undiscovered copper deposits requires an understanding of the conditions needed to overcome the forces that conspire to keep it deep inside the planet.
“As a continental arc matures, the copper-rich sulfides are trapped deep and accumulate,” he said. “But if the continental arc grows thicker over time, the accumulated copper-bearing sulfides are driven to deeper depths where the higher temperatures can re-melt these copper-rich dregs, releasing them to rejoin arc magmas.”
These conditions were met in the Andes Mountains and in western North America. He said other potential sources of undiscovered copper include Siberia, northern China, Mongolia and parts of Australia.
Lee noted that a high school intern played a role in the research paper. Daphne Jin, now a freshman at the University of Chicago, made her contribution to the research as a high school intern from Clements High School in the Houston suburb of Sugarland.
“The paper really wouldn’t have been as broad without Daphne’s contribution,” Lee said. “I originally struggled with an assignment for her because I didn’t and still don’t have large projects where a student can just fit in. I try to make sure every student has a chance to do something new, but often I just run out of ideas.”
Lee eventually asked Jin to compile information from published studies about the average concentration of all the first-row of transition elements in the periodic table in various samples of continental crust and mantle collected the world over.
“She came back and showed me the results, and we could see that the average continental crust itself, which has been built over 3 billion years of Earth’s history in Africa, Siberia, North America, South America, etc., was all depleted in copper,” Lee said. “Up to that point we’d been looking at the building blocks of continents, but this showed us that the continents themselves followed the same pattern. It was all internally consistent.”
In addition to Jin, Lee’s co-authors on the report include Rajdeep Dasgupta, assistant professor of Earth science at Rice; Rice postdoctoral researchers Peter Luffi and Veronique Roux; Rice graduate student Emily Chin; visiting graduate student Romain Bouchet of the École Normale Supérieure in Lyon, France; Douglas Morton, professor of geology at the University of California, Riverside; and Qing-zhu Yin, professor of geology at the University of California, Davis.
The research was funded by the National Science Foundation.
Note : The above story is reprinted from materials provided by Rice University.