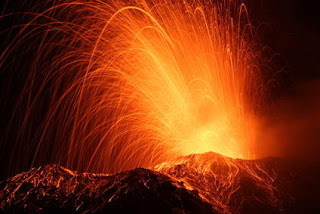
Two new studies into the “plumbing systems” that lie under volcanoes could bring scientists closer to predicting large eruptions.
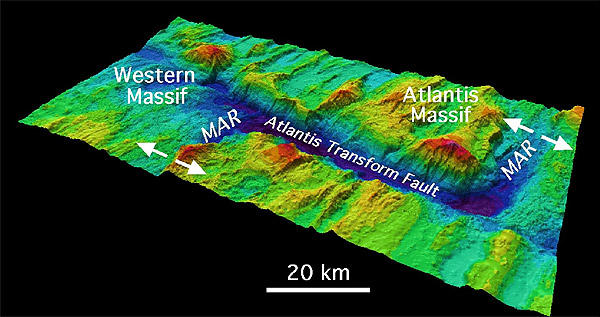
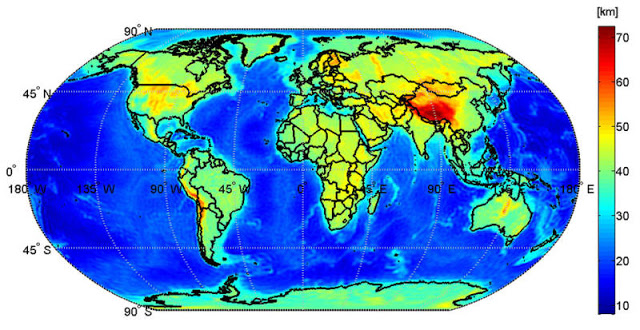
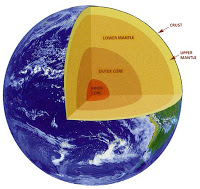
International teams of researchers, led by the University of Leeds, studied the location and behaviour of magma chambers on Earth’s mid-ocean ridge system — a vast chain of volcanoes along which Earth forms new crust.
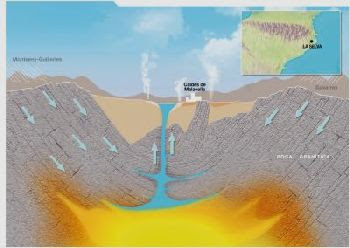
They worked in Afar (Ethiopia) and Iceland — the only places where mid-ocean ridges appear above sea level. Volcanic ridges (or “spreading centres”) occur when tectonic plates “rift” or pull apart. Magma (hot molten rock) injects itself into weaknesses in the brittle upper crust, erupting as lava and forming new crust upon cooling.
Magma chambers work like plumbing systems, channelling pressurised magma through networks of underground “pipes.”
The studies, published in Nature Geoscience, reveal new information about where magma is stored and how it moves through the geological plumbing network. Finding out where magma chambers lie and how they behave can help identify early warning signs of impending eruptions.
Scientists used images taken by the European Space Agency satellite Envisat to measure how the ground moved before, during and after eruptions. Using this data, they built and tested computer models to find out how rifting occurs.
Data in one study showed magma chambers that fed an eruption in November 2008 in the Afar rift of Northern Ethiopia were only about 1 km below the ground. The standard model had predicted a depth of more than 3 km.
It is highly unusual for magma chambers to lie in shallow depths on slow spreading centres such as the Afar rift, where tectonic plates pull apart at about the same speed as human fingernails grow.
Dr Carolina Pagli from the University of Leeds’ School of Earth and Environment, who led the study, says: “It was a complete surprise to see that a magma chamber could exist so close to the Earth’s surface in an area where the tectonic plates move apart so slowly. The results have changed the way we think about volcanoes.”
Dr Pagli also noticed that the ground started “uplifting” (elevating) four months before the eruption, due to new magma increasing pressure in one of the underground chambers. Understanding these precursory signals is fundamental to predicting eruptions.
A wider study of eruptions in Afar and Iceland, two vastly different environments, found remarkable similarities. Many events occurred within a short space of time. Researchers identified multiple magma chambers positioned horizontally and vertically, allowing magma to shoot in several directions. Moving magma triggered earthquakes, and separate magma chambers fed single eruptions.
The 2008 eruption is part of an unusual period of recent volcanic unrest in Ethiopia, and is enabling scientists to learn more about volcanoes at spreading centres. Most spreading centres are under 2 km of water at the bottom of the ocean, making detailed observations extremely challenging. The new knowledge derived from Ethiopian volcanoes will help scientists understand volcanoes in Iceland, where eruptions can have a bigger impact on the UK.
Dr Tim Wright from the School of Earth and Environment, who leads the international Afar Rift Consortium, said: “The dramatic events we have been witnessing in Afar in the past six years are transforming our understanding of how the crust grows when tectonic plates pull apart. Our work in one of the hottest place on Earth is having a direct impact on our understanding of eruptions from the frozen volcanoes of Iceland.”
Note : The above story is reprinted from materials provided by University of Leeds.