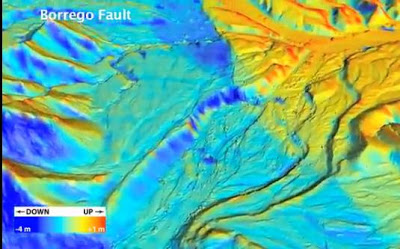
An image of the 3-D visualization of an earthquake zone. (Credit: Image courtesy of University of California – Davis)
Geologists have a new tool to study how earthquakes change the landscape down to a few inches, and it’s giving them insight into how earthquake faults behave. In the Feb. 10 issue of the journal Science, a team of scientists from the U.S., Mexico and China reports the most comprehensive before-and-after picture yet of an earthquake zone, using data from the magnitude 7.2 event that struck near Mexicali, northern Mexico in April, 2010.
“We can learn so much about how earthquakes work by studying fresh fault ruptures,” said Michael Oskin, geology professor at the University of California, Davis, and lead author on the paper.
The team, working with the National Center for Airborne Laser Mapping (NCALM), flew over the area with LiDAR (light detection and ranging), which bounces a stream of laser pulses off the ground. New airborne LiDAR equipment can measure surface features to within a few inches. The researchers were able to make a detailed scan over about 140 square miles in less than three days, Oskin said.
Oskin said that they knew the area had been mapped with LiDAR in 2006 by the Mexican government. When the earthquake occurred, Oskin and Ramon Arrowsmith at Arizona State University applied for and got funding from the National Science Foundation to carry out an immediate aerial survey to compare the results.
Co-authors John Fletcher and graduate student Orlando Teran from the Centro de Investigación Científica y de Educación Superior de Ensenada (CICESE) carried out a traditional ground survey of the fault rupture, which helped guide planning of the aerial LiDAR survey and the interpretation of the results.
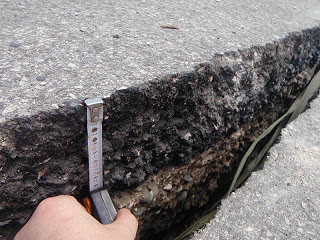
From the ground, features like the five-foot escarpment created when part of a hillside abruptly moved up and sideways are readily visible. But the LiDAR survey further reveals warping of the ground surface adjacent to faults that previously could not easily be detected, Oskin said. For example, it revealed the folding above the Indiviso fault running beneath agricultural fields in the floodplain of the Colorado River.
“This would be very hard to see in the field,” Oskin said.
Team members used the “virtual reality” facility at UC Davis’ W.M. Keck Center for Active Visualization in Earth Sciences to handle and view the data from the survey. By comparing pre- and post-earthquake surveys, they could see exactly where the ground moved and by how much.
The survey revealed deformation around the system of small faults that caused the earthquake, and allowed measurements that provide clues to understanding how these multifault earthquakes occur.
The 2010 Mexicali earthquake did not occur on a major fault, like the San Andreas, but ran through a series of smaller faults in Earth’s crust. These minor faults are common around major faults but are “underappreciated,” Oskin said.
“This sort of earthquake happens out of the blue,” he said.
The new LiDAR survey shows how seven of these small faults came together to cause a major earthquake, Oskin said.
Ken Hudnut, a geophysicist with the U.S. Geological Survey and co-author on the paper, made the first use of airborne LiDAR about 10 years ago to document surface faulting from the Hector Mine earthquake. But “pre-earthquake” data were lacking. Since then, NCALM has carried out LiDAR scans of the San Andreas system (the “B4 Project”) and other active faults in the western U.S. (a component of the EarthScope Project), thereby setting a trap for future earthquakes, he said.
“In this case, fortunately, our CICESE colleagues had set such a trap, and this earthquake fell right into it and became the first ever to be imaged by ‘before’ and ‘after’ LiDAR. It is a thrill for me to be on the team that reached this important milestone,” Hudnut said.
Other authors on the paper are, at UC Davis: graduate student Austin Elliott and researcher Peter Gold; J. Ramon Arrowsmith, Arizona State University; Alejandro Hinojosa Corona and J. Javier Gonzalez Garcia, CICESE, Mexico; Eric Fielding, NASA Jet Propulsion Laboratory, Pasadena; and Jing Liu-Zeng, Chinese Academy of Sciences, Beijing. The work was supported by the National Science Foundation, the U.S. Geological Survey, Consejo Nacional de Ciencia y Tecnología (Mexico) and NASA.
Note : The above story is reprinted from materials provided by University of California – Davis.
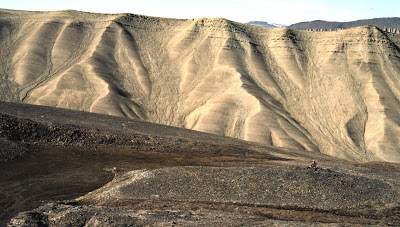
The barren arctic landscape of Ellesmere Island was the site of the scientists’ research. (Credit: C.M. Henderson)
A painstakingly detailed investigation shows that mass extinctions need not be sudden events. The deadliest mass extinction of all took a long time to kill 90 percent of Earth’s marine life, and it killed in stages, according to a newly published report.
Thomas J. Algeo, professor of geology at the University of Cincinnati, worked with 13 co-authors to produce a high-resolution look at the geology of a Permian-Triassic boundary section on Ellesmere Island in the Canadian Arctic.
Their analysis, published Feb. 3 in the Geological Society of America Bulletin, provides strong evidence that Earth’s biggest mass extinction phased in over hundreds of thousands of years.
About 252 million years ago, at the end of the Permian period, Earth almost became a lifeless planet.
Around 90 percent of all living species disappeared then, in what scientists have called “The Great Dying.” Algeo and colleagues have spent much of the past decade investigating the chemical evidence buried in rocks formed during this major extinction.
The world revealed by their research is horrific and alien: a devastated landscape, barren of vegetation and scarred by erosion from showers of acid rain, huge “dead zones” in the oceans, and runaway greenhouse warming leading to sizzling temperatures.
The evidence that Algeo and his colleagues are looking at points to massive volcanism in Siberia. A large portion of western Siberia reveals volcanic deposits up to five kilometers (three miles) thick, covering an area equivalent to the continental United States. And the lava flowed where it could most endanger life, through a large coal deposit.
“The eruption released lots of methane when it burned through the coal,” he said. “Methane is 30 times more effective as a greenhouse gas than carbon dioxide. We’re not sure how long the greenhouse effect lasted, but it seems to have been tens or hundreds of thousands of years.”
A lot of the evidence ended up being washed into the ocean, and it is among fossilized marine deposits that Algeo and his colleagues look for it. Previous investigations have focused on deposits created by a now vanished ocean known as Tethys, a kind of precursor to the Indian Ocean. Those deposits, in South China particularly, record a sudden extinction at the end of the Permian.
“In shallow marine deposits, the latest Permian mass extinction was generally abrupt,” Algeo said. “Based on such observations, it has been widely inferred that the extinction was a globally synchronous event.”
Recent studies are starting to challenge that view.
Algeo and his co-authors focused on rock layers at West Blind Fiord on Ellesmere Island in the Canadian Arctic. That location, at the end of the Permian, would have been a lot closer to the Siberian volcanoes than sites in South China.
The Canadian sedimentary rock layers are 24 meters (almost 80 feet) thick and cross the Permian-Triassic boundary, including the latest Permian mass extinction horizon. The investigators looked at how the type of rock changed from the bottom to the top of the section. They looked at the chemistry of the rocks. They looked at the fossils contained in the rocks.
They discovered a total die-off of siliceous sponges about 100,000 years earlier than the marinemass extinction event recorded at Tethyan sites. Chemical clues, Algeo said, confirm that life on land was in crisis. Dying plants and eroding soil were being flushed into the ocean where the over-abundant nutrients led to a microbial feeding frenzy and the removal of oxygen — and life — from the late Permian ocean.
What appears to have happened, according to Algeo and his colleagues, is that the effects of early Siberian volcanic activity, such as toxic gases and ash, were confined to the northern latitudes. Only after the eruptions were in full swing did the effects reach the tropical latitudes of the Tethys Ocean.
The research was supported by the National Science Foundation, Canadian Natural Sciences and Engineering Research Council and the National Aeronautics and Space Administration Exobiology Program.
Note : The above story is reprinted from materials provided by University of Cincinnati. The original article was written by Greg Hand.
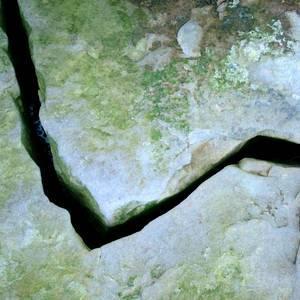
Boise State University geophysics researchers have created a new way to study fractures by producing elastic waves, or vibrations, through using high-intensity light focused directly on the fracture itself. (Credit: Image courtesy of Boise State University)
Boise State University geophysics researchers have created a new way to study fractures by producing elastic waves, or vibrations, through using high-intensity light focused directly on the fracture itself. The new technique developed in the Physical Acoustics Lab at Boise State may help determine if there is a fluid, such as magma or water, or natural gas inside fractures in the Earth.
Typically, scientists create sound waves at the surface to listen for echoes from fractures in the ground, but this new technique could provide more accurate information about the cracks because sound does not have to travel to the fracture and back again.
The new technique aims to enhance scientists’ abilities to image faults in the Earth, including those human-made through the process of hydraulic fracturing, or fracking.
The new method is explained in a paper that appears online in the journal Physical Review Letters.
“These concepts are of great importance in earthquake dynamics, but also in exploration of hydrocarbons,” said study coauthor Thomas Blum, a Boise State doctoral student. “If we can understand, for example, the microscopic structure of fracture points using this technique, we might be able to learn how, exactly, earthquakes happen. Scientists do not yet fully understand the structure of the faults, so if we could remotely sense the structure of faults, we might be able to learn more.”
Blum and Kasper van Wijk, associate professor of geosciences at Boise State, came up with the new technique by focusing laser light directly onto a fracture inside a transparent sample to create elastic waves. The researchers proved that laser-based ultrasonic techniques can “excite,” or cause vibrations, in the fracture. The result — jointly obtained with scientists at Colorado School of Mines and ConocoPhillips — opens up the possibility of measuring variations in the fracture and diagnosing the mechanical properties of fractures by directly exciting them.
Note : The above story is reprinted from materials provided by Boise State University, via Newswise.
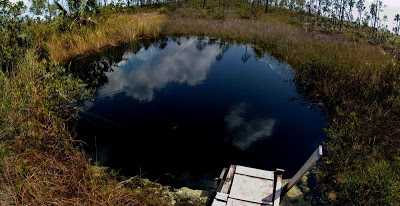
Typical Bahamian Blue Hole entrance pool. (Credit: Photo by Tamara Thomsen)
Discoveries made in some underwater caves by Texas &M University at Galveston researchers in the Bahamas could provide clues about how ocean life formed on Earth millions of years ago, and perhaps give hints of what types of marine life could be found on distant planets and moons.
Tom Iliffe, professor of marine biology at the Texas A&M-Galveston campus, and graduate student Brett Gonzalez of Trabuco Canyon, Calif., examined three “blue holes” in the Bahamas and found that layers of bacterial microbes exists in all three, but each cave had specialized forms of such life and at different depths, suggesting that microbial life in such caves is continually adapting to changes in available light, water chemistry and food sources. Their work, also done in conjunction with researchers from Penn State University, has been published in Hydrobiologia.
“Blue holes” are so named because from an aerial view, they appear circular in shape with different shades of blue in and around their entrances. There are estimated to be more than 1,000 such caves in the Bahamas, the largest concentration of blue holes in the world.
‘We examined two caves on Abaco Island and one on Andros Island,” Iliffe explains. “One on Abaco, at a depth of about 100 feet, had sheets of bacteria that were attached to the walls of the caves, almost one inch thick. Another cave on the same island had bacteria living within poisonous clouds of hydrogen sulfide at the boundary between fresh and salt water. These caves had different forms of bacteria, with the types and density changing as the light source from above grew dimmer and dimmer.
“In the cave on Andros, we expected to find something similar, but the hydrogen sulfide layer there contained different types of bacteria,” he adds. “It shows that the caves tend to have life forms that adapt to that particular habitat, and we found that some types of the bacteria could live in environments where no other forms of life could survive. This research shows how these bacteria have evolved over millions of years and have found a way to live under these extreme conditions.”
Iliffe says the microbes change where the salt water meets fresh water within the caves and use chemical energy to produce their food. They can survive in environments with very low amounts of oxygen and light.
There are tens of thousands of underwater caves scattered around the world, but less than 5 percent of these have ever been explored and scientifically investigated, Iliffe notes.
“These bacterial forms of life may be similar to microbes that existed on early Earth and thus provide a glimpse of how life evolved on this planet,” he adds. “These caves are natural laboratories where we can study life existing under conditions analogous to what was present many millions of years ago.
“We know more about the far side of the moon than we do about these caves right here on Earth,” he adds. “There is no telling what remains to be discovered in the many thousands of caves that no one has ever entered. If life exists elsewhere in our solar system, it most likely would be found in water-filled subterranean environments, perhaps equivalent to those we are studying in the Bahamas.”
Over the past 30 years, Iliffe has discovered several hundred species of marine life, and has probably explored more underwater caves — at least 1,500 — than anyone in the world, examining such caves in Australia, the Caribbean, Mediterranean and North Atlantic regions of the world.
Note : The above story is reprinted from materials provided by Texas A&M University, via Newswise.
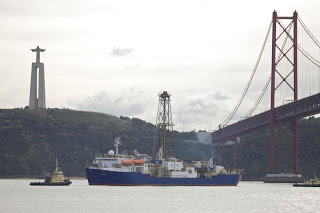
Ending a successful expedition, the JOIDES Resolution arrives in Lisbon, Portugal. (Credit: Fernando Barriga, ECORD Portugal)
Mediterranean bottom currents and the sediment deposits they leave behind offer new insights into global climate change, the opening and closing of ocean circulation gateways and locations where hydrocarbon deposits may lie buried under the sea.
A team of 35 scientists from 14 countries recently returned from an expedition off the southwest coast of Iberia and the nearby Gulf of Cadiz. There the geologists collected core samples of sediments that contain a detailed record of the Mediterranean’s history. The scientists retrieved the samples by drilling into the ocean floor during an eight-week scientific expedition onboard the ship JOIDES Resolution.
The group — researchers participating in Integrated Ocean Drilling Program (IODP) Expedition 339: Mediterranean Outflow — is the first to retrieve sediment samples from deep below the seafloor in this region.
Much of the sediment in the cores is known as “contourite” because the currents that deposit it closely follow the contours of the ocean basin.
“The recovery of nearly four kilometers of contourite sediments deposited from deep underwater currents presents a superb opportunity to understand water flow from the Mediterranean Sea to the Atlantic Ocean,” says Jamie Allan, program director at the National Science Foundation (NSF), which co-funds IODP.
“Knowledge of this water flow is important for understanding Earth’s climate history in the last five million years.”
“We now have a much greater insight into the distinctive character of contourites, and have validated beyond doubt the existing paradigm for this type of sedimentation,” says Dorrik Stow of Heriot-Watt University in the United Kingdom and co-chief scientist for Expedition 339.
The world’s oceans are far from static. Large currents flow at various depths beneath the surface. These currents form a global conveyor belt that transfers heat energy and helps buffer Earth’s climate.
Critical gateways in the oceans affect circulation of these major currents.
The Strait of Gibraltar is one such gateway. It re-opened less than six million years ago.
Today, deep below the surface, there is a powerful cascade of Mediterranean water spilling out through the strait into the Atlantic Ocean.
Because this water is saltier than the Atlantic–and therefore heavier–it plunges more than 1,000 meters downslope, scouring the rocky seafloor, carving deep-sea canyons and building up mountains of mud on a little-known submarine landscape.
The sediments hold a record of climate change and tectonic activity that spans much of the past 5.3 million years.
The team found evidence for a “tectonic pulse” at the junction between the African and European tectonic plates, which is responsible for the rising and falling of key structures in and around the gateway.
This event also led to strong earthquakes and tsunamis that dumped large flows of debris and sand into the deep sea.
At four of the seven drill sites, there was also a major chunk of the geologic record missing from the sediment cores–evidence of a strong current that scoured the seafloor.
“We set out to understand how the Strait of Gibraltar acted first as a barrier and then a gateway over the past six million years,” says Javier Hernandez-Molina of the University of Vigo in Spain and co-chief scientist for Expedition 339. “We now have that understanding and a record of a deep, powerful Mediterranean outflow through the Gibraltar gateway.”
The first drill site, located on the west Portuguese margin, provided the most complete marine sediment record of climate change over the past 1.5 million years of Earth history.
The sediment cores cover at least four major ice ages and contain a new marine archive to compare against ice core records from Greenland and Antarctica, among other land-based records.
The team was surprised to find exactly the same climate signal in the mountains of contourite mud they drilled in the Gulf of Cádiz.
Because these muds were deposited much faster than the sediments at the Portuguese margin site, the record from these cores could prove to yield even richer, more detailed climate information.
“Cracking the climate code will be more difficult for contourites because they receive a mixed assortment of sediment from varying sources,” Hernandez-Molina says.
“But the potential story that unfolds may be even more significant. The oceans and climate are inextricably linked. It seems there is an irrepressible signal of this nexus in contourite sediments.”
The team also found more sand among the contourite sediments than expected.
The scientists found this sand filling the contourite channels, deposited as thick layers within mountains of mud, and in a single, vast sand sheet that spreads out nearly 100 kilometers from the Gibraltar gateway.
All testify to the strength, velocity and duration of the Mediterranean bottom currents. The finding could affect future oil and gas exploration, the researchers believe.
“The thickness, extent and properties of these sands make them an ideal target in places where they are buried deeply enough to allow for the trapping of hydrocarbons,” Stow explains.
The sands are deposited in a different manner in channels and terraces cut by bottom currents; in contrast, typical reservoirs form in sediments deposited by downslope “turbidity” currents.
“The sand is especially clean and well-sorted, and therefore very porous and permeable,” says Stow. “Our findings could herald a significant shift in future exploration targets.”
IODP is an international research program dedicated to advancing scientific understanding of the Earth through drilling, coring, and monitoring the subseafloor.
IODP is supported by two lead agencies: the U.S. National Science Foundation and Japan’s Ministry of Education, Culture, Sports, Science, and Technology. Additional program support comes from the European Consortium for Ocean Research Drilling, the Australia-New Zealand IODP Consortium, India’s Ministry of Earth Sciences, the People’s Republic of China (Ministry of Science and Technology), and the Korea Institute of Geoscience and Mineral Resources.
The JOIDES Resolution is a scientific research vessel managed by the U.S. Implementing Organization of IODP (USIO). Texas A&M University, Lamont-Doherty Earth Observatory of Columbia University, and the Consortium for Ocean Leadership comprise the USIO.
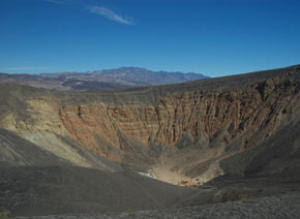
Death Valley’s half-mile-wide Ubehebe Crater turns out to have been created 800 years ago—far more recently than generally thought. (Credit: Brent Goehring/Lamont-Doherty Earth Observatory)
In California’s Death Valley, death is looking just a bit closer. Geologists have determined that the half-mile-wide Ubehebe Crater, formed by a prehistoric volcanic explosion, was created far more recently than previously thought — and that conditions for a sequel may exist today.
Up to now, geologists were vague on the age of the 600-foot deep crater, which formed when a rising plume of magma hit a pocket of underground water, creating an explosion. The most common estimate was about 6,000 years, based partly on Native American artifacts found under debris. Now, a team based at Columbia University’s Lamont-Doherty Earth Observatory has used isotopes in rocks blown out of the crater to show that it formed just 800 years ago, around the year 1200. That geologic youth means it probably still has some vigor; moreover, the scientists think there is still enough groundwater and magma around for another eventual reaction. The study appears in the current issue of the journal Geophysical Research Letters.
Ubehebe (YOU-bee-HEE-bee) is the largest of a dozen such craters, or maars, clustered over about 3 square kilometers of Death Valley National Park. The violent mixing of magma and water, resulting in a so-called phreatomagmatic explosion, blew a hole in the overlying sedimentary rock, sending out superheated steam, volcanic ash and deadly gases such as sulfur dioxide. Study coauthor Brent Goehring, (now at Purdue University) says this would have created an atom-bomb-like mushroom cloud that collapsed on itself in a donut shape, then rushed outward along the ground at some 200 miles an hour, while rocks hailed down. Any creature within two miles or more would be fatally thrown, suffocated, burned and bombarded, though not necessarily in that order.
“It would be fun to witness — but I’d want to be 10 miles away,” said Goehring of the explosion.
The team began its work after Goehring and Lamont-Doherty professor Nicholas Christie-Blick led students on a field trip to Death Valley. Noting that Ubehebe remained poorly studied, they got permission from the park to gather some 3- to 6-inch fragments of sandstone and quartzite, part of the sedimentary conglomerate rock that the explosion had torn out. In the lab, Goehring and Lamont-Doherty geochemist Joerg Schaefer applied recent advances in the analysis of beryllium isotopes, which change their weight when exposed to cosmic rays.
The isotopes change at a predictable rate when exposed to the rays, so they could pinpoint when the stones were unearthed. An intern at Lamont-Doherty, Columbia College undergraduate Peri Sasnett, took a leading role in the analysis, and ended up as first author on the paper.
The dates clustered from 2,100 to 800 years ago; the scientists interpreted this as signaling a series of smaller explosions, culminating in the big one that created the main crater around 1200. A few other dates went back 3,000 to 5,000 years; these are thought to have come from earlier explosions at smaller nearby maars. Christie-Blick said the dates make it likely that magma is still lurking somewhere below. He pointed out that recent geophysical studies by other researchers have spotted what look like magma bodies under other parts of Death Valley.
“Additional small bodies may exist in the region, even if they are sufficiently small not to show up geophysically,” he said. He added that the dates give a rough idea of eruption frequency: about every thousand years or less, which puts the current day within the realm of possibility. “There is no basis for thinking that Ubehebe is done,” he said.
Hydrological data points the same way. Phreatomagmatic explosions are thought to take place mainly in wet places, which would seem to exclude Death Valley–the hottest, driest place on the continent. Yet, as the researchers point out, Lamont-Doherty tree-ring researchers have already shown that the region was even hotter and drier during Medieval times, when the blowup took place.
If there was sufficient water then, there is certainly enough now, they say. Observations of springs and modeling of groundwater levels suggests the modern water table starts about 500 feet below the crater floor.
The researchers’ calculations suggest that it would take a spherical magma chamber as small as 300 feet across and an even smaller pocket of water to produce a Ubehebe-size incident.
Park officials are taking the study in stride. “We’ve typically viewed Ubehebe as a static feature, but of course we’re aware it could come back,” said geologist Stephanie Kyriazis, a park education specialist.
“This certainly adds another dimension to what we tell the public.” (About a million people visit the park each year.) The scientists note that any reactivation of the crater would almost certainly be presaged by warning signs such as shallow earthquakes and opening of steam vents; this could go on for years before anything bigger happened.
For perspective, Yellowstone National Park, further east, is loaded with explosion craters made by related processes, plus the world’s largest concentration of volcanically driven hot springs, geysers and fumaroles.
The U.S. Geological Survey expects an explosion big enough to create a 300-foot-wide crater in Yellowstone about every 200 years; there have already been at least 20 smaller blowouts in the past 130 years.
Visitors sometimes are boiled alive in springs, but no one has yet been blown up. Death Valley’s own fatal dangers are mainly non-geological: single-vehicle car accidents, heat exhaustion and flash floods. Rock falls, rattlesnakes and scorpions provide extra hazards, said Kyriazis. The crater is not currently on the list. “Right now, we’re not planning to issue an orange alert or anything like that,” she said.
Note : The above story is reprinted from materials provided by The Earth Institute at Columbia University.
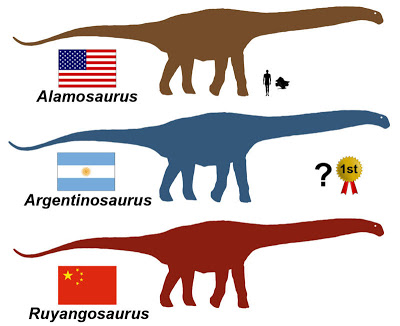
It is difficult to estimate body sizes from only fragmentary remains, but overlapping skeletal material indicates similar maximum sizes for the biggest dinosaurs. (Credit: Image courtesy of Denver Fowler)
New research from Montana State University’s Museum of the Rockies and the State Museum of Pennsylvania has unveiled enormous bones from North America’s biggest dinosaur.
In a paper published Dec. 6 in Acta Palaeontologica Polonica, MSU researcher Denver W. Fowler and coauthor Robert M. Sullivan from Harrisburg, Pa., describe two gigantic vertebrae and a femur that the team collected in New Mexico from 2003 to 2006. Carrying the vertebrae alone took most of a day and was a “killer” because the paleontologists carried them 1.2 miles through 100-degree heat, Fowler said.
The bones belong to the sauropod dinosaur Alamosaurus sanjuanensis: a long-necked plant eater related to Diplodocus. The Alamosaurus roamed what is now the southwestern United States and Mexico about 69 million years ago.
“Alamosaurus has been known for some time; its remains were first described in 1922 from the Naashoibito beds of New Mexico. Since then, more bones have been discovered in New Mexico, Utah, some really nice material from Texas, and Mexico, including a few partial skeletons,” Fowler said.
The sheer size of the new bones caught the researchers by surprise, however.
“We used to think that a fully grown Alamosaurus measured around 60 feet long and weighed about 30 tons; but a 2009 study by another MSU researcher, Dr. Holly Woodward, found that a femur thought to belong to an adult was still growing,” Fowler said. “This told us that Alamosaurus got even bigger, but we didn’t imagine that it could get quite this big.”
How big? The enormity of the new bones puts Alamosaurus in the same size league as other giant sauropods from South America, including Argentinosaurus which weighed about 70 tons, and is widely considered to be the biggest dinosaur of all.
“Over the past 20 years, Argentinean and Brazilian paleontologists have been unearthing bigger and bigger dinosaurs, putting the rest of the world in the shade,” Fowler said. “However, our new finds not only show that Alamosaurus is newly recognized as the biggest dinosaur from North America, but also that it was right up there with the biggest South American species: the US is back in the fight for the No.1 spot.”
Although comparison of the new Alamosaurus bones with the South American species gave the researchers an idea of size, giant specimens of sauropods like Alamosaurus and Argentinosaurus are only known from very fragmentary remains offering only a tantalizing glimpse of what a complete Alamosaurus might look like, Fowler said.
“We’d love to find more complete material,” Fowler continued. “Fortunately, Alamosaurus bones are quite common in the Naashoibito of New Mexico, so we have a good chance of going back and finding more, but in order to dig up one of the world’s biggest dinosaurs you need one of the world’s biggest dinosaur digging teams and large digging equipment.”
The Pennsylvania State Museum field crew is typically just two or three people, so there are limits on how many bones can be collected in one season, Fowler said. Even so, many new and important specimens have been recovered over the past 10 to 15 years, including new species, and other members of the fauna including the iconic carnivore Tyrannosaurus.
“We found a shed Tyrannosaurus tooth with another Alamosaurus neck bone that we were excavating,” Fowler said. “The Tyrannosaurus may have lost its tooth while feeding on an Alamosaurus carcass.”
The Alamosaurus discovery goes beyond just “size” bragging-rights, and may have important implications for other dinosaurs, Fowler said. Recent discoveries by paleontologist Jack Horner’s paleo lab at the Museum of the Rockies have emphasized the importance of understanding growth and ontogeny in interpreting dinosaur evolution.
“Increasingly, we’re finding that very large or small individuals often look very different, and are often described as different species,” Fowler said. “Our findings show that Alamosaurus was originally described based on immature material, and this is a problem as characteristics that define a species are typically only fully gained at adult size. This means that we might be misinterpreting the relationships of Alamosaurus and possibly other sauropod dinosaurs too.”
Note : The above story is reprinted from materials provided by Montana State University.
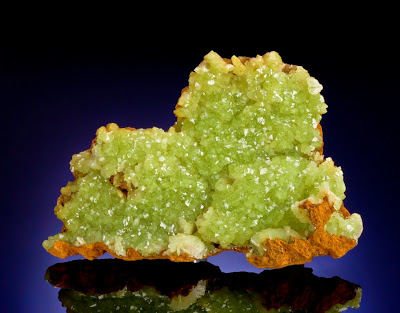
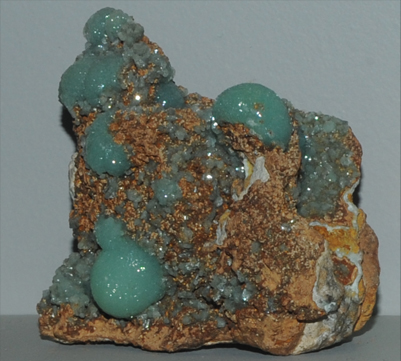
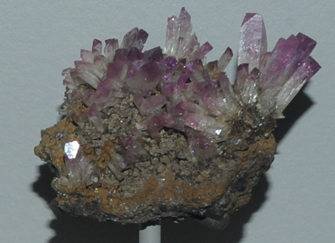
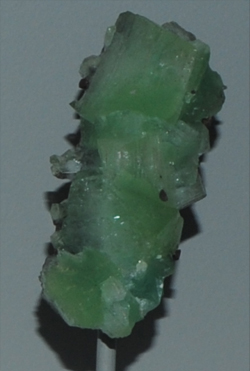
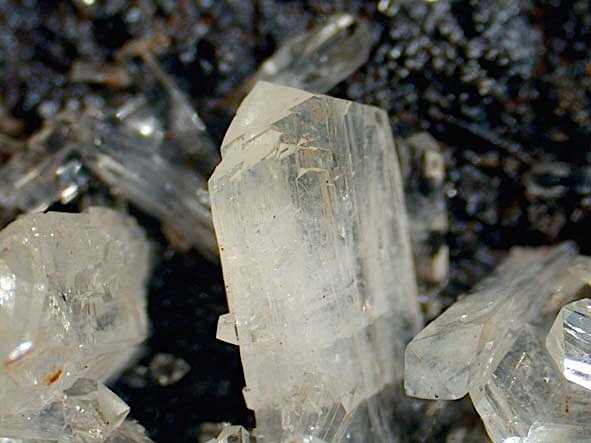
Chemical Formula: Zn2(AsO4)(OH) Locality: Chile, Atacama, Chañarcillo Name Origin: Named after the French mineralogist Gilbert Joseph Adam (1795-1881).
Adamite is a zinc arsenate hydroxide mineral, Zn2(AsO4)(OH). It is a mineral that typically occurs in the oxidized or weathered zone above zinc ore occurrences. Pure adamite is colorless, but usually it possess yellow color due to Fe compounds admixture. Tints of green also occur and are connected with copper substitutions in the mineral structure. Olivenite is a copper arsenate that is isostructural with adamite and there is considerable substitution between zinc and copper resulting in an intermediate called cuproadamite. Zincolivenite is a recently discovered mineral being an intermediate mineral with formula CuZn(AsO4)(OH). Manganese, cobalt, and nickel also substitute in the structure. An analogous zinc phosphate, tarbuttite, is known.
Physical Properties
Cleavage: {101} Good, {010} Poor Color: Yellow, Green, Violet, Pink, Yellowish green. Density: 4.3 – 4.5, Average = 4.4 Diaphaneity: Subtransparent Fracture: Brittle – Generally displayed by glasses and most non-metallic minerals. Hardness: 3.5 – Copper Penny Luminescence: Fluorescent and phosphorescent, Short UV=yellow green, Long UV=yellow green. Luster: Vitreous – Resinous Streak: white
Photos:
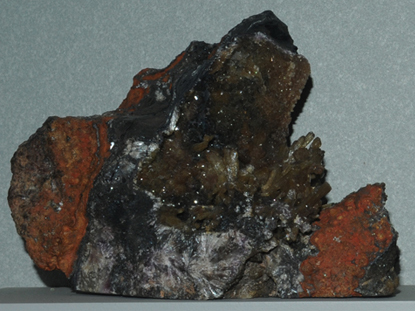
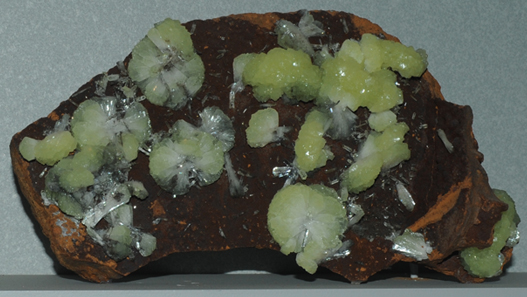
This adamite sample is from Laurion, Attike, Greece. It is about 14 x14 cm.This adamite sample is from Santa Eulalia, Chihuahua, Mexico. It is about 11 x 8 cm.This adamite sample is from Ojuela mine, Mapimi, Durango, Mexico. It is about 28 x 21 cm.
This adamite sample is from Ojuela mine, Mapimi, Durango, Mexico. It is about 35 x 20 cm.This adamite sample is from Ojuela mine, Mapimi, Durango, Mexico. It is about 4 x 10 cm.
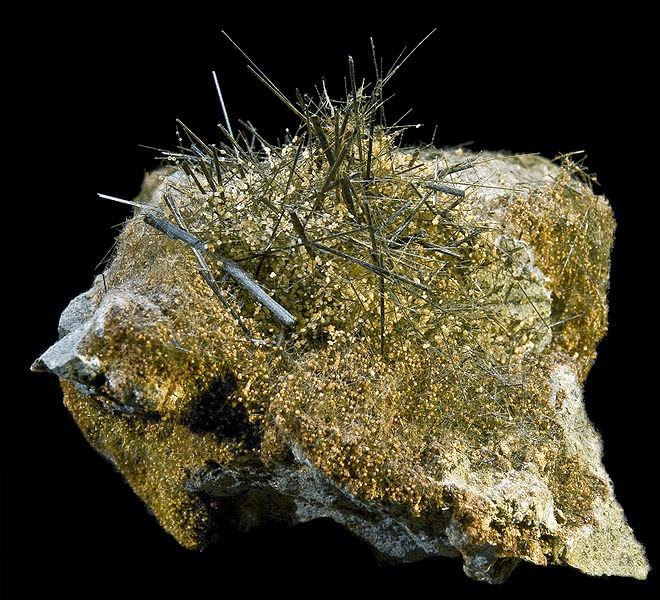
Chemical Formula: {Ca2}{(Mg,Fe2+)5}(Si8O22)(OH)2
Locality: Common world wide.
Name Origin: From the Greek, aktinos, meaning “ray” in allusion to actinolite’s fibrous nature.
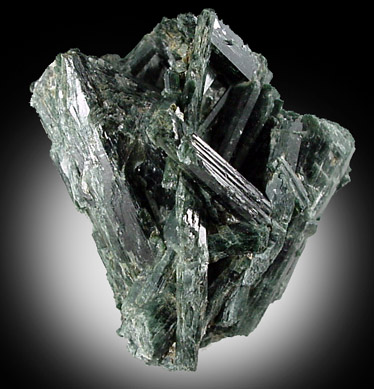
Actinolite is an amphibole silicate mineral with the chemical formula ☐Ca2(Mg4.5-2.5Fe2+0.5-2.5)Si8O22(OH)2.
Mineralogy
Actinolite is an intermediate member in a solid-solution series between magnesium-rich tremolite, ☐Ca2(Mg5.0-4.5Fe2+0.0-0.5)Si8O22(OH)2, and iron-rich ferro-actinolite, ☐Ca2(Mg2.5-0.0Fe2+2.5-5.0)Si8O22(OH)2. Mg and Fe ions can be freely exchanged in the crystal structure. Like tremolite, asbestiform actinolite is regulated as asbestos.
Occurrence
Actinolite is commonly found in metamorphic rocks, such as contact aureoles surrounding cooled intrusive igneous rocks. It also occurs as a product of metamorphism of magnesium-rich limestones.
The old mineral name uralite is at times applied to an alteration product of primary pyroxene by a mixture composed largely of actinolite. The metamorphosed gabbro or diabase rock bodies, referred to as epidiorite, contain a considerable amount of this uralitic alteration.
Fibrous actinolite is one of the six recognised types of asbestos, the fibres being so small that they can enter the lungs and damage the alveoli. Actinolite asbestos was once mined along Jones Creek at Gundagai, Australia.
Physical Properties of Actinolite
Cleavage: {110} Perfect, {110} Perfect Color: Green, Green black, Gray green, Black. Density: 2.98 – 3.1, Average = 3.04 Diaphaneity: Translucent to transparent Fracture: Splintery – Thin, elongated fractures produced by intersecting good cleavages or partings (e.g. hornblende). Hardness: 5.5 – Knife Blade Luminescence: Non-fluorescent. Luster: Vitreous (Glassy) Streak: white
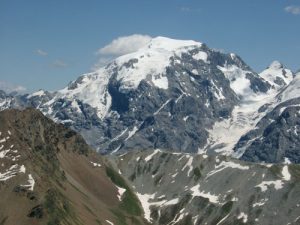
Monte Ortles seen from Piz Umbrail. Photo by Marco Borello, june 2003.
Researchers are beginning their analysis of what are probably the first successful ice cores drilled to bedrock from a glacier in the eastern European Alps.
With luck, that analysis will yield a record of past climate and environmental changes in the region for several centuries, and perhaps even covering the last 1,000 years. Scientists also hope that the core contains the remnants of early human activity in the region, such as the atmospheric byproducts of smelting metals.
The project, led by a team of Ohio State University scientists and their European colleagues, retrieved four cores from a glacier high atop Mount Ortles, a 3,905-meter (12,812-feet) peak in northeastern Italy. Three were 75 meters long (246-feet) and one was 60 meters (197 feet). They are significant in two ways:
First, scientists had previously believed that the glacier was at too low an altitude to contain ice cold enough to have preserved a clear climate record.
While the top one-third of the cores do show that melt water had percolated downwards, possibly affecting the record, the remaining two-thirds of the cores contained unaltered ice from which the research team should be able to retrieve a climate history.
Secondly, since no other ice core analyses have been retrieved from the eastern side of the Alps, this work should paint a much clearer picture of climate change in this portion of Europe.
“This glacier is already changing from the top down in a very irreversible way,” explained expedition leader Paolo Gabrielli, a research scientist at Ohio State’s Byrd Polar Research Center. “It is changing from a ‘cold’ glacier where the ice is stable to a ‘temperate’ glacier where the ice can degrade.
“The entire glacier may transition to a temperate state within the next decade or so,” he said. That probable change made the retrieval of these cores now even more important so that the ice record won’t be lost for future research.
Gabrielli said that previous research has shown already that there is an increase in summer temperatures at high elevations in the region of up to 2 degrees C (3.6 degrees F) over the last three decades. In spite of the melting in the top parts of the cores, the researchers hope to find a record that begins in the 1980s and proceeds back several centuries, or perhaps more.
Based on weather patterns, ice in the cores that was formed during past summers will likely paint a picture of past climate in an area close to the mountain, perhaps only 10 to 100 kilometers (6.21 to 62.1 miles) away.
But ice formed during past winters should provide clues to a much wider area, Gabrielli said, perhaps as much as 1,000 kilometers (621 miles).
An analysis of the ice might also answer some important questions about the region, such as the climate change in the region during the transition between the Medieval Warm Period and the Little Ice Age.
The research team, with co-leader Lonnie Thompson, Distinguished Professor of Earth Sciences at Ohio State, spent two weeks on the glacier, drilling the four cores. Along with him, Victor Zagorodnov, also from Ohio State, worked on the project.
Other team members included researchers from the University of Venice, the Russian Academy of Sciences, the University of Innsbruck, the University of Padova, the University of Pavia and the Autonomous Province of Bolzano which provided logistical support to the project.
Support from the project came from the National Science Foundation.
Note : The above story is reprinted from materials provided by Ohio State University. The original article was written by Earle Holland.
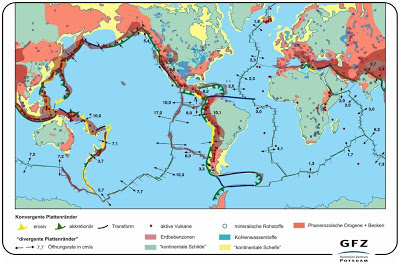
The map (with German key) show the relationship between the borders of the lithosphere plates, the global earthquake hot spots as well as the development of reservoirs, which is concentrated along the active plate boundaries. Example: the largest copper reservoir in the world (Chuquicamata) is located in the Andes. (Credit: � GFZ Potsdam)
Exactly 100 years ago, on 6 January 1912, Alfred Wegener presented his theory of continental drift to the public for the first time. At a meeting of the Geological Association in Frankfurt’s Senckenberg Museum, he revealed his thoughts on the supercontinent Pangaea, which broke apart and whose individual parts now drift across Earth as today’s continents. In 1915, he published his book “The Origin of Continents and Oceans.” Its third edition in 1922 was translated into the languages of the world and today is considered the foundation stone of plate tectonics.
Wegener’s genius idea did not only find friends, because it had the main disadvantage that it lacked the engine to break apart the supercontinent and move huge continental masses over Earth’s surface. Indeed, only by the seismology of the 1950s and through scientific drilling in the oceans in the 1960s, the foundation for plate tectonics was laid — at the same time, however, Wegener’s groundbreaking theory was turned upside down.
Seismological insights
Earthquakes are not only terrible natural disasters, they also offer a view inside Earth. It was the geophysicists Wadati and Benioff, who in 1954 independently discovered the systematic arrangement of earthquakes in the places which we now know as plate boundaries.
“More than 90% of the global seismic energy is released at the plate boundaries,” says Professor Michael Weber, head seismologist at the German Research Centre for Geosciences GFZ. “We use these earthquakes for tomographic screening of the Earth.
” With modern methods of scientific seismology it is even possible to reconstruct how quickly the continents moved. The speed record is held by India, which started to make its way from East Gondwana to Eurasia about 140 million years ago — at a speed of 20 centimeters per year.
Drilling into the ocean floor
The real breakthrough, however, came only when those findings were combined with the research results from the great ocean drilling programs of the sixties. Previously, using magnetic measurements of the ocean floor and topography of the seabed the mid-ocean ridges had been discovered, as well as a magnetic polarization of the rocks in parallel strips either side of mid-ocean ridges. Now, the obtained cores showed: No piece of the drilled ocean floor was older than 200 million years, and therefore decidedly younger than Wegener had assumed. Continental rocks, in contrast, can achieve an age of more than four billion years. Secondly, it could be shown that the ocean floor is very young in the immediate vicinity of the mid-ocean ridges. With increasing distance from these undersea mountains, the rocks exhibit an increase in age.
Thirdly, the ocean floors below the top layer of sediment are entirely of magmatic origin. “These results could in fact only allow one interpretation. From the interior of the Earth, hot, liquid rock rises to these ridges and pushes the ocean floor off to the side”, explains Dr. Ulrich Harms, who at the GFZ directs the “Centre for Scientific Drilling.
” “Not the continents drift, but entire tectonic plates, which consist of continents , ocean floors, and parts of the upper mantle.”
Ascending rocks and the engine of plate tectonics
All these findings in the second half of the sixties put Wegener’s ingenious discoveries into a correct context, and also flipped his theory from the head to its feet: not only were his assumptions as to the age of oceans and continents completely reversed, the idea that the continents plow the ocean turns around so that continents and oceans move together as a common upper part of the lithospheric plates. The continents float on top as the lightest rocks, so to speak.
These tectonic plates move, collide, grind past each other or drift apart. All these processes are associated with earthquakes, which can thus be explained as part of the overall process. But what forces the heavy rock inside Earth to rise?
The enormous heat inside Earth’s core and mantle comes in one part from the formation of Earth, in another from the radioactive decay of elements in the mantle. The heated rock rises and induces the movement expressed on the surface as a displacement of the plates.
The quiet revolution in the theory of tectonics
The classical concept of tectonics as a quasi mechanical process of the movement and collision of rigid plates is now itself in disarray. “Recent findings show plate tectonics as a self-regulating system of interactions, in which all the subsystems of the planet earth are involved”, explains Professor Onno Oncken.
The Director of the Department “Geodynamics” at GFZ notes: “It is not a mechanical system, but rather complex feedback processes.
” The climate as example: high-altitude mountains have a decisive influence on the climate, of course. But that the climate in turn controls the tectonics, is a new discovery: the Andes, for example, are caused by the collision of the Nazca plate with South America.
The humid climate of the South Andes leads to the erosion of material that ends up as sediment in the Pacific. The Nazca plate approaching from the west deposits this rock on the South American crust.
The arid climate of the Northern and Central Andes, however, gives rise to no sediment, therefore the Nazca plate rasps off the continental crust here.
The thus created great increase in friction in turn transmits a force that causes the Andean plateau to gain height and width. This in turn enhances the rain shadow on the west side of the Andes and additionally reduces erosion.
The classical notion of folded mountains as a result of a collision also had to be revised: “The Andes, for example, in their present form, exist for about 45 million years, the subduction of the Nazca plate beneath South America has been going on since the Paleozoic, so hundreds of millions of years longer,” says Onno Oncken.
Similarly, the interplay between the hot, rising rock masses and Earth’s crust is much more complex than originally thought. When a hot rock bubble rises, the poorly heat-conductive lithosphere acts as a boundary layer to the surface like a blanket, which in turn increases the temperature further below.
This heat buildup can eventually soften whole continents like a welding torch until they dissolve, as it happened around 140 to 130 million years ago, when Gondwana fell apart first in the East, then in the West.
At that time Africa also separated from South America, but it was exactly the contours of these two continents that sparked Wegener’s idea. Professor Oncken: “Wegener’s approach was the starting point, the plate tectonics of the previous century was the revolution in geoscientific perception.
Today we see an equally thorough, quiet revolution in the theory of plate tectonics, because we understand our planet increasingly as a complete system.”
Note : The above story is reprinted from materials provided by Helmholtz Centre Potsdam – GFZ German Research Centre for Geosciences, via AlphaGalileo.
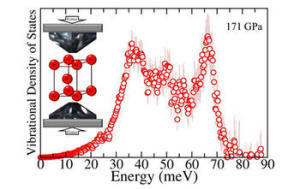
The vibrational spectrum of iron, the most abundant element in Earth’s core, at 171 gigapascals. By squeezing iron between two diamond anvils (inset), Caltech researchers reproduced the pressures found in Earth’s core. (Credit: Caitlin A. Murphy/Caltech)
Identifying the composition of Earth’s core is key to understanding how our planet formed and the current behavior of its interior. While it has been known for many years that iron is the main element in the core, many questions have remained about just how iron behaves under the conditions found deep inside Earth. Now, a team led by mineral-physics researchers at the California Institute of Technology (Caltech) has honed in on those behaviors by conducting extremely high-pressure experiments on the element.
“Pinpointing the properties of iron is the gold standard — or I guess ‘iron standard’ — for how the core behaves,” says Jennifer Jackson, assistant professor of mineral physics at Caltech and coauthor of the study, which appears in the December 20 issue of Geophysical Research Letters. “That is where most discussions about the deep interior of the Earth begin. The temperature distribution, the formation of the planet — it all goes back to the core.”
To learn more about how iron behaves under the extreme conditions that exist in Earth’s core, the team used diamond anvil cells (DAC) to compress tiny samples of the element. The DACs use two small diamonds to squeeze the iron, reproducing the types of pressures felt in Earth’s core. These particular samples were pressurized to 171 Gigapascals, which is 1.7 million times the pressure we feel on the surface of Earth.
To complete the experiments, the team took the DACs to the Advanced Photon Source at Argonne National Laboratory in Illinois, where they were able to use powerful X-rays to measure the vibrational density of states of compressed iron. This information allows the researchers to determine how quickly sound waves move through iron and compare the results to seismic observations of the core.
“The vibrational properties that we were able to measure at extraordinarily high pressures are unprecedented,” says Jackson. “These pressures exist in the Earth’s outer core, and are very difficult to reproduce experimentally.”
Caitlin Murphy, a graduate student in Jackson’s group and first author of the paper, says the group was happy to find that their data set on the vibrational properties of iron evolved smoothly over a very wide pressure range, suggesting that their pressure-dependent analysis was robust, and that iron did not encounter any phase changes over this pressure range. To help achieve these successful measurements at high pressures, the group used some innovative techniques to keep the iron from thinning out in the DACs, such as preparing an insert to stabilize the sample chamber during compression.
Additionally, they measured the volume of the compressed iron sample in situ and hydrostatically loaded the iron sample with neon into the sample chamber.
“These techniques allowed us to get the very high statistical quality we wanted in a reasonable amount of time, thus allowing us to obtain accurate vibrational properties of compressed iron, such as its Grüneisen parameter,” says Jackson. “The Grüneisen parameter of a material describes how its total energy changes with compression and informs us on how iron may behave in the Earth’s core. It is an extremely difficult quantity to measure accurately.”
The team was also able to get a closer estimate of the melting point of iron from their experiments — which they report to be around 5800 Kelvin at the boundary between Earth’s solid inner core and liquid outer core. This information, combined with the other vibrational properties they found, gives the group important clues for estimating the amount of light elements, or impurities, in the core.
By comparing the density of iron at the relevant pressure and temperature conditions with seismic observations of the core’s density, they found that iron is 5.5 percent more dense than the solid inner core at this boundary.
“With our new data on iron, we can discuss several aspects of the Earth’s core with more certainty
and narrow down the amount of light elements that may be needed to help power the geodynamo — the process responsible for maintaining the Earth’s magnetic field, which originates in the core,” says Jackson.
According to Murphy, the next step is to perform similar experiments alloying iron with nickel and various light elements to determine how the density and, in particular, the vibrational properties of pure iron are affected. In turn, they will be able to evaluate the amount of light elements that produce a closer match to seismic observations of the core.
“There are a few candidate light elements for the core that everyone is always talking about — sulfur, silicon, oxygen, carbon, and hydrogen, for instance,” says Murphy. “Silicon and oxygen are a few of the more popular, but they have not been studied in this great of detail yet. So that’s where we will begin to expand our study.”
The study was funded by the California Institute of Technology, the National Science Foundation, and the U.S. Department of Energy. Bin Chen, a former postdoctoral scholar in Jackson’s lab, and Wolfgang Sturhahn, senior technologist at NASA’s Jet Propulsion Laboratory and visiting associate at Caltech, were also coauthors on the paper.
Note : The above story is reprinted from materials provided by California Institute of Technology.
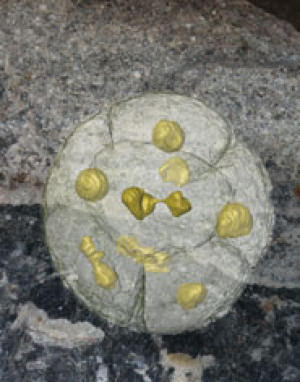
570 million year old multicellular spore body undergoing vegetative nuclear and cell division (foreground) based on synchrotron x-ray tomographic microscopy of fossils recovered from rocks in South China. The background shows a cut surface through the rock – every grain (about 1 mm diameter) is an exceptionally preserved gooey ball of dividing cells turned to stone. (Credit: Image courtesy of University of Bristol)
Evidence of the single-celled ancestors of animals, dating from the interval in Earth’s history just before multicellular animals appeared, has been discovered in 570 million-year-old rocks from South China by researchers from the University of Bristol, the Swedish Museum of Natural History, the Paul Scherrer Institut and the Chinese Academy of Geological Sciences.
All life evolved from a single-celled universal common ancestor, and at various times in Earth history, single-celled organisms threw their lot in with each other to become larger and multicellular, resulting, for instance, in the riotous diversity of animals. However, fossil evidence of these major evolutionary transitions is extremely rare.
The fossils, reported this week in Science, preserve stages in the life cycle of an amoeba-like organism dividing in asexual cycles, first to produce two cells, then four, eight, 16, 32 and so on, ultimately resulting in hundreds of thousands of spore-like cells that were then released to start the cycle over again. The pattern of cell division is so similar to the early stages of animal (including human) embryology that until now they were thought to represent the embryos of the earliest animals.
The researchers studied the microscopic fossils using high energy X-rays at the Swiss Light Source in Switzerland, revealing the organisation of the cells within their protective cyst walls. The organisms should not have been fossilized — they were just gooey clusters of cells — but they were buried in sediments rich in phosphate that impregnated the cell walls and turned them to stone.
Lead author Therese Huldtgren said: “The fossils are so amazing that even their nuclei have been preserved.”
Co-author Dr John Cunningham said: “We used a particle accelerator called a synchrotron as our X-ray source. It allowed us to make a perfect computer model of the fossil that we could cut up in any way that we wanted, but without damaging the fossil in any way. We would never have been able to study the fossils otherwise!”
This X-ray microscopy revealed that the fossils had features that multicellular embryos do not, and this led the researchers to the conclusion that the fossils were neither animals nor embryos but rather the reproductive spore bodies of single-celled ancestors of animals.
Professor Philip Donoghue said: “We were very surprised by our results — we’ve been convinced for so long that these fossils represented the embryos of the earliest animals — much of what has been written about the fossils for the last ten years is flat wrong. Our colleagues are not going to like the result.”
Professor Stefan Bengtson said: “These fossils force us to rethink our ideas of how animals learned to make large bodies out of cells.”
The research was funded by the Natural Environment Research Council, the Swedish Research Council, the Paul Scherrer Institut, Ministry of Science and Technology of China, National Natural Science Foundation of China, and EU FP7.
Note : The above story is reprinted from materials provided by University of Bristol.
The crushing pressures and intense temperatures in Earth’s deep interior squeeze atoms and electrons so closely together that they interact very differently. With depth materials change. New experiments and supercomputer computations have revealed that iron oxide undergoes a new kind of transition under deep Earth conditions. Iron oxide, FeO, is a component of the second most abundant mineral at Earth’s lower mantle, ferropericlase.
The finding, published in an upcoming issue of Physical Review Letters, could alter our understanding of deep Earth dynamics and the behavior of the protective magnetic field, which shields our planet from harmful cosmic rays.
Ferropericlase contains both magnesium and iron oxide. To imitate the extreme conditions in the lab, the team including coauthor Ronald Cohen of Carnegie’s Geophysical Laboratory, studied the electrical conductivity of iron oxide to pressures and temperatures up to 1.4 million times atmospheric pressure and 4000°F — on par with conditions at the core-mantle boundary. They also used a new computational method that uses only fundamental physics to model the complex many-body interactions among electrons. The theory and experiments both predict a new kind of metallization in FeO.
Compounds typically undergo structural, chemical, electronic, and other changes under these extremes. Contrary to previous thought, the iron oxide went from an insulating (non-electrical conducting) state to become a highly conducting metal at 690,000 atmospheres and 3000°F, but without a change to its structure. Previous studies had assumed that metallization in FeO was associated with a change in its crystal structure. This result means that iron oxide can be both an insulator and a metal depending on temperature and pressure conditions.
“At high temperatures, the atoms in iron oxide crystals are arranged with the same structure as common table salt, NaCl,” explained Cohen. “Just like table salt, FeO at ambient conditions is a good insulator — it does not conduct electricity. Older measurements showed metallization in FeO at high pressures and temperatures, but it was thought that a new crystal structure formed. Our new results show, instead, that FeO metallizes without any change in structure and that combined temperature and pressure are required. Furthermore, our theory shows that the way the electrons behave to make it metallic is different from other materials that become metallic.”
“The results imply that iron oxide is conducting in the whole range of its stability in Earth’s lower mantle.” Cohen continues, “The metallic phase will enhance the electromagnetic interaction between the liquid core and lower mantle. This has implications for Earth’s magnetic field, which is generated in the outer core.
It will change the way the magnetic field is propagated to Earth’s surface, because it provides magnetomechanical coupling between the Earth’s mantle and core.”
“The fact that one mineral has properties that differ so completely — depending on its composition and where it is within the Earth — is a major discovery,” concluded Geophysical Laboratory director Russell Hemley.
Roadway in Leogane, Haiti. (Credit: Estelle Chaussard)
A groundbreaking study led by University of Miami (UM) scientist Shimon Wdowinski shows that earthquakes, including the recent 2010 temblors in Haiti and Taiwan, may be triggered by tropical cyclones (hurricanes and typhoons). Wdowinski will discuss his findings during a presentation at the 2011 AGU Fall Meeting in San Francisco.
“Very wet rain events are the trigger,” said Wdowinski, associate research professor of marine geology and geophysics at the UM Rosenstiel School of Marine and Atmospheric Science. “The heavy rain induces thousands of landslides and severe erosion, which removes ground material from the Earth’s surface, releasing the stress load and encouraging movement along faults.”
Wdowinski and a colleague from Florida International University analyzed data from quakes magnitude-6 and above in Taiwan and Haiti and found a strong temporal relationship between the two natural hazards, where large earthquakes occurred within four years after a very wet tropical cyclone season.
During the last 50 years three very wet tropical cyclone events — Typhoons Morakot, Herb and Flossie — were followed within four years by major earthquakes in Taiwan’s mountainous regions. The 2009 Morakot typhoon was followed by a M-6.2 in 2009 and M-6.4 in 2010. The 1996 Typhoon Herb was followed by M-6.2 in 1998 and M-7.6 in 1999 and the 1969 Typhoon Flossie was followed by a M-6.2 in 1972.
The 2010 M-7 earthquake in Haiti occurred in the mountainous region one-and-a-half years after two hurricanes and two tropical storms drenched the island nation within 25 days.
The researchers suggest that rain-induced landslides and excess rain carries eroded material downstream. As a result the surface load above the fault is lessened.
“The reduced load unclamp the faults, which can promote an earthquake,” said Wdowinski.
Fractures in Earth’s bedrock from the movement of tectonic plates, known as faults, build up stress as they attempt to slide past each other, periodically releasing the stress in the form of an earthquake.
According to the scientists, this earthquake-triggering mechanism is only viable on inclined faults, where the rupture by these faults has a significant vertical movement.
Wdowinski also shows a trend in the tropical cyclone-earthquake pattern exists in M-5 and above earthquakes. The researchers plan to analyze patterns in other seismically active mountainous regions — such as the Philippines and Japan — that are subjected to tropical cyclones activity.
Note : The above story is reprinted from materials provided by University of Miami Rosenstiel School of Marine & Atmospheric Science.
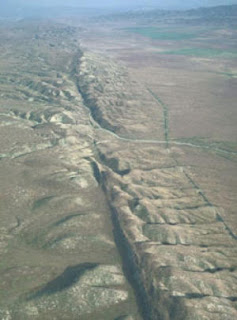
San Andreas fault zone, Carrizo Plains, central California. (Credit: Photo by R.E. Wallace, USGS)
Geophysicists from Potsdam have established a mode of action that can explain the irregular distribution of strong earthquakes at the San Andreas Fault in California. Reporting in the latest issue of the journal Nature, the scientists examined the electrical conductivity of the rocks at great depths, which is closely related to the water content within the rocks. From the pattern of electrical conductivity and seismic activity they were able to deduce that rock water acts as a lubricant.
Los Angeles moves toward San Francisco at a pace of about six centimeters per year, because the Pacific plate with Los Angeles is moving northward, parallel to the North American plate which hosts San Francisco. But this is only the average value.
In some areas, movement along the fault is almost continuous, while other segments are locked until they shift abruptly several meters against each other releasing energy in strong earthquakes. After the San Francisco earthquake of 1906, the plates had moved by six meters.
The San Andreas Fault acts like a seam in Earth, ranging through the entire crust and reaching into the mantle. Geophysicists from the GFZ German Research Centre for Geosciences have succeeded in imaging this interface to great depths and to establish a connection between processes at depth and events at surface.
“When examining the image of the electrical conductivity, it becomes clear that rock water from depths of the upper mantle, i.e. between 20 to 40 km, can penetrate the shallow areas of the creeping section of the fault, while these fluids are detained in other areas beneath an impermeable layer,” says Dr. Oliver Ritter of the GFZ. “A sliding of the plates is supported, where fluids can rise.”
These results suggest that significant differences exist in the mechanical and material properties along the fault at depth. The so-called tremor signals, for instance, appear to be linked to areas underneath the San Andreas Fault, where fluids are trapped. Tremors are low-frequency vibrations that are not associated with rupture processes as they are typical of normal earthquakes. These observations support the idea that fluids play an important role in the onset of earthquakes.
Note : The above story is reprinted from materials provided by Helmholtz Centre Potsdam – GFZ German Research Centre for Geosciences.
Planet Earth. The composition of Earth’s core remains a mystery. (Credit: NASA)
The composition of Earth’s core remains a mystery. Scientists know that the liquid outer core consists mainly of iron, but it is believed that small amounts of some other elements are present as well. Oxygen is the most abundant element in the planet, so it is not unreasonable to expect oxygen might be one of the dominant “light elements” in the core. However, new research from a team including Carnegie’s Yingwei Fei shows that oxygen does not have a major presence in the outer core. This has major implications for our understanding of the period when Earth formed through the accretion of dust and clumps of matter.
Their work is published Nov. 24 in Nature.
According to current models, in addition to large amounts of iron, Earth’s liquid outer core contains small amounts of so-called light elements, possibly sulfur, oxygen, silicon, carbon, or hydrogen. In this research, Fei, from Carnegie’s Geophysical Laboratory, worked with Chinese colleagues, including lead author Haijun Huang from China’s Wuhan University of Technology, now a visiting scientist at Carnegie. The team provides new experimental data that narrow down the identity of the light elements present in Earth’s outer core.
With increasing depth inside Earth, the pressure and heat also increase. As a result, materials act differently than they do on the surface. At Earth’s center are a liquid outer core and a solid inner core. The light elements are thought to play an important role in driving the convection of the liquid outer core, which generates Earth’s magnetic field.
Scientists know the variations in density and speed of sound as a function of depth in the core from seismic observations, but to date it has been difficult to measure these properties in proposed iron alloys at core pressures and temperatures in the laboratory.
“We can’t sample the core directly, so we have to learn about it through improved laboratory experiments combined with modeling and seismic data,” Fei said.
High-speed impacts can generate shock waves that raise the temperature and pressure of materials simultaneously, leading to melting of materials at pressures corresponding to those in the outer core. The team carried out shock-wave experiments on core materials, mixtures of iron, sulfur, and oxygen. They shocked these materials to the liquid state and measured their density and speed of sound traveling through them under conditions directly comparable to those of the liquid outer core.
By comparing their data with observations, they conclude that oxygen cannot be a major light element component of Earth’s outer core, because experiments on oxygen-rich materials do not align with geophysical observations. This supports recent models of core differentiation in early Earth under more ‘reduced’ (less oxidized) environments, leading to a core that is poor in oxygen.
“The research revealed a powerful way to decipher the identity of the light elements in the core. Further research should focus on the potential presence of elements such as silicon in the outer core,” Fei said.
Portions of this work were supported by grants from the National Natural Science Foundation of China, the Fundamental Research Funds for the Central Universities, and the National Basic Research of China, as well as the National Science Foundation and the Carnegie Institution for Science.
Note : The above story is reprinted from materials provided by Carnegie Institution.
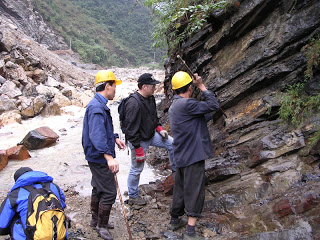
Charles Henderson (middle) of the University of Calgary collects material from a sedimentary layer in Shangsi, Sichuan Province, China. This was one of more important sections studied for ash layers and marine fossils used to pinpoint the dates and rate of Earth’s massive extinction. (Credit: Charles Henderson)
It’s well known that Earth’s most severe mass extinction occurred about 250 million years ago. What’s not well known is the specific time when the extinctions occurred. A team of researchers from North America and China have published a paper in Science which explicitly provides the date and rate of extinction.
This is the first paper to provide rates of such massive extinction,” says Dr. Charles Henderson, professor in the Department of Geoscience at the University of Calgary and co-author of the paper: Calibrating the end-Permian mass extinction. “Our information narrows down the possibilities of what triggered the massive extinction and any potential kill mechanism must coincide with this time.”
About 95 percent of marine life and 70 percent of terrestrial life became extinct during what is known as the end-Permian, a time when continents were all one land mass called Pangea. The environment ranged from desert to lush forest. Four-limbed vertebrates were becoming diverse and among them were primitive amphibians, reptiles and a group that would, one day, include mammals.
Through the analysis of various types of dating techniques on well-preserved sedimentary sections from South China to Tibet, researchers determined that the mass extinction peaked about 252.28 million years ago and lasted less than 200,000 years, with most of the extinction lasting about 20,000 years.
“These dates are important as it will allow us to understand the physical and biological changes that took place,” says Henderson. “We do not discuss modern climate change, but obviously global warming is a biodiversity concern today. The geologic record tells us that ‘change’ happens all the time, and from this great extinction life did recover.
” There is ongoing debate over whether the death of both marine and terrestrial life coincided, as well as over kill mechanisms, which may include rapid global warming, hypercapnia (a condition where there is too much CO2 in the blood stream), continental aridity and massive wildfires.
The conclusion of this study says extinctions of most marine and terrestrial life took place at the same time. And the trigger, as suggested by these researchers and others, was the massive release of CO2 from volcanic flows known as the Siberian traps, now found in northern Russia.
Henderson’s conodont research was integrated with other data to establish the study’s findings. Conodonts are extinct, soft-bodied eel-like creatures with numerous tiny teeth that provide critical information on hydrocarbon deposits to global extinctions.
Note : The above story is reprinted from materials provided by University of Calgary. The original article was written by Leanne Yohemas.
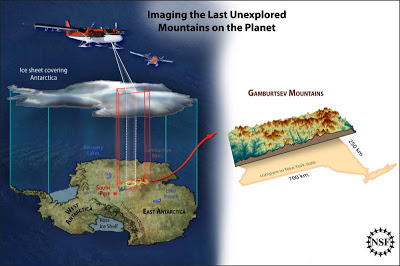
An artist’s rendering of the Antarctica Gamburstev Province (AGAP) project. (Credit: Zina Deretsky / NSF)
Buried below more than a mile of ice, Antarctica’s Gamburtsev Mountains have baffled scientists since their discovery in 1958. How did the mountains get there, and what role did they play in the spread of glaciers over the continent 30 million years ago? In the latest study on the mountains, scientists in the journal Nature say they have pieced together the puzzle of the origins and evolution of this mysterious mountain chain.
An international team of scientists flew over Antarctica’s deep interior in 2008-2009 with ice-penetrating radar, gravity meters and magnetometers to reveal the peaks and valleys hidden below the ice. The data they gathered has provided insight into how the mountains arose. One billion years ago, before animals or plants appeared on land, several continents collided and the oldest rocks that make up the Gamburtsevs smashed together. From the collision, a thick crustal root formed deep beneath the mountain range.
Over time, these ancient mountains were eroded but the cold dense root remained.
Between 250 and 100 million years ago — when dinosaurs walked Earth — the supercontinent Gondwana, which included Antarctica, ripped apart, causing the old crustal root to warm. Reactivated, the crustal root and the East Antarctic Rift pushed land upwards again, reforming the mountains. Rivers and glaciers carved deep valleys and raised peaks to create a spectacular landscape that resembled the European Alps.
The East Antarctic Ice Sheet, which formed 34 million years ago and at 10 million square kilometers covers an area the size of Canada, protected the mountains from erosion.
“It has been almost a billion years since the Gamburtsev first formed,” said study co-author Robin Bell, a geophysicist at Columbia University’s Lamont-Doherty Earth Observatory. “This work shows that very old mountains can rise again, like a Phoenix from the ashes. The Gamburtsevs rose from the long eroded East Antarctic craton.”
The study also resolves an apparent contradiction: how could such ancient mountains have retained their tall, jagged, and youthful peaks, said study co-author Carol Finn, a scientist at the U.S. Geological Survey. “We are accustomed to thinking that mountain building relates to a single tectonic event, rather than sequences of events,” she said.
“The lesson we learned about multiple events forming the Gamburtsevs may inform studies of the history of other mountain belts.”
“It was fascinating to find that the East Antarctic rift system resembles one of the geological wonders of the world — the East African rift system — and that it provides the missing piece of the puzzle that helps explain the Gamburtsev Subglacial Mountains,” said study lead author Fausto Ferraccioli, a scientist at British Antarctic Survey.
“The rift system was also found to contain the largest subglacial lakes in Antarctica.”
The team’s next goal is to drill through the ice and collect the first Gamburtsev rock samples. “Amazingly, we have samples of the moon but none of the Gamburtsevs,” said Bell. “With these rock samples we will be able to constrain when this ancient piece of crust was rejuvenated and grew to a magnificent mountain range.”
The work was funded by grants from the U.S. National Science Foundation (NSF) and was launched in conjunction with the International Polar Year, an effort to study the Arctic and Antarctic spanning 2007-2009 and involving research by thousands of scientists from more than 60 nations. “It is very fitting that the initial results of Antarctica’s Gamburtsev Province project are coming out 100 years after the great explorers raced to the South Pole,” said Alexandra Isern, program director at NSF.
“The scientific explorers of the AGAP project worked in harsh conditions to collect the data and detailed images of this major mountain range under the East Antarctic Ice Sheet. The results of their work will guide research in this region for many years to come.”
Support also came from the Natural Environment Research Council of Britain and the British Antarctic Survey, the Federal Institute for Geosciences and Resources in Germany and the Polar Research Institute of China.
Note : The above story is reprinted from materials provided by Columbia University’s Lamont-Doherty Earth Observatory.
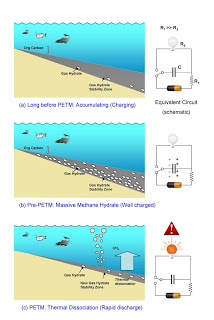
Research at Rice University bolstered a long-controversial theory that massive amounts of carbon from methane hydrate caused the Earth to warm 56 million years ago and drastically change the ecosystem. Rice scientists proposed in a new Nature Geoscience paper that hydrates collected in a narrower stability zone than today under the seafloor over millions of years were discharged rapidly as the planet warmed, much as an electrical capacitor gathers charge and releases it quickly. (Credit: Guangsheng Gu/Rice University)
The release of massive amounts of carbon from methane hydrate frozen under the seafloor 56 million years ago has been linked to the greatest change in global climate since a dinosaur-killing asteroid presumably hit Earth 9 million years earlier. New calculations by researchers at Rice University show that this long-controversial scenario is quite possible.
Nobody knows for sure what started the incident, but there’s no doubt Earth’s temperature rose by as much as 6 degrees Celsius. That affected the planet for up to 150,000 years, until excess carbon in the oceans and atmosphere was reabsorbed into sediment.
Earth’s ecosystem changed and many species went extinct during the Paleocene-Eocene Thermal Maximum (PETM) 56 million years ago, when at least 2,500 gigatonnes of carbon, eventually in the form of carbon dioxide, were released into the ocean and atmosphere. (The era is described in great detail in a recent National Geographic feature.)
A new report by Rice scientists in Nature Geoscience suggests that at the time, even though methane-containing gas hydrates — the “ice that burns” — occupied only a small zone of sediment under the seabed before the PETM, there could have been as much stored then as there is now.
This is a concern to those who believe the continued burning of fossil fuels by humans could someday trigger another feedback loop that disturbs the stability of methane hydrate under the ocean and in permafrost; this change could warm the atmosphere and prompt the release of large amounts of methane, a more powerful greenhouse gas than carbon dioxide.
Some who study the PETM blame the worldwide burning of peat, volcanic activity or a massive asteroid strike as the source of the carbon, “but there’s no crater, or any soot or evidence of the burning of peat,” said Gerald Dickens, a Rice professor of Earth science and an author of the study, who thinks the new paper bolsters the argument for hydrates.
The lead author is graduate student Guangsheng Gu; co-authors are Walter Chapman, the William W. Akers Professor in Chemical Engineering; George Hirasaki, the A.J. Hartsook Professor in Chemical Engineering; and alumnus Gaurav Bhatnagar, all of Rice; and Frederick Colwell, a professor of ocean ecology and biogeochemistry at Oregon State University.
In the ocean, organisms die, sink into the sediment and decompose into methane. Under high pressure and low temperatures, methane molecules are trapped by water, which freezes into a slushy substance known as gas hydrate that stabilizes in a narrow band under the seafloor.
Warmer oceans before the PETM would have made the stability zone for gas hydrate thinner than today, and some scientists have argued this would allow for much less hydrate than exists under the seafloor now. “If the volume — the size of the box — was less than today, how could it have released so much carbon?” Dickens asked. “Gu’s solution is that the box contains a greater fraction of hydrate.”
“The critics said, ‘No, this can’t be. It’s warmer; there couldn’t have been more methane hydrate,'” Hirasaki said. “But we applied the numerical model and found that if the oceans were warmer, they would contain less dissolved oxygen and the kinetics for methane formation would have been faster.”
With less oxygen to consume organic matter on the way down, more sank to the ocean floor, Gu said, and there, with seafloor temperatures higher than they are today, microbes that turn organic matter into methane work faster. “Heat speeds things up,” Dickens said. “It’s true for almost all microbial reactions. That’s why we have refrigerators.”
The result is that a stability zone smaller than what exists now may have held a similar amount of methane hydrate. “You’re increasing the feedstock, processing it faster and packing it in over what could have been millions of years,” Dickens said.
While the event that began the carbon-discharge cycle remains a mystery, the implications are clear, Dickens said. “I’ve always thought of (the hydrate layer) as being like a capacitor in a circuit. It charges slowly and can release fast — and warming is the trigger. It’s possible that’s happening right now.”
That makes it important to understand what occurred in the PETM, he said. “The amount of carbon released then is on the magnitude of what humans will add to the cycle by the end of, say, 2500. Compared to the geological timescale, that’s almost instant.”
“We run the risk of reproducing that big carbon-discharge event, but faster, by burning fossil fuel, and it may be severe if hydrate dissociation is triggered again,” Gu said, adding that methane hydrate also offers the potential to become a valuable source of clean energy, as burning methane emits much less carbon dioxide than other fossil fuels.
The calculations should encourage geologists who discounted hydrates’ impact during the PETM to keep an open mind, Dickens said. “Instead of saying, ‘No, this cannot be,’ we’re saying, ‘Yes, it’s certainly possible.'”
The United States Department of Energy supported the research.
Note : The above story is reprinted from materials provided by Rice University.