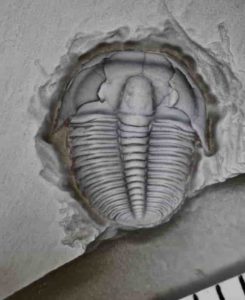
If you’ve ever held a trilobite fossil, seen one in a classroom, or walked by one in a store, chances are it was Elrathia kingii, one of the most common and well-recognized trilobites, and collected by the hundreds of thousands in western Utah. But despite the popularity of this species, scientists had not determined how it grew—from hatchling to juvenile to adult—until now. New work from the American Museum of Natural History published today in the journal Papers in Palaeontology describes the development and growth rate of Elrathia kingii—only the second such dataset to be compiled for a trilobite—allowing for the first comparison among trilobite species.
“There’s quite a big size range among trilobites. Some never got bigger than about a centimeter, while the largest on record is 72 centimeters (28 inches),” said Melanie Hopkins, an associate curator in the Museum’s Division of Paleontology and the study’s author. “Growth-rate studies like this one can help us tackle some of the big-picture questions: How did some trilobites get so big? What was the environmental context for that? And how did body size evolve over the evolutionary history of the clade?”
Trilobites are a group of extinct marine arthropods—distantly related to the horseshoe crab—that lived for almost 300 million years. They were incredibly diverse, with more than 20,000 described species. Their fossilized exoskeletons are preserved in sites all over the world, from the United States to China. Like insects, they molted throughout their lifetimes, leaving clues to how they changed during development. But to calculate the species’ growth rate, scientists need fossils representing all stages of the animal’s life—and lots of them.
“There are tons of specimens of Elrathia kingii out there but most of them are adults, and data from exactly where they were collected is inconsistent,” Hopkins said. “I needed material that I could collect from as small a section as possible that included a lot of juveniles.”
So in May 2018, Hopkins spent five days in Utah with a crew consisting of Museum staff and volunteers at a new fossil site said to preserve bucketloads of Elrathia kingii. By the end of the trip, they had collected about 500 specimens—many of them juveniles, which can be as small as half a millimeter long—from a section of outcrop just 1.5 meters (about 5 feet) long.
Hopkins estimated the growth rate and compared it to previously published data on a different trilobite, Aulacopleura konincki—the first time two trilobite species have been compared in this way. The two species look very similar and Hopkins found that they also grow in similar ways: for example, the growth of the trunk—the area immediately below the trilobite’s head made up of segments that increase with age—was controlled by a growth gradient, with those that were younger and closer to the back of the body undergoing faster growth. But while Elrathia kingii was smaller in early development and went through fewer molts before adulthood, it had faster growth rates, ultimately reaching sizes on par with Aulacopleura konincki, the largest of which are about 4 centimeters long.
In future studies, Hopkins is planning to add growth-rate data on different, more diverse-looking trilobite species to her models.
Reference:
Melanie J. Hopkins et al, Ontogeny of the trilobite Elrathia kingii (Meek) and comparison of growth rates between Elrathia kingii and Aulacopleura koninckii (Barrande), Papers in Palaeontology (2020). DOI: 10.1002/spp2.1331
Graduate student Mike Duvall is pictured here in southeastern Nepal during fieldwork in 2017. Image credit: John Waldron
A newly identified fault system in southeastern Nepal has the potential to cause earthquakes in a densely populated area, according to two University of Alberta scientists who were part of an international team that made the discovery.
“We discovered a series of faults at the foot of the Himalayan mountain range that have never been seen before,” explained U of A geologist John Waldron, who was a co-author of the study with graduate student Mike Duvall.
Waldron explained that the newly found faults show that the front of tectonic movement in the mountain belt is 40 kilometres farther south than scientists previously thought.
“Our research highlights the need to look below the surface, and farther afield, to fully understand earthquakes and structures within the Himalaya,” said Duvall, whose work on the study was supervised by Waldron.
“This network of faults shows that Himalayan deformation reaches farther than we previously thought and provides a glimpse into the geometry and formation of nascent mountain ranges.”
The research team used seismic profiles—images that look like slices through the top few kilometres of the Earth’s crust. These profiles were originally collected during petroleum exploration, by recording sound waves bounced off sedimentary layers buried beneath the Ganga flood plain of the Ganges River, which carries much of the sediment eroded from the Himalaya.
The data show that while southeastern Nepal is currently nearly flat, the thrusting produced by movement of the tectonic plates has already reached this area.
Waldron said that while there has not been an earthquake recorded in the area since accurate scientific records began about a century ago, his research results suggest there is potential for earthquakes to happen.
“Most of these faults only slip every thousand years or so,” he explained. “We discovered that a substantial part of this area has an almost horizontal fault underneath it, which has the potential to slip and cause a damaging earthquake.”
For more than 100 million years, the Indian subcontinent has been drifting northwards. In the last 40 or 50 million years, the subcontinent started to collide with Asia, giving rise to the Himalaya, the largest mountain range in the world. India is still sliding northwards into Asia at a rate of nearly two centimetres per year—about as fast as your fingernails grow, Waldron noted.
“Along the front of the mountains in Nepal are thrust faults, formed where the Indian subcontinent is being pushed underneath Asia,” he said. “The movement is jerky, which produces earthquakes. Because this is a densely populated part of the world, these earthquakes can be catastrophic.”
In 2015, a serious earthquake in Kathmandu, Nepal, with a magnitude of 7.8 on the Richter scale, destroyed hundreds of thousands of homes, killing nearly 9,000 people and injuring more than 20,000. Though the newly identified faults are not in the city of Kathmandu, the southeastern portion of Nepal is densely populated.
Collaborators on the research include Laurent Godin from Queen’s University and Yani Najman from Lancaster University.
The study, “Active Strike-Slip Faults and an Outer Frontal Thrust in the Himalayan Foreland Basin,” was published in Proceedings of the National Academy of Sciences.
Reference:
Michael J. Duvall et al. Active strike-slip faults and an outer frontal thrust in the Himalayan foreland basin, Proceedings of the National Academy of Sciences (2020). DOI: 10.1073/pnas.2001979117
Note: The above post is reprinted from materials provided by University of Alberta. The original article was written by Katie Willis.
A dinosaur-like reptile leaves muddy footprints along the shoreline of a lake during a rainstorm some 234 million years ago in northwestern Argentina. Credit: Jorge Gonzalez/NHMU
The Triassic Period, about 252 to 201 million years ago, was a time of volatile change, particularly during an interval known as the Carnian (about 237 to 227 million years ago). Three dramatic events occurred on Earth: the first dinosaurs appeared, gigantic volcanic eruptions called the Wrangellia large igneous province spewed out greenhouse gasses and the climate suddenly shifted to warmer, more humid conditions that scientists call the Carnian Pluvial Episode (CPE).
Recent work suggests that the Wrangellia eruptions caused the CPE, and that the resulting climate change may have spurred the early diversification of dinosaurs. But the lack of precise absolute dates for many Carnian sediments makes comparisons difficult. Additionally, few detailed paleoclimatic data exist for many regions outside of Europe, making it unclear whether the CPE was truly a global climate event or conclusively linking it to dinosaur diversification.
In a new study in the journal Gondwana Research, an international group led by Adriana Mancuso, a National Scientific and Technical Research Council (CONICET) researcher at the Instituto Argentino de Nivología, Glaciología y Ciencias Ambientales in Mendoza, Argentina, demonstrated that the CPE affected the southern hemisphere, specifically South America, which strengthens the case that it was a global climate event. The study was published online on June 15, 2020.
“There are ample Triassic, and specifically Carnian, rocks and fossils in South America, and Argentina in particular, but until now there were no paleoclimatic studies that could conclusively show that the Carnian Pluvial Episode occurred in the southern hemisphere,” Mancuso said.
The team, which included researchers at the University of Utah and the Berkeley Geochronology Center, studied Carnian rocks of the Los Rastros Formation, which are preserved in the Ischigualasto-Villa Unión Basin in northwest Argentina. For the first time, the team precisely dated volcanic ash preserved in lake sediments and pieced together the paleoclimate at this time.
“Our study focused on these rocks because they had the perfect combination of a good fossil record, dateable ash layers, and rich climate data preserved in lake sediments,” said Randall Irmis of the Natural History Museum of Utah and Department of Geology & Geophysics at the University of Utah.
In order to date the ash layer, the scientists isolated small needle-like crystals of zircon, minerals that act like time-capsules. When zircon crystallizes during an eruption, it traps the element uranium in its crystal structure, but never incorporates lead. Any lead preserved in the crystals today is a result of the radioactive decay of uranium. Because scientists know this decay rate, they can measure the ratio of uranium and lead in each zircon crystal and calculate how far back in time the crystals formed. In the present study, this measurement was done on a precise mass spectrometer at the Berkeley Geochronology Center.
Reference:
Adriana C. Mancuso et al, Evidence for the Carnian Pluvial Episode in Gondwana: New multiproxy climate records and their bearing on early dinosaur diversification, Gondwana Research (2020). DOI: 10.1016/j.gr.2020.05.009
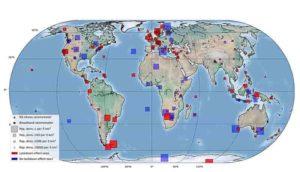
268 seismometers (red) in 117 countries detected a drop on seismic noise. “Global quieting of high-frequency seismic noise due to COVID-19 pandemic lockdown measures” by Thomas Lecocq et al., published Thursday 23 July 2020 in Science Credits:Photo of seismometer: Stephen Hicks/Imperial College London
The lack of human activity during lockdown caused human-linked vibrations in the Earth to drop by an average of 50% between March and May 2020.
This quiet period, likely caused by the total global effect of social distancing measures, closure of services and industry, and drops in tourism and travel, is the longest and most pronounced quiet period of seismic noise in recorded history.
The new research, led by the Royal Observatory of Belgium and five other institutions around the world including Imperial College London, showed that the dampening of ‘seismic noise’ caused by humans was more pronounced in more densely populated areas.
The relative quietness allowed researchers to listen in to previously concealed earthquake signals, and could help us differentiate between human and natural seismic noise more clearly than ever before.
Co-author Dr Stephen Hicks, from Imperial’s Department of Earth Science and Engineering, said: “This quiet period is likely the longest and largest dampening of human-caused seismic noise since we started monitoring the Earth in detail using vast monitoring networks of seismometers.
“Our study uniquely highlights just how much human activities impact the solid Earth, and could let us see more clearly than ever what differentiates human and natural noise.”
The paper is published today in Science.
Anthropause
Measured by instruments called seismometers, seismic noise is caused by vibrations within the Earth, which travel like waves. The waves can be triggered by earthquakes, volcanoes, and bombs — but also by daily human activity like travel and industry.
Although 2020 has not seen a reduction in earthquakes, the drop in human-caused seismic noise is unprecedented. The strongest drops were found in urban areas, but the study also found signatures of the lockdown on sensors buried hundreds of metres underground and in more remote areas.
Human-generated noise usually dampens during quiet periods like over the Christmas/New Year period and Chinese New Year, and during weekends and overnight. However, the drop in vibrations caused by COVID-19 lockdown measures eclipse even those seen during these periods.
Some researchers are dubbing this drop in anthropogenic (human-caused) noise and pollution the ‘anthropause’.
Dr Hicks said: “This is the first global study of the impact of the coronavirus anthropause on the solid Earth beneath our feet.”
To gather the data, researchers looked at seismic data from a global network of 268 seismic stations in 117 countries and found significant noise reductions compared to before any lockdown at 185 of those stations. Beginning in China in late January 2020, and followed by Europe and the rest of the world in March to April 2020, researchers tracked the ‘wave’ of quietening between March and May as worldwide lockdown measures took hold.
The largest drops in vibrations were seen in the most densely populated areas, like Singapore and New York City, but drops were also seen in remote areas like Germany’s Black Forest and Rundu in Namibia. Citizen-owned seismometers, which tend to measure more localised noise, noted large drops around universities and schools around Cornwall, UK and Boston, USA — a drop in noise 20 per cent larger than seen during school holidays. Countries like Barbados, where lockdown coincided with the tourist season, saw a 50 per cent decrease in noise. This coincided with flight data that suggested tourists returned home in the weeks before official lockdown.
Listening in
Over the past few decades, seismic noise has gradually increased as economies and populations have grown.
The drastic changes to daily life caused by the pandemic have provided a unique opportunity to study their environmental impacts, such as reductions in emissions and pollution in the atmosphere. The changes have also given us the opportunity to listen in to the Earth’s natural vibrations without the distortions of human input.
The study reports the first evidence that previously concealed earthquake signals, especially during daytime, appeared much clearer on seismometers in urban areas during lockdown.
The researchers say the lockdown quietening could also help them differentiate between human-caused noise and natural signals that might warn of upcoming natural disasters.
Lead author Dr Thomas Lecocq from the Royal Observatory of Belgium said: “With increasing urbanisation and growing global populations, more people will be living in geologically hazardous areas. It will therefore become more important than ever to differentiate between natural and human-caused noise so that we can ‘listen in’ and better monitor the ground movements beneath our feet. This study could help to kick-start this new field of study.”
The study’s authors hope that their work will spawn further research on the seismic lockdown, as well as finding previously hidden signals from earthquakes and volcanoes.
Dr Hicks said: “The lockdowns caused by the coronavirus pandemic may have given us a glimmer of insight into how human and natural noise interact within the Earth. We hope this insight will spawn new studies that help us listen better to the Earth and understand natural signals we would otherwise have missed.”
Reference:
Thomas Lecocq, Stephen P. Hicks, Koen Van Noten, Kasper van Wijk, Paula Koelemeijer, Raphael S. M. De Plaen, Frédérick Massin, Gregor Hillers, Robert E. Anthony, Maria-Theresia Apoloner, Mario Arroyo-Solórzano, Jelle D. Assink, Pinar Büyükakpınar, Andrea Cannata, Flavio Cannavo, Sebastian Carrasco, Corentin Caudron, Esteban J. Chaves, David G. Cornwell, David Craig, Olivier F. C. den Ouden, Jordi Diaz, Stefanie Donner, Christos P. Evangelidis, Läslo Evers, Benoit Fauville, Gonzalo A. Fernandez, Dimitrios Giannopoulos, Steven J. Gibbons, Társilo Girona, Bogdan Grecu, Marc Grunberg, György Hetényi, Anna Horleston, Adolfo Inza, Jessica C. E. Irving, Mohammadreza Jamalreyhani, Alan Kafka, Mathijs R. Koymans, Celeste R. Labedz, Eric Larose, Nathaniel J. Lindsey, Mika McKinnon, Tobias Megies, Meghan S. Miller, William Minarik, Louis Moresi, Víctor H. Márquez-Ramírez, Martin Möllhoff, Ian M. Nesbitt, Shankho Niyogi, Javier Ojeda, Adrien Oth, Simon Proud, Jay Pulli, Lise Retailleau, Annukka E. Rintamäki, Claudio Satriano, Martha K. Savage, Shahar Shani-Kadmiel, Reinoud Sleeman, Efthimios Sokos, Klaus Stammler, Alexander E. Stott, Shiba Subedi, Mathilde B. Sørensen, Taka’aki Taira, Mar Tapia, Fatih Turhan, Ben van der Pluijm, Mark Vanstone, Jerome Vergne, Tommi A. T. Vuorinen, Tristram Warren, Joachim Wassermann, Han Xiao. Global quieting of high-frequency seismic noise due to COVID-19 pandemic lockdown measures. Science, July 23, 2020; DOI: 10.1126/science.abd2438
Decomposition of dinosaurian remains inferred by invertebrate traces on vertebrate bone reveal new insights into Late Jurassic ecology, decay, and climate in western Colorado Credit: Brian Engh
Top predator dinosaurs like the Allosaurus and Ceratosaurus devouring dinosaur remains isn’t all that surprising, but the smaller creatures feasting on dinosaur remains may just give us a more complete picture of what life was like at Mygatt-Moore Quarry outside Fruita, Colorado 152 million years ago. A new study out in PeerJ on Wednesday, July 15th, 2020 authored by Museums of Western Colorado’s Paleontologist Dr. Julia McHugh, looks at the insect species who feasted on decaying dinosaurs back in the Jurassic period.
Researchers Dr. Julia McHugh (Museums of Western Colorado, Colorado Mesa University), Dr. Stephanie K. Drumheller (University of Tennessee), Anja Riedel (Colorado Mesa University), and Miriam Kane (Colorado Mesa University) examined more than 2,300 fossil bones over a two-year study and found over 400 traces left by insects and snails, a surprisingly high number. The marks researchers found on the fossils also came from at least six different invertebrates. These findings are a huge step to understanding the long-lost paleo diversity, and paleo climate of the Jurassic period.
It also gave researchers a better understanding of just how stinky the Jurassic period was too. The abundance of traces meant that the dinosaur carcasses must have been unburied for a long time—5 months to 6 years or more according to this new study. “Large carcasses take a long time to decompose. The smell from a dead mouse in your basement is bad enough, but then imagine that mouse was a 65-foot long animal! The stench of rotting meat would have been a magnet for carrion insects and other scavengers,” Dr. McHugh explains.
Reference:
Julia B. McHugh et al, Decomposition of dinosaurian remains inferred by invertebrate traces on vertebrate bone reveal new insights into Late Jurassic ecology, decay, and climate in western Colorado, PeerJ (2020). DOI: 10.7717/peerj.9510
Note: The above post is reprinted from materials provided by PeerJ.
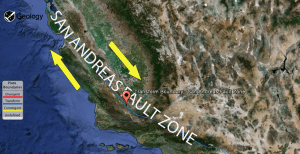
A new study suggests that last year’s Ridgecrest earthquakes increased the chance of a large earthquake on California’s San Andreas fault.
The study, published in the Bulletin of the Seismological Society of America on Monday, says there is now a 2.3% chance of an earthquake of magnitude 7.5 or greater in the next 12 months on a section of the 160-mile-long Garlock fault, which runs along the northern edge of the Mojave Desert.
That increased likelihood, in turn, would cause there to be a 1.15% chance of a large earthquake on the San Andreas fault in the next year.
Those odds may seem small. But they’re a substantial jump from what the chances were before last year’s Ridgecrest, California, earthquakes, whose epicenters were about 125 miles northeast of downtown L.A.
The new odds mean a large quake on the Garlock fault is now calculated to be 100 times more likely—rising from 0.023% in the next year to 2.3%.
And the chance of a large quake on the San Andreas has roughly tripled, from 0.35% in the next year to 1.15%, said Ross Stein, a co-author of the study and the CEO of Temblor, a catastrophe modeling company in the Bay Area that has built a free earthquake hazards app for smartphones.
The Ridgecrest quakes could trigger a large quake on the Garlock fault, and that could trigger a quake on the San Andreas.
Seismologist Lucy Jones, who did not play a role in the report released Monday, called the study “elegant science” but added that its conclusions are not confirmed.
“It’s really interesting science, and I like the way they’ve been able to increase the complexity of how they do their modeling. That’s a real advance. But it’s not yet proven,” Jones said.
That said, Jones said that government officials in California should be prepared for a scenario in which an earthquake occurs that immediately raises the risk of a large quake on the San Andreas fault.
“If the Garlock happens, yes, we will be saying the San Andreas is at increased risk,” Jones said. “What do you do when there’s an earthquake that could be a foreshock to the San Andreas? What do you say? What do you do?”
The study is the latest suggestion of a plausible scenario in which last summer’s earthquakes in a remote part of California might have started a chain of events that could result in a devastating earthquake on the San Andreas fault that has not been seen in Southern California in 163 years.
At its closest, the San Andreas fault comes within 35 miles of downtown Los Angeles.
“Now, you can think of the Ridgecrest earthquake as being so far from Greater Los Angeles … that it is nearly harmless,” said Stein, an earthquake scientist emeritus of the U.S. Geological Survey and adjunct professor of geophysics at Stanford University.
“But the problem is that … the Ridgecrest earthquake brought the Garlock fault closer to rupture. If that fault ruptures—and it gets within about 25 miles of the San Andreas—then there’s a high likelihood, maybe a 50/50 shot, that it would immediately rupture on the San Andreas,” Stein said. Stein’s co-author on the study is Shinji Toda, of Tohoku University in Japan.
If the Garlock fault did rupture close to the San Andreas fault—but the San Andreas did not immediately rupture—Los Angeles would face the prospect of having a metaphorical sword of Damocles hanging over its neck, Stein said, with the prospect of L.A. facing a larger risk of a San Andreas quake within a matter of months, or perhaps decades.
“In a way, if the fault ruptures all at once, life is simpler. It’s done,” Stein said. “But if it doesn’t—if it hangs, and plenty of faults do hang—that would put the city in a really difficult … position.”
A hypothetical magnitude 7.8 quake on the San Andreas could cause more than 1,800 deaths, injure 5,000, displace some 500,000 to 1 million people from their homes and hobble the region economically for a generation. A quake of that magnitude produces 45 times more energy than the 1994 magnitude 6.7 Northridge quake.
Out of the many faults in California, the San Andreas is singularly poised to be the one that unleashes a megaquake in our lifetime because it is the main tectonic plate boundary between the Pacific and North American plates, and because of how fast the fault accumulates seismic strain.
Another troubling scenario Jones has mentioned before was a hypothetical magnitude 6 earthquake at the Cajon Pass north of San Bernardino. It’s a particularly vexing scenario because such a quake could trigger large quakes on three major faults: the San Andreas, the San Jacinto and the Cucamonga.
The last time scientists in California warned about an increased risk of a big earthquake on the San Andreas fault, however, the initial statewide response was flatfooted.
In 2016, state officials didn’t issue a statement of the increased threat of a big quake on the San Andreas fault until about 39 hours after the first concerning quake hit in the Salton Sea.
Even when state officials finally put out a statement, they inserted an error that inaccurately downplayed the increased seismic risk. It was corrected after an inquiry from the Los Angeles Times.
A hypothetical magnitude 7 earthquake along the San Francisco Bay Area’s Hayward fault would cause severe, violent or extreme shaking along large swaths of the East Bay, North Bay and Silicon Valley, according to the U.S. Geological Survey. By contrast, the magnitude 6.9 Loma Prieta earthquake of 1989 caused only such shaking in the Santa Cruz Mountains, Watsonville and Gilroy.
The study published Monday is not the first time scientists have suggested the Ridgecrest earthquakes could be the first domino to fall that eventually leads Southern California’s section of the San Andreas fault to rupture in a significant way for the first time since 1857, when a magnitude 7.8 earthquake ruptured 225 miles of fault between Monterey County and the Cajon Pass in San Bernardino County.
A year ago, the U.S. Geological Survey—the nation’s primary earthquake science agency—calculated that there was an extremely remote chance the San Andreas could be triggered by the Ridgecrest quakes.
And a USC professor of earth sciences, James Dolan, articulated the same Ridgecrest-to-Garlock-to-San Andreas scenario in an interview with The Times last year.
The Garlock fault ruptures on average every 1,300 years, said Tim Dawson, senior engineering geologist with the California Geological Survey, but earthquakes can occur as often as every few hundred years or have a drought between large quakes of as long as 3,000 years. The last big earthquake on the Garlock fault happened about 500 years ago, Dawson said.
Big quakes on the southern San Andreas fault along the Grapevine section of Interstate 5 can happen on average every 100 years, although there’s wide variation in how often they can happen; there has been a time when it was just 20 years between major quakes, and another when there was a gap of 200 years between huge quakes.
Though it’s far from a sure bet the Garlock fault will rupture in our lifetime, the southern San Andreas is a likely candidate for such a big quake in our lifetime. “It’s really the fastest moving fault in California,” Dawson said of the San Andreas, meaning it accumulates strain far faster than other faults. “It’s always going to play the most significant role in earthquake hazard in California.”
Ken Hudnut, a U.S. Geological Survey geophysicist, drops, covers and holds on in Ridgecrest as a magnitude 7.1 earthquake ruptures through a nearby fault.
There’s a popular conception that earthquakes relieve seismic strain—they do—but they also increase seismic strain in other areas.
“An earthquake will relieve stress on the fault that it occurs on. But by relieving that, you’re transferring the stress onto something else,” Dawson said. “For every action, there’s a reaction.”
Scientists—and the public—have long been fascinated about the prospect of triggered earthquakes. It was a main plot point in the movie “San Andreas,” starring Dwayne Johnson in 2015.
It’s for a good reason.
Last year’s Fourth of July Ridgecrest quake, a magnitude 6.4 temblor, imparted greater stress on a fault that eventually ruptured a day later, causing the more powerful magnitude 7.1 quake on July 5.
The most powerful earthquake in California of the last 68 years, the magnitude 7.3 Landers earthquake that hit the sparsely populated Mojave Desert on June 28, 1992—and a magnitude 6.3 aftershock hours later near Big Bear—was believed to be related to the Joshua Tree earthquake, a magnitude 6.1 event, that occurred two months earlier.
The trio of quakes raised concerns that the San Andreas was next.
The theory at the time was that the Joshua Tree-Landers-Big Bear sequence of quakes essentially unclamped a section of the San Andreas fault. That made it plausible the San Andreas fault might be next to rupture, said Ken Hudnut, geophysicist with the USGS.
But the southern San Andreas fault has remained as quiet as it has since the 1850s.
Instead, the next big quakes in Southern California occurred where few scientists were expecting them to hit—the magnitude 6.7 earthquake that struck Northridge in 1994, and the magnitude 7.1 Hector Mine earthquake in 1999 that was located even deeper in the remote Mojave Desert.
“What has been actually happening in the real world is quite different than what we thought was a plausible scenario back at the time in ’92,” Hudnut said.
Note: The above post is reprinted from materials provided by Los Angeles Times Distributed by Tribune Content Agency, LLC.
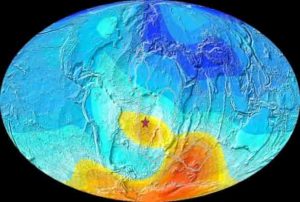
Map of the Earth showing the present-day deviation from expected magnetic field direction. The star is Saint Helena
Research by the University of Liverpool has revealed that strange behaviour of the magnetic field in the South Atlantic region existed as far back as eight to 11 million years ago, suggesting that today’s South Atlantic Anomaly is a recurring feature and unlikely to represent an impending reversal of the Earth’s magnetic field.
The South Atlantic Anomaly is an area characterized by a significant reduction in the strength of Earth’s magnetic field compared with areas at similar geographic latitudes. Here, protection from harmful radiation from space is reduced. The most significant signs of this are technical malfunctions aboard satellites and spacecraft.
In a study published in the Proceedings of the National Academy of Sciences, Liverpool paleomagnetic researchers analysed the record of Earth’s magnetic field which is preserved in igneous rocks from the island Saint Helena which lies in the midst of the South Atlantic Anomaly.
The geomagnetic records from the rocks covering 34 different volcanic eruptions that took place between eight and 11 million years ago revealed that at these occurrences the direction of the magnetic field for St Helena often pointed far from the North pole, just like it does today.
The Earth’s magnetic field, or the geomagnetic field, not only gives us the ability of navigating with a compass, but also protects our atmosphere from charged particles coming from the sun, called solar wind. However, it is not completely stable in strength and direction, both over time and space, and it has the ability to completely flip or reverse itself with substantial implications.
The South Atlantic Anomaly is a topic of debate between scientists in this field. Besides the fact that it causes damages to space technology, it also raises the question of where it comes from and whether it represents the start of the total weakening of the field and a possible upcoming pole reversal.
Lead author of the paper, University of Liverpool PhD student Yael Engbers, said: “Our study provides the first long term analysis of the magnetic field in this region dating back millions of years. It reveals that the anomaly in the magnetic field in the South Atlantic is not a one-off, similar anomalies existed eight to 11 million years ago.
“This is the first time that the irregular behaviour of the geomagnetic field in the South Atlantic region has been shown on such a long timescale. It suggests that the South Atlantic Anomaly is a recurring feature and probably not a sign of an impending reversal.
“It also supports earlier studies that hint towards a link between the South Atlantic Anomaly and anomalous seismic features in the lowermost mantle and the outer core. This brings us closer to linking behaviour of the geomagnetic field directly to features of the Earth’s interior”
Reference:
Yael A. Engbers, Andrew J. Biggin, Richard K. Bono. Elevated paleomagnetic dispersion at Saint Helena suggests long-lived anomalous behavior in the South Atlantic. Proceedings of the National Academy of Sciences, 2020; 202001217 DOI: 10.1073/pnas.2001217117
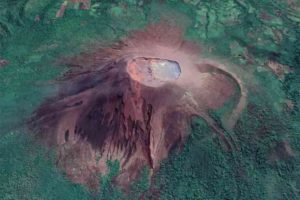
A team of Penn State researchers studied Telica Volcano, a persistently active volcano in western Nicaragua, to both observe and quantify small-scale intra-crater change associated with background and eruptive activity. IMAGE: Google Earth
The shape of volcanoes and their craters provide critical information on their formation and eruptive history. Techniques applied to photographs — photogrammetry — show promise and utility in correlating shape change to volcanic background and eruption activity.
Changes in volcano shape — morphology — that occur with major eruptions are quantifiable, but background volcanic activity, manifesting as small volume explosions and crater wall collapse, can also cause changes in morphology and are not well quantified.
A team of Penn State researchers studied Telica Volcano, a persistently active volcano in western Nicaragua, to both observe and quantify small-scale intra-crater change associated with background and eruptive activity. Geologists consider Telica ‘persistently’ active because of its high levels of seismicity and volcanic degassing, and it erupts on less than 10-year time periods.
The team used direct observations of the crater, photographic observations from 1994 to 2017 and photogrammetric techniques on photos collected between 2011 and 2017 to analyze changes at Telica in the context of summit crater formation and eruptive processes. They used structure-from-motion (SfM), a photogrammetric technique, to construct 3D models from 2D images. They also used point cloud differencing, a method used to measure change between photo sampling periods, to compare the 3D models, providing a quantitative measure of change in crater morphology. They reported their results in Geochemistry, Geophysics, Geosystems.
“Photos of the crater were taken as part of a multi-disciplinary study to investigate Telica’s persistent activity,” said Cassie Hanagan, lead author on the study. “Images were collected from our collaborators to make observations of the crater’s features such as the location and number of fumaroles or regions of volcanic degassing in the crater. For time periods that had enough photos, SfM was used to create 3D models of the crater. We could then compare the 3D models between time periods to quantify change.”
Using the SfM-derived 3D models and point cloud differencing allowed the team to quantify how the crater changed through time.
“We could see the changes by visually looking at the photos, but by employing SfM, we could quantify how much change had occurred at Telica,” said Peter La Femina, associate professor of geosciences in Penn State’s Department of Geosciences. “This is one of the first studies to look at changes in crater morphology associated with background and eruptive activity over a relatively long time span, almost a 10-year time period.”
Telica’s morphological changes were then compared to the timing of eruptive activity to investigate the processes leading to crater formation and eruption.
Volcanoes erupt when pressure builds beyond a breaking point. At Telica, two mechanisms for triggering eruptions have been hypothesized. These are widespread mineralization within the underground hydrothermal system that seals the system and surficial blocking of the vent by landslides and rock fall from the crater walls. Both mechanisms could lead to increases in pressure and then eruption, according to the researchers.
“One question was whether or not covering the vents on the crater floor could cause pressure build up, and if that would cause an explosive release of this pressure if the vent were sufficiently sealed,” said Hanagan.
Comparing the point cloud differencing results and the photographic observations indicated that vent infill by mass wasting from the crater walls was not likely a primary mechanism for sealing of the volcanic system prior to eruption.
“We found that material from the crater walls does fall on the crater floor, filling the eruptive vent,” said La Femina. “But at the same time, we still see active fumaroles, which are vents in the crater walls where high temperature gases and steam are emitted. The fumaroles remained active even though the talus from the crater walls covered the vents. This suggests that at least the deeper magma-hydrothermal system is not directly sealed by landslides.”
The researchers further note that crater wall material collapse is spatially correlated to where degassing is concentrated, and that small eruptions blow out this fallen material from the crater floor. They suggest these changes sustain a crater shape similar to other summit craters that formed by collapse into an evacuated magma chamber.
“What we found is that during the explosions, Telica is throwing out a lot of the material that came from the crater walls,” said La Femina. “In the absence of magmatic eruptions, the crater is forming through this background process of crater wall collapse, and the regions of fumarole activity collapse preferentially.”
Reference:
Catherine Hanagan, Peter C. La Femina, Mel Rodgers. Changes in Crater Morphology Associated With Volcanic Activity at Telica Volcano, Nicaragua. Geochemistry, Geophysics, Geosystems, 2020; 21 (7) DOI: 10.1029/2019GC008889
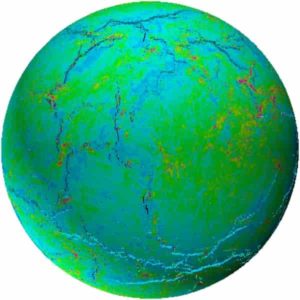
Figure 1. A snapshot of a model from the new work, showing the late stages of growth and coalescence of a new global fracture network. Fractures are in black / shadow, and colors show stresses (pink color denotes tensile stress, blue color denotes compressive stress).
The activity of the solid Earth — for example, volcanoes in Java, earthquakes in Japan, etc — is well understood within the context of the ~50-year-old theory of plate tectonics. This theory posits that Earth’s outer shell (Earth’s “lithosphere”) is subdivided into plates that move relative to each other, concentrating most activity along the boundaries between plates. It may be surprising, then, that the scientific community has no firm concept on how plate tectonics got started. This month, a new answer has been put forward by Dr. Alexander Webb of the Division of Earth and Planetary Science & Laboratory for Space Research at the University of Hong Kong, in collaboration with an international team in a paper published in Nature Communications. Webb serves as corresponding author on the new work.
Dr. Webb and his team proposed that early Earth’s shell heated up, which caused expansion that generated cracks. These cracks grew and coalesced into a global network, subdividing early Earth’s shell into plates. They illustrated this idea via a series of numerical simulations, using a fracture mechanics code developed by the paper’s first author, Professor Chunan Tang of the Dalian University of Technology. Each simulation tracks the stress and deformation experienced by a thermally-expanding shell. The shells can generally withstand about 1 km of thermal expansion (Earth’s radius is ~6371 km), but additional expansion leads to fracture initiation and the rapid establishment of the global fracture network.
Although this new model is simple enough — Earth’s early shell warmed up, expanded, and cracked — superficially this model resembles long-discredited ideas and contrasts with basic physical precepts of Earth science. Before the plate tectonic revolution of the 1960’s, Earth’s activities and the distribution of oceans and continents were explained by a variety of hypotheses, including the so-called expanding Earth hypothesis. Luminaries such as Charles Darwin posited that major earthquakes, mountain-building, and the distribution of land-masses were thought to result from the expansion of the Earth. However, because Earth’s major internal heat source is radioactivity, and the continuous decay of radioactive elements means that there is less available heat as time moves forward, thermal expansion might be considered far less likely than its opposite: thermal contraction. Why, then, do Dr. Webb and his colleagues think that early Earth’s lithosphere experienced thermal expansion?
“The answer lies in consideration of major heat-loss mechanisms that could have occurred during Earth’s early periods,” said Dr. Webb. “If volcanic advection, carrying hot material from depth to the surface, was the major mode of early heat-loss, that changes everything.” Dominance of volcanism would have an unexpectedly chilling effect on the Earth’s outer shell, as documented in Dr. Webb and co-author Dr. William Moore’s earlier work (published in Nature in 2013). This is because new hot volcanic material taken from Earth’s depths would have been deposited as cold material at the surface — the heat would be lost to space. The evacuation at depth and piling up at the surface would have eventually required that the surface material sank, bringing cold material downwards. This continual downward motion of cold surface material would have had a chilling effect on the early lithosphere. Because Earth was cooling overall, the heat production and corresponding volcanism would have slowed down. Correspondingly, the downwards motion of lithosphere would have slowed with time, and thus even as the overall planet cooled, the chilled lithosphere would have been increasingly warmed via conduction from hot deep material below. This warming would have been the source of the thermal expansion invoked in the new model. The new modeling illustrates that if Earth’s solid lithosphere is sufficiently thermally expanded, it would fracture, and the rapid growth of a fracture network would divide the Earth’s lithosphere into plates.
Dr. Webb and his colleagues continue to explore the early development of our planet, and of the other planets and moons in the solar system, via integrated field-based, analytical, and theoretical studies. Their field-based explorations bring them to far-flung sites in Australia, Greenland, and South Africa; their analytical research probes the chemistry of ancient rocks and their mineral components; and their theoretical studies simulate various proposed geodynamic processes. Together, these studies chip away at one of Earth and planetary science’s greatest remaining mysteries: how and why did Earth go from a molten ball to our plate tectonic planet?
Reference:
C. A. Tang, A. A. G. Webb, W. B. Moore, Y. Y. Wang, T. H. Ma, T. T. Chen. Breaking Earth’s shell into a global plate network. Nature Communications, 2020; 11 (1) DOI: 10.1038/s41467-020-17480-2
Arizona Rock Offers Clues to the Chaotic Earth of 200 Million Years Ago
A rock core from Petrified Forest National Park, Arizona, has given scientists a powerful new tool to understand how catastrophic events shaped Earth’s ecosystems before the rise of the dinosaurs.
The quarter-mile core is from an important part of the Triassic Period when life on Earth endured a series of cataclysmic events: Our planet was struck at least three times by mountain-sized asteroids, chains of volcanoes erupted to choke the sky with greenhouse gases, and tectonic movement tore apart Earth’s single supercontinent, Pangea.
Among the chaos, many plants and animals, including some of the long-snouted and armored reptiles that ruled Pangea throughout the Triassic, vanished in a possible shake-up of life on Earth that scientists have yet to explain.
The study, published July 20 in GSA Bulletin, offers scientists a foundation to explain the changes in the fossil record and determine how these events may have shaped life on Earth.
By determining the age of the rock core, researchers were able to piece together a continuous, unbroken stretch of Earth’s history from 225 million to 209 million years ago. The timeline offers insight into what has been a geologic dark age and will help scientists investigate abrupt environmental changes from the peak of the Late Triassic and how they affected the plants and animals of the time.
“The core lets us wind the clock back 225 million years when Petrified Forest National Park was a tropical hothouse populated by crocodile-like reptiles and turkey-size early dinosaurs,” said Cornelia Rasmussen, a postdoctoral researcher at the University of Texas Institute for Geophysics (UTIG), who led the analysis that determined the age of the core.
“We can now begin to interpret changes in the fossil record, such as whether changes in the plant and animal world at the time were caused by an asteroid impact or rather by slow geographic changes of the supercontinent drifting apart,” she said.
Petrified Forest National Park’s paleontologist Adam Marsh said that despite a rich collection of fossils from the period in North America, until now there was little information on the Late Triassic’s timeline because most of what scientists knew came from studying outcrops of exposed rock pushed to the surface by tectonic movements.
“Outcrops are like broken pieces of a puzzle,” said Marsh, who earned his Ph.D. from The University of Texas at Austin’s Jackson School of Geosciences. “It is incredibly difficult to piece together a continuous timeline from their exposed and weathered faces.”
Marsh was not an author of the study but is part of the larger scientific coring project. UTIG is a unit of the Jackson School.
The Petrified Forest National Park core overcomes the broken puzzle problem by recovering every layer in the order it was deposited. Like tree rings, scientists can then match those layers with the fossil and climate record.
To find the age of each layer, the researchers searched the rock core for tiny crystals of the mineral zircon, which are spewed into the sky during volcanic eruptions. Zircons are a date stamp for the sediments with which they are buried. Researchers then compared the age of the crystals with traces of ancient magnetism stored in the rocks to help develop a precise geologic timeline.
Geoscience is rarely so simple, however, and according to Rasmussen, the analysis of the core gave them two slightly different stories. One shows evidence that a shake-up in the species might not be connected to any single catastrophic event and could simply be part of the ordinary course of gradual evolution. The other shows a possible correlation between the change in the fossil record and a powerful asteroid impact, which left behind a crater in Canada over 62 miles wide.
For Marsh, the different findings are just part of the process to reach the truth.
“The two age models are not problematic and will help guide future studies,” he said.
The research is the latest outcome of the Colorado Plateau Coring Project. The research and the coring project were funded by the National Science Foundation and International Continental Drilling Program.
Reference:
Cornelia Rasmussen, Roland Mundil, Randall B. Irmis, Dominique Geisler, George E. Gehrels, Paul E. Olsen, Dennis V. Kent, Christopher Lepre, Sean T. Kinney, John W. Geissman, William G. Parker. U-Pb zircon geochronology and depositional age models for the Upper Triassic Chinle Formation (Petrified Forest National Park, Arizona, USA): Implications for Late Triassic paleoecological and paleoenvironmental change. GSA Bulletin, 2020; DOI: 10.1130/B35485.1
A Trapiche emerald from Muzo Mine, Colombia. Credit: Luciana Barbosa/Wikipedia
Trapiche Emerald
Trapiche emerald is a rare variety of gemstone emeralds, distinguished by a six-point radial pattern of ray-like spokes of dark impurity. It is one of several types of trapiche or trapiche-like minerals, including trapiche ruby, sapphire, granate, chiastolite and tourmaline. The name comes from the Spanish word trapiche, a sugar mill, due to the resemblance of the pattern with the spokes of the grinding wheel.
Trapiche emeralds were first described by Émile Bertrand in 1879. They are generally only (and rarely) found in the western part of the Eastern Cordillera basin, in the Muzo, Coscuez and Peñas Blancas mines of Colombia (but likely not in Chivor as reported in older literature). Singular finds in Brazil and Madagascar have also been reported.
Trapiche emeralds are found in the black shale host rocks of just a few Colombian mines in the western belt of the Eastern Cordillera Basin. It has a central core, six arms and black schalled dendrites, a crystal-like tree structure, branching around the core between the arms. These are visible when the crystals are positioned perpendicular to the c-axis and are often cut like cabochons to accentuate the six partitions.
The radial pattern has a considerable variance, and often includes a hexagonal structure at the core. There is still no consensus on the mechanism by which the pattern is formed or the conditions required for it. Several models have been suggested. According to one view, the black impurities are the remains of the slate matrix in which the emeralds grew, stuck between the radial dendrites of the growing emerald. The trapiche pattern is not an asterisk, an optically similar pattern that forms in a different phase.
How Does a Trapiche Emerald Form?
During the formation of an emerald crystal, black carbon impurities may enter the gemstone mix. Because of emerald’s hexagonal crystal structure, these impurities may fill in at the crystal junctions, forming a six-point radial pattern. In some trapiche emeralds, inclusions of albite, quartz, carbonaceous materials, or lutite may outline the hexagonal emerald core. From there, they extend in spokes that divide the surrounding emerald material into six trapezoidal sectors.
The main, tapered emerald core first grows under hydrothermal conditions, but if these conditions slow down or even stop for some time, impurities may enter the mixture. As growth conditions resume, both the emerald and, for example, the albite will form. Although the hexagonal prism faces of the core crystal can maintain their uniform growth, producing pure emeralds, the albite fills the areas growing from the edges between the prism faces. This results in six sectors of clear emerald and six of a combination, predominantly albite and some emerald. Therefore, the central core and the six surrounding trapezoidal sectors of the trapezoid emerald form a single, untwinned crystal.
Although the hexagonal core may often be colorless, transparent beryl, it can also be green. In a 1970 analysis of Muzo, Colombia’s trapiche emeralds in American Mineralogist, K. Nassau and K. A. Jackson found their principal coloring agent was vanadium.
Other species of Trapiche Gems
Trapiche emeralds were first sent to GIA for study in the mid-1960’s. After then, a six-armed trapiche texture or pattern has been found in a few other gemstones, most notably sapphire and ruby.
In 1995 GIA first documented trapiche rubies from Mong Hsu, Myanmar and have since been found in Guinea, Kashmir, Pakistan , Nepal, Sierra Leone and Tajikistan. Trapiche sapphires first appeared on the gem market in early 1996, when samples were sold by a Berlin gem dealer in Basel. Trapiche sapphires have been found primarily in Australia, Cambodia, China, France, Kenya, Madagascar, Nepal , Sri Lanka and Tanzania.
All trapiche gemstones are relatively rare and some even more so. Some examples of the more rare or unusual trapiche gemstones include:
Pezzottaite (named after mineralogist Dr. Federico Pezzotta) first appeared at the 2003 gem shows in Tucson. Since then it has become a rare, coveted gemstone by collectors worldwide. It is a member of the beryl group, along with emerald and red beryl. All three are prized when in trapiche formation.
Tourmaline is relatively abundant in Zambia, although only a small percentage of crystals exhibit the trapiche pattern.
Trapiche muscovite comes from only one locality, the Japanese city of Kameoka in Kyoto Prefecture, where they are locally known as “cherry blossom stones” (sakura-ishi in Japanese.)
The Pink Star diamond, which fetched the highest price ever for a jewel offered at auction, is displayed at Sotheby’s in Hong Kong on March 29. Credit: Vincent Yu/AP
Pink Star Diamond
The Pink Star is the largest internally flawless, fancy vivid pink diamond ever graded by the Gemological Institute of America. It’s more than twice the size of the 24.78-carat Graff Pink, which set the previous record price for a pink diamond when it sold for $46.2 million in 2010.
Described as one of “the earth’s greatest natural treasures”, “Pink Star” is the largest internally flawless pink diamond that the Gemological Institute of America (GIA) has ever graded.
The 59.6-carat “Pink Star” diamond is now officially the most valuable gem or jewel sold at auction, fetching a world record price of $71.2 million, moments ago in Hong Kong. It shattered the previous record of $57.5 million held by the Oppenheimer Blue, which sold a year ago at Christie’s Geneva auction.
The Pink Star is graded as Type IIa, which is rare for any pink diamond, much less one of this size and color. It originated from a 132.5-carat rough mined by De Beers in 1999 and was cut and polished over a period of two years. The Pink Star is more than twice the size of the Graff Pink, which at 24.78 carats was previously the largest pink diamond ever sold at auction, fetching $46.2 million, at Sotheby’s Geneva in 2010.
What are Pink diamonds?
Pink diamonds are extremely rare. Only 0.0001% of the diamonds in existence are pink. It is a gemstone that would give beauty and harmony to the world. Just like white diamonds, pink diamonds can range from flawless to (heavily) included. The Pink Star is the only pink diamond in the world that is completely flawless.
History of the Pink Star Diamond
The Pink Star, previously known as the Steinmetz Pink, is a diamond weighing 59.60 carat (11.92 g), classified by the Gemological Institute of America as Fancy Vivid Pink in colour. De Beers mined the Pink Star in South Africa in 1999, and weighed 132,5 carat in the rough. The Pink Star is the largest diamond known to have been rated Vivid Pink. The Beny Steinmetz Group called Steinmetz Diamonds took a cautious 20 months to cut the Pink as a result of this exceptional rarity. This was unveiled in a public ceremony in Monaco on 29 May 2003.
The Pink Star was displayed (as the Steinmetz Pink) as part of the Smithsonian’s “The Splendor of Diamonds” exhibit, alongside the De Beers Millennium Star, the world’s second largest (the Cullinan I The Star of Africa is the largest) top colour (D) internally and externally flawless pear-shaped diamond at 203.04 carat (40.608 g), the Heart of Eternity Diamond, a 27.64 carat (5.582 g) heart-cut blue diamond and the Moussaieff Red Diamond, the world’s largest known Fancy Red diamond at 5.11 carat (1.022 g).
A name-changing pink diamond
Steinmetz polished the diamond into a “Mixed Oval Brilliant.” The combination of a brilliant and an oval is not that unusual. But instead of regular facets, a step cut crown and a brilliant cut pavilion were polished. You can recognize the step cut facets of the emerald cut diamonds and the Asscher cut diamonds. The combination of the cut and the facets makes it look like there’s a star shape inside the stone.
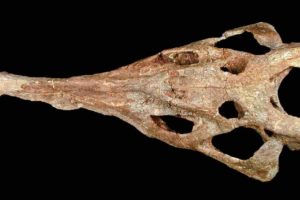
Dinosaurs and flying pterosaurs may be known for their remarkable size, but a newly described species from Madagascar that lived around 237 million years ago suggests that they originated from extremely small ancestors. The fossil reptile, named Kongonaphon kely, or “tiny bug slayer,” would have stood just 10 centimeters (or about 4 inches) tall. The description and analysis of this fossil and its relatives, published today in the journal Proceedings of the National Academy of Sciences, may help explain the origins of flight in pterosaurs, the presence of “fuzz” on the skin of both pterosaurs and dinosaurs, and other questions about these charismatic animals.
“There’s a general perception of dinosaurs as being giants,” said Christian Kammerer, a research curator in paleontology at the North Carolina Museum of Natural Sciences and a former Gerstner Scholar at the American Museum of Natural History. “But this new animal is very close to the divergence of dinosaurs and pterosaurs, and it’s shockingly small.”
Dinosaurs and pterosaurs both belong to the group Ornithodira. Their origins, however, are poorly known, as few specimens from near the root of this lineage have been found. The fossils of Kongonaphon were discovered in 1998 in Madagascar by a team of researchers led by American Museum of Natural History Frick Curator of Fossil Mammals John Flynn (who worked at The Field Museum at the time) in close collaboration with scientists and students at the University of Antananarivo, and project co-leader Andre Wyss, chair and professor of the University of California-Santa Barbara’s Department of Earth Science and an American Museum of Natural History research associate.
“This fossil site in southwestern Madagascar from a poorly known time interval globally has produced some amazing fossils, and this tiny specimen was jumbled in among the hundreds we’ve collected from the site over the years,” Flynn said. “It took some time before we could focus on these bones, but once we did, it was clear we had something unique and worth a closer look. This is a great case for why field discoveries — combined with modern technology to analyze the fossils recovered — is still so important.”
“Discovery of this tiny relative of dinosaurs and pterosaurs emphasizes the importance of Madagascar’s fossil record for improving knowledge of vertebrate history during times that are poorly known in other places,” said project co-leader Lovasoa Ranivoharimanana, professor and director of the vertebrate paleontology laboratory at the University of Antananarivo in Madagascar. “Over two decades, our collaborative Madagascar-U.S. teams have trained many Malagasy students in paleontological sciences, and discoveries like this helps people in Madagascar and around the world better appreciate the exceptional record of ancient life preserved in the rocks of our country.”
Kongonaphon isn’t the first small animal known near the root of the ornithodiran family tree, but previously, such specimens were considered “isolated exceptions to the rule,” Kammerer noted. In general, the scientific thought was that body size remained similar among the first archosaurs — the larger reptile group that includes birds, crocodilians, non-avian dinosaurs, and pterosaurs — and the earliest ornithodirans, before increasing to gigantic proportions in the dinosaur lineage.
“Recent discoveries like Kongonaphon have given us a much better understanding of the early evolution of ornithodirans. Analyzing changes in body size throughout archosaur evolution, we found compelling evidence that it decreased sharply early in the history of the dinosaur-pterosaur lineage,” Kammerer said.
This “miniaturization” event indicates that the dinosaur and pterosaur lineages originated from extremely small ancestors yielding important implications for their paleobiology. For instance, wear on the teeth of Kongonaphon suggests it ate insects. A shift to insectivory, which is associated with small body size, may have helped early ornithodirans survive by occupying a niche different from their mostly meat-eating contemporaneous relatives.
The work also suggests that fuzzy skin coverings ranging from simple filaments to feathers, known on both the dinosaur and pterosaur sides of the ornithodiran tree, may have originated for thermoregulation in this small-bodied common ancestor. That’s because heat retention in small bodies is difficult, and the mid-late Triassic was a time of climatic extremes, inferred to have sharp shifts in temperature between hot days and cold nights.
Sterling Nesbitt, an assistant professor at Virginia Tech and a Museum research associate and expert in ornithodiran anatomy, phylogeny, and histological age analyses, is also an author on this study.
This study was supported, in part, by the National Geographic Society, a Gerstner Scholars Fellowship from the Gerstner Family Foundation and the Richard Gilder Graduate School, the Division of Paleontology at the American Museum of Natural History, and a Meeker Family Fellowship from the Field Museum, with additional support from the Ministry of Energy and Mines of Madagascar, the World Wide Fund for Nature (Madagascar), University of Antananarivo, and MICET/ICTE (Madagascar).
Reference:
Christian F. Kammerer, Sterling J. Nesbitt, John J. Flynn, Lovasoa Ranivoharimanana, André R. Wyss. A tiny ornithodiran archosaur from the Triassic of Madagascar and the role of miniaturization in dinosaur and pterosaur ancestry. Proceedings of the National Academy of Sciences, 2020; 201916631 DOI: 10.1073/pnas.1916631117
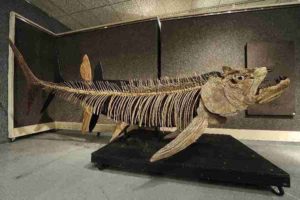
The fossilized remains of this Xiphactinus – similar to the one found in Argentina – was discovered in the US state of Kansas and sold at auction in 2010
A giant 70 million year old fossil of a fish that lived amongst dinosaurs has been discovered in Argentine Patagonia, a team of researchers said on Monday.
Argentine paleontologists “found the remains of a predator fish that was more than six meters long,” the researchers said in a statement.
The discovery was published in the scientific journal Alcheringa: An Australasian Journal of Palaeontology.
The fish “swam in the Patagonian seas at the end of the Cretaceous Period, when the temperature there was much more temperate than now,” the statement said.
“The fossils of this carnivorous animal with sharp teeth and scary appearance were found close to the Colhue Huapial lake” around 1,400 kilometers south of the capital Buenos Aires.
This fossil belonged to the Xiphactinus genus, “amongst the largest predatory fish that existed in the history of Earth.”
“Its body was notably slim and ended in a huge head with big jaws and teeth as sharp as needles, several centimeters long.”
Examples of this species have been found in other parts of the world, “some of which even have preserved stomach contents,” said Julieta de Pasqua, one of the study authors.
Previously, the Xiphactinus had only been found in the northern hemisphere, although one example was recently found in Venezuela.
Patagonia is one of the most important reservoirs of fossils of dinosaurs and prehistoric species.
Note: The above post is reprinted from materials provided by AFP.
An artist’s interpretation of Dilophosaurus based on the latest research. Credit: Brian Engh / The Saint George Dinosaur Discovery Site.
From movies to museum exhibits, the dinosaur Dilophosaurus is no stranger to pop culture. Many probably remember it best from the movie “Jurassic Park,” where it’s depicted as a venom-spitting beast with a rattling frill around its neck and two paddle-like crests on its head.
The dinosaur in the movie is mostly imagination, but a new comprehensive analysis of Dilophosaurus fossils is helping to set the record straight. Far from the small lizard-like dinosaur in the movies, the actual Dilophosaurus was the largest land animal of its time, reaching up to 20 feet in length, and it had much in common with modern birds.
The analysis was published open access in the Journal of Paleontology on July 7.
Dilophosaurus lived 183 million years ago during the Early Jurassic. Despite big-screen fame, scientists knew surprisingly little about how the dinosaur looked or fit into the family tree, until now.
“It’s pretty much the best, worst-known dinosaur,” said lead author Adam Marsh. “Until this study, nobody knew what Dilophosaurus looked like or how it evolved.”
Seeking answers to these questions, Marsh conducted an analysis of the five most-complete Dilophosaurus specimens while earning his Ph.D. from The University of Texas at Austin’s Jackson School of Geosciences. He is now the lead paleontologist at Petrified Forest National Park.
The analysis is co-authored by Jackson School Professor Timothy Rowe, who discovered two of the five Dilophosaurus specimens that were studied.
The study adds clarity to a muddled research record that reaches back to the first Dilophosaurus fossil to be discovered, the specimen that set the standard for all following Dilophosaurus discoveries. That fossil was rebuilt with plaster, but the 1954 paper describing the find isn’t clear about what was reconstructed — a fact that makes it difficult to determine how much of the early work was based on the actual fossil record, Marsh said.
Early descriptions characterize the dinosaur as having a fragile crest and weak jaws, a description that influenced the depiction of Dilophosaurus in the “Jurassic Park” book and movie as a svelte dinosaur that subdued its prey with venom.
But Marsh found the opposite. The jawbones show signs of serving as scaffolding for powerful muscles. He also found that some bones were mottled with air pockets, which would have helped reinforce the skeleton, including its dual crest.
“They’re kind of like bubble wrap — the bone is protected and strengthened,” Marsh said.
These air sacs are not unique to Dilophosaurus. Modern birds and the world’s most massive dinosaurs also have bones filled with air. In both cases, the air sacs lighten the load, which helped big dinosaurs manage their bulky bodies and birds take to the skies.
Many birds use the air sacs to perform other functions, from inflating stretchy areas of skin during mating rituals, to creating booming calls and dispersing heat. The intricate array of air pockets and ducts that extend from Dilophosaurus’ sinus cavity into its crests means that the dinosaur may have been able to perform similar feats with its headgear.
All the specimens Marsh examined came from the Kayenta Formation in Arizona and belong to the Navajo Nation. The University of California Museum of Paleontology holds in trust three of the specimens. The Jackson School Museum of Earth History holds the two discovered by Rowe.
“One of the most important responsibilities of our museum is curation,” said Matthew Brown, director of the Vertebrate Paleontology Collections. “We are very excited to help share these iconic Navajo Nation fossils with the world through research and educational outreach, as well as preserve them for future generations.”
To learn more about how the fossils compared with one another, Marsh recorded hundreds of anatomical characteristics of each fossil. He then used an algorithm to see how the specimens compared with the first fossil — which confirmed that they were indeed all Dilophosaurus.
The algorithm also revealed that there’s a significant evolutionary gap between Dilophosaurus and its closest dinosaur relatives, which indicates there are probably many other relatives yet to be discovered.
The revised Dilophosaurus record will help paleontologists better identify specimens going forward. Marsh said that the research is already being put into action. In the midst of his analysis, he discovered that a small braincase in the Jackson School’s collections belonged to a Dilophosaurus.
“We realized that it wasn’t a new type of dinosaur, but a juvenile Dilophosaurus, which is really cool,” Marsh said.
Reference:
Adam D. Marsh, Timothy B. Rowe. A comprehensive anatomical and phylogenetic evaluation of Dilophosaurus wetherilli (Dinosauria, Theropoda) with descriptions of new specimens from the Kayenta Formation of northern Arizona. Journal of Paleontology, 2020; 94 (S78): 1 DOI: 10.1017/jpa.2020.14
Curtin University-led research has found new evidence to suggest that the Earth’s first continents were not formed by subduction in a modern-like plate tectonics environment as previously thought, and instead may have been created by an entirely different process.
Published in the journal Geology, the research team measured the iron and zinc isotopes in rock sourced from central Siberia and South Africa and determined that the composition of these rocks may have formed in a non-subduction environment.
Lead author Dr Luc-Serge Doucet, from the Earth Dynamics Research Group in Curtin’s School of Earth and Planetary Sciences, said the first continents were formed early in Earth’s history more than three billion years ago, but how they were formed is still open to debate.
“Previous research has suggested that the first supercontinents formed through subduction and plate tectonics, which is when the Earth’s plates move under one another shaping the mountains and oceans,” Dr Doucet said.
“Our research found that that the chemical makeup of the rock fragments was not consistent with what we would usually see when subduction occurs. If the continents were formed through subduction and plate tectonics we would expect the ratio of iron and zinc isotopes to be either very high or very low, but our analyses instead found the ratio of isotopes was similar to that found in non-subduction rocks.”
Dr Doucet said the team used a relatively new technique known as the non-traditional stable isotope method, which has been used to pinpoint the processes that formed continental and mantle rocks.
“Our research provides a new, but unknown theory as to how the Earth’s continents formed more than three billion years ago. Further research will be needed to determine what the unknown explanation is,” Dr Doucet said.
The research was co-authored by researchers from Curtin’s Earth Dynamics Research Group, Université Libre de Bruxelles in Belgium, Institute for Geochemistry and Petrology in Switzerland, and Université de Montpellier in France.
Reference:
Wendy Debouge, Vinciane Debaille, Nadine Mattielli, Dmitri A. Ionov, Oscar Laurent, Luc S. Doucet. Archean lithospheric differentiation: Insights from Fe and Zn isotopes. Geology, 2020; DOI: 10.1130/G47647.1
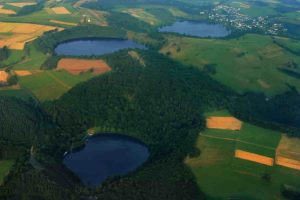
Three water-filled maars, created by volcanic eruptions, in Germany’s Eifel region. Credit: Martin Schildgen/Wikimedia Commons
An ancient European volcanic region may pose both a greater long-term volcanic risk and seismic risk to northwestern Europe than scientists had realized, geophysicists report in a study in the Geophysical Journal International.
The scientists are not predicting that a volcanic eruption or earthquake is imminent in the densely populated area, which is centered in the Eifel region of Germany, and covers parts of Belgium, the Netherlands, France and Luxembourg. But the study revealed activity that is uncommon for the region.
“Our findings suggest this region is an active volcanic system, and much more seismically active than many of the faults in Europe between the Eifel volcanic region and the Alps,” said Paul Davis, a UCLA research professor of geophysics and a senior author of the study.
Davis and his co-authors report subtle, unusual movements in the surface of the Earth, from which they conclude the Eifel volcanic region remains seismically active. The region has a long history of volcanic activity, but it has been dormant for a long time; scientists think the last volcanic eruption there was some 11,000 years ago.
The geophysicists report that the land surface in that region is lifting up and stretching apart, both of which are unusual in Europe. Although the uplift is only a fraction of an inch per year, it is significant in geological terms, Davis said.
The geophysicists analyzed global positioning system data from across Western Europe that showed subtle movements in the Earth’s surface. That enabled them to map out how the ground is moving vertically and horizontally as the Earth’s crust is pushed, stretched and sheared.
The dome-like uplift they observed suggests those movements are generated by a rising subsurface mantle plume, which occurs when extremely hot rock in the Earth’s mantle becomes buoyant and rises up, sending extremely hot material to the Earth’s surface, causing the deformation and volcanic activity. The mantle is the geological layer of rock between the Earth’s crust and its outer core.
Corné Kreemer, the study’s lead author, is a research professor at the University of Nevada, Reno’s Nevada Bureau of Mines and Geology. He said many scientists had assumed that volcanic activity in the Eifel was a thing of the past, but the study indicates that no longer seems to be the case.
“It seems clear that something is brewing underneath the heart of northwest Europe,” he said.
The Eifel volcanic region houses many ancient volcanic features, including circular lakes known as maars — which are remnants of violent volcanic eruptions, such as the one that created Laacher See, the largest lake in the area. The explosion that created Laacher See is believed to have occurred approximately 13,000 years ago, with an explosive power similar to that of the spectacular 1991 Mount Pinatubo eruption in the Philippines.
The researchers plan to continue monitoring the area using a variety of geophysical and geochemical techniques to better understand potential risks.
The research was supported by the Royal Dutch Academy of Sciences, the United States Geological Survey, the National Earthquake Hazard Reduction Program and NASA.
Earth magnetic field. Credit: Carnegie Institution for Science
How did the chemical makeup of our planet’s core shape its geologic history and habitability?
Life as we know it could not exist without Earth’s magnetic field and its ability to deflect dangerous ionizing particles from the solar wind and more far-flung cosmic rays. It is continuously generated by the motion of liquid iron in Earth’s outer core, a phenomenon called the geodynamo.
Despite its fundamental importance, many questions remain unanswered about the geodynamo’s origin and the energy sources that have sustained it over the millennia.
New work from an international team of researchers, including current and former Carnegie scientists Alexander Goncharov, Nicholas Holtgrewe, Sergey Lobanov, and Irina Chuvashova examines how the presence of lighter elements in the predominately iron core could affect the geodynamo’s genesis and sustainability. Their findings are published by Nature Communications.
Our planet accreted from the disk of dust and gas that surrounded our Sun in its youth. Eventually, the densest material sank inward in the forming planet, creating the layers that exist today — core, mantle, and crust. Although, the core is predominately iron, seismic data indicates that some lighter elements like oxygen, silicon, sulfur, carbon, and hydrogen, were dissolved into it during the differentiation process.
Over time, the inner core crystallized and has been continuously cooling since then. On its own, could heat flowing out of the core and into the mantle drive the geodynamo? Or does this thermal convection need an extra boost from the buoyancy of light elements, not just heat, moving out of a condensing inner core?
Understanding the specifics of the core’s chemical composition can help answer this question.
Silicates are predominant in the mantle, and after oxygen and iron, silicon is the third-most-abundant element in the Earth, so it is a likely option for one of the main lighter elements that could be alloyed with iron in the core. Led by Wen-Pin Hsieh of Academia Sinica and National Taiwan University, the researchers used lab-based mimicry of deep Earth conditions to simulate how the presence of silicon would affect the transmission of heat from the planet’s iron core out into the mantle.
“The less thermally conductive the core material is, the lower the threshold needed to generate the geodynamo,” Goncharov explained. “With a low enough threshold, the heat flux out of the core could be driven entirely by the thermal convection, with no need for the additional movement of material to make it work.”
The team found that a concentration of about 8 weight percent silicon in their simulated inner core, the geodynamo could have functioned on heat transmission alone for the planet’s entire history.
Looking forward, they want to expand their efforts to understand how the presence of oxygen, sulfur, and carbon in the core would influence this convection process.
The authors were supported by the Academia Sinica, the Ministry of Science and Technology of Taiwan, the National Natural Science Foundation of China, the Foundation for the Advancement of Outstanding Scholarship, the Chinese Academy of Science, the U.S. National Science Foundation, the Army Research Office, the Deep Carbon Observatory, and the Helmholtz Young Investigators Group.
Reference:
Wen-Pin Hsieh, Alexander F. Goncharov, Stéphane Labrosse, Nicholas Holtgrewe, Sergey S. Lobanov, Irina Chuvashova, Frédéric Deschamps, Jung-Fu Lin. Low thermal conductivity of iron-silicon alloys at Earth’s core conditions with implications for the geodynamo. Nature Communications, 2020; 11 (1) DOI: 10.1038/s41467-020-17106-7
Earth’s geomagnetic field surrounds and protects our planet from harmful space radiation. Credit: CC BY-SA 2.0 photo / Flickr user NASA Goddard Space Flight Center
A new study by the University of Leeds and University of California at San Diego reveals that changes in the direction of the Earth’s magnetic field may take place 10 times faster than previously thought.
Their study gives new insight into the swirling flow of iron 2800 kilometres below the planet’s surface and how it has influenced the movement of the magnetic field during the past hundred thousand years.
Our magnetic field is generated and maintained by a convective flow of molten metal that forms the Earth’s outer core. Motion of the liquid iron creates the electric currents that power the field, which not only helps guide navigational systems but also helps shield us from harmful extra terrestrial radiation and hold our atmosphere in place.
The magnetic field is constantly changing. Satellites now provide new means to measure and track its current shifts but the field existed long before the invention of human-made recording devices. To capture the evolution of the field back through geological time scientists analyse the magnetic fields recorded by sediments, lava flows and human-made artefacts. Accurately tracking the signal from Earth’s core field is extremely challenging and so the rates of field change estimated by these types of analysis are still debated.
Now, Dr Chris Davies, associate professor at Leeds and Professor Catherine Constable from the Scripps Institution of Oceanography, UC San Diego, in California have taken a different approach. They combined computer simulations of the field generation process with a recently published reconstruction of time variations in Earth’s magnetic field spanning the last 100,000 years
Their study, published in Nature Communications, shows that changes in the direction of Earth’s magnetic field reached rates that are up to 10 times larger than the fastest currently reported variations of up to one degree per year.
They demonstrate that these rapid changes are associated with local weakening of the magnetic field. This means these changes have generally occurred around times when the field has reversed polarity or during geomagnetic excursions when the dipole axis — corresponding to field lines that emerge from one magnetic pole and converge at the other — moves far from the locations of the North and South geographic poles.
The clearest example of this in their study is a sharp change in the geomagnetic field direction of roughly 2.5 degrees per year 39,000 years ago. This shift was associated with a locally weak field strength, in a confined spatial region just off the west coast of Central America, and followed the global Laschamp excursion — a short reversal of the Earth’s magnetic field roughly 41,000 years ago.
Similar events are identified in computer simulations of the field which can reveal many more details of their physical origin than the limited paleomagnetic reconstruction.
Their detailed analysis indicates that the fastest directional changes are associated with movement of reversed flux patches across the surface of the liquid core. These patches are more prevalent at lower latitudes, suggesting that future searches for rapid changes in direction should focus on these areas.
Dr Davies, from the School of Earth and Environment, said: “We have very incomplete knowledge of our magnetic field prior to 400 years ago. Since these rapid changes represent some of the more extreme behaviour of the liquid core they could give important information about the behaviour of Earth’s deep interior.”
Professor Constable said: “Understanding whether computer simulations of the magnetic field accurately reflect the physical behaviour of the geomagnetic field as inferred from geological records can be very challenging.
“But in this case we have been able to show excellent agreement in both the rates of change and general location of the most extreme events across a range of computer simulations. Further study of the evolving dynamics in these simulations offers a useful strategy for documenting how such rapid changes occur and whether they are also found during times of stable magnetic polarity like what we are experiencing today.”
Reference:
Christopher J. Davies, Catherine G. Constable. Rapid geomagnetic changes inferred from Earth observations and numerical simulations. Nature Communications, 2020; 11 (1) DOI: 10.1038/s41467-020-16888-0
The composition of fossilised zooplankton shells has enabled the reconstruction of past pH and CO2. Credit: University of Southampton
By 2025, atmospheric carbon dioxide (CO2) levels will very likely be higher than they were during the warmest period of the last 3.3 million years, according to new research by a team from the University of Southampton published today in Nature Scientific Reports.
The team studied the chemical composition of tiny fossils, about the size of a pin head collected from deep ocean sediments of the Caribbean Sea. They used this data to reconstruct the concentration of CO2 in Earth’s atmosphere during the Pliocene epoch, around 3 million years ago when our planet was more than 3°C warmer than today with smaller polar ice caps and higher global sea-levels.
Dr. Elwyn de la Vega, who led the study, said: “Knowledge of CO2 during the geological past is of great interest because it tells us how the climate system, ice sheets and sea-level previously responded to the elevated CO2 levels. We studied this particular interval in unprecedented detail because it provides great contextual information for our current climate state.”
To determine atmospheric CO2, the team has used the isotopic composition of the element boron, naturally present as an impurity in the shells of zooplankton called foraminifera or ‘forams’ for short. These organisms are around half a millimeter in size and gradually accumulate in huge quantities on the seabed, forming a treasure trove of information on Earth’s past climate. The isotopic composition of the boron in their shells is dependent on the acidity (the pH) of the seawater in which the forams lived. There is a close relationship between atmospheric CO2 and seawater pH, meaning past CO2 can be calculated from careful measurement of the boron in ancient shells.
Dr. Thomas Chalk, a co-author of the study, added: “Focussing on a past warm interval when the incoming insolation from the Sun was the same as today gives us a way to study how Earth responds to CO2 forcing. A striking result we’ve found is that the warmest part of the Pliocene had between 380 and 420 parts per million CO2 in the atmosphere. This is similar to today’s value of around 415 parts per million, showing that we are already at levels that in the past were associated with temperature and sea-level significantly higher than today. Currently, our CO2 levels are rising at about 2.5 ppm per year, meaning that by 2025 we will have exceeded anything seen in the last 3.3 million years.”
Professor Gavin Foster, who was also involved in the study, continued: “The reason we don’t see Pliocene-like temperatures and sea-levels yet today is because it takes a while for Earth’s climate to fully equilibrate (catch up) to higher CO2 levels and, because of human emissions, CO2 levels are still climbing. Our results give us an idea of what is likely in store once the system has reached equilibrium.”
Concluded Dr. de la Vega, “Having surpassed Pliocene levels of CO2 by 2025, future levels of CO2 are not likely to have been experienced on Earth at any time for the last 15 millions years, since the Middle Miocene Climatic Optimum, a time of even greater warmth than the Pliocene.”
The paper, “Atmospheric CO2 during the Mid-Piacenzian Warm Period and the M2 glaciation,” is published in Nature Scientific Reports.
Reference:
Elwyn de la Vega et al. Atmospheric CO2 during the Mid-Piacenzian Warm Period and the M2 glaciation, Scientific Reports (2020). DOI: 10.1038/s41598-020-67154-8