back to top
27.8 C
New York
Sunday, October 6, 2024
Home Blog Page 47

Researchers determine dinosaur replaced teeth as fast as sharks

CT scan-generated models of the jaws of Majungasaurus (left), Ceratosaurus (center) and Allosaurus (right), with microscopic views of the interior of their teeth below each model. Stripes running from upper left to lower right in each microscopic image are daily deposited incremental lines, which allow the amount of time it took for a tooth to grow to be reconstructed. Credit: PLOS ONE

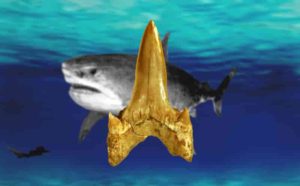
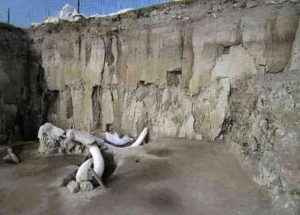
A meat-eating dinosaur species (Majungasaurus) that lived in Madagascar some 70 million years ago replaced all its teeth every couple of months or so, as reported in a new study published today in the open-access journal PLOS ONE, surprising even the researchers.

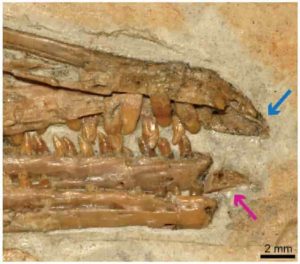
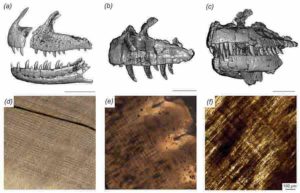
In fact, Majungasaurus grew new teeth roughly two to thirteen times faster than those of other carnivorous dinosaurs, says paper lead-author Michael D. D’Emic, an assistant professor of biology at Adelphi University. Majungasaurus would form a new tooth in each socket approximately every two months.

“This meant they were wearing down on their teeth quickly, possibly because they were gnawing on bones,” D’Emic said. “There is independent evidence for this in the form of scratches and gouges that match the spacing and size of their teeth on a variety of bones—bones from animals that would have been their prey.” Importantly, the study also examined two other species of predatory dinosaur (Allosaurus and Ceratosaurus), providing an opportunity to consider tooth growth patterns at a broader scale.

Some animals today, too, will gnaw on bones, including rodents, D’Emic said. It’s a way for them to ingest certain nutrients. It also requires exceptionally strong teeth—but Majungasaurus did not have those.

“That’s our working hypothesis for why they had such elevated rates of replacement,” D’Emic said. The rapid-fire tooth growth puts Majungasaurus in same league with sharks and big, herbivorous dinosaurs, he adds.

In collaboration with Patrick O’Connor, professor of anatomy at Ohio University, D’Emic used a collection of isolated fossil teeth to examine microscopic growth lines in the teeth. These growth lines are similar to tree rings, but instead of being deposited once a year, they are deposited daily. At the same, the team used computerized tomography (CT) on intact jaws to visualize unerupted teeth growing deep inside the bones. This allowed them to estimate tooth-replacement rates in a large number of individual jaws so they could cross-check their results.

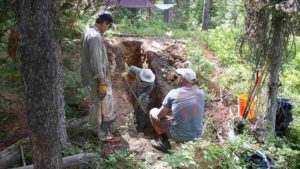
The time-consuming process would not have been possible without the involvement of students at both OHIO and Adelphi. Graduate students Thomas Pascucci (Adelphi University) and Eric Lund (Ohio University) played important roles as part of the research team, serving to conduct both microscopic and digital computed tomography analyses at the heart of the study.

“As an interdisciplinary Ph.D. student, being able to work on impactful, multi-institutional research utilizing novel approaches has been really influential and highlights the power of interdisciplinary approaches to answering tough scientific questions,” Lund said.

“The ability to interface with colleagues across the state, country, or planet, particularly when we can include students in different parts of the research process, is a game changer when we consider collaborative research in the 21st Century,” O’Connor stated. “This project addresses yet another aspect of the biology of Majungasaurus, and predatory dinosaurs more generally,” he added, “heralding the next phase of research based on recent field discoveries.”

Reference:
PLOS ONE (2019). doi.org/10.1371/journal.pone.0224734

Note: The above post is reprinted from materials provided by Ohio University.

New Cretaceous mammal fossil sheds light on evolution of middle ear

Reconstruction of Jeholbaatar kielanae. Credit: XU Yong

Researchers from the Institute of Vertebrate Paleontology and Paleoanthropology (IVPP) of the Chinese Academy of Sciences and the American Museum of Natural History (AMNH) have reported a new species of multituberculate—a type of extinct Mesozoic rodent—with well-preserved middle ear bones from the Cretaceous Jehol Biota of China. The findings were published in Nature on November 27.

The new mammal, Jeholbaatar kielanae, has a middle ear that is distinct from those of its relatives. Wang Yuanqing and Wang Haibing from IVPP, along with Meng Jin from AMNH, proposed that the evolution of its auditory apparatus might have been driven by specialization for feeding.

Fossil evidence shows that postdentary bones were either embedded in the postdentary trough on the medial side of the dentary or connected to the dentary via an ossified Meckel’s cartilage in early mammals, prior to their migration into the cranium as seen in extant mammals.

Detachment of the mammalian middle ear bones from the dentary occurred independently at least three times. But how and why this process took place in different clades of mammals remains unclear.

The Jeholbaatar kielanae specimen was discovered in the Jiufotang Formation in China’s Liaoning Province (Jehol Biota). It displays the first well-preserved middle-ear bones in multituberculates, providing solid evidence of the morphology and articulation of these bony elements, which are fully detached from the dentary.

It reveals a unique configuration with more complete components than those previously reported in multituberculates. The new fossil reveals a transitional stage in the evolution of the surangular—a “reptilian” jawbone.

In light of current evidence, scientists argue that the primary (malleus-incus) and secondary (squamosal-dentary) jaw joints co-evolved in allotherians, allowing a distinct palinal (anteroposterior) jaw movement while chewing.

Detachment of the auditory apparatus of the middle ear would have gained higher selective pressure in order to increase feeding efficiency, suggesting that evolution of the middle ear was probably triggered by functional constraints on the feeding apparatus in allotherians.

Reference:
Cretaceous fossil reveals a new pattern in mammalian middle ear evolution, Nature (2019). DOI: 10.1038/s41586-019-1792-0

Note: The above post is reprinted from materials provided by Chinese Academy of Sciences.

What are the Different Types and Colors of Moonstone? [With Pictures]

Natural crystal Labradorite Purple Moonstone

What is Moonstone?

Moonstone is a sodium potassium aluminium silicate ((Na,K)AlSi3O8) of the feldspar group that displays a pearly and opalescent schiller. An alternative name is hecatolite

The name derives from a visual effect, sheen or schiller (adularescence), caused by light diffraction within a microstructure consisting of normal exode layers (lamellae) of specific alkali feldspars (orthoclase and sodium-rich plagioclase).

Moonstone is an opalescent orthoclase type. Traditionally thought of as a stone of good luck and connected to a romantic desire, it was often given as a gift to lovers. Moonstone can be translucent with a strong blue hue on the surface, or it can be milky with the appearance of inner light.

The ancient Romans had theorized that Moonstone, with its unfathomable glow, had been created by frozen moonlight. This beautiful gem variety shines with cool lunar light, but it is a mineral feldspar, very terrestrial in nature. The shimmer, called schiller or adularescence, is caused by the intergrowth of two different types of feldspar with different refractive indexes.

Moonstones come in a variety of colors. The body color can range from colorless to gray, brown, yellow, green, or pink. The clarity ranges from transparent to translucent. The best moonstone has a blue sheen, perfect clarity, and a colorless body color.

Sometimes the moonstone has an eye as well as a glare. The similar feldspar form is known as Moonstone Rainbow. A variety of feldspar labradorite has a range of rainbow colours, from red and orange, to white, purple and blue. Sometimes a gem will reveal all of these colors.

Fine moonstone is quite rare and becoming rarer. It is mined in Sri Lanka and Southern India. The rainbow variety can be found in India and Madagascar.

Moonstones are usually cut in a smooth, oval cabochon shape to maximize the effect. Sometimes it’s carved to display a man-in – the-moon head.

Moonstone has a 6 to 6.5 hardness. It should not be kept in contact with your other gemstones to avoid scratching. Wash with a mild soap dish: use a toothbrush to clean behind a stone where dust can be gathered.

Types and Colours of Moonstone

Blue Moonstone

Blue Moonstone
Blue Moonstone

The blue moonston with its floating blue color on the surface is transparent and crystal clear. The most desirable rocks are of the strongest blue colour. The largest and best stones usually come from Myanmar (Burma), but the discovery of good stones became much more difficult and the price rose.

Blue moonstone is sometimes faceted, however much care needs to be taken when working with it, as the material can be brittle and break under pressure.

Rainbow Moonstone

The Rainbow Moonstone emerges from the empty orthoclastic inclusions and textures and has a milky patchy look. The reflection from the layers and inclusions generates a rainbow effect when the stone attracts light. This is a very common color play and is commonly used in silver jewelry.

Rainbow Moonstone
Rainbow Moonstone

The scientific name for moonstone with rainbows is labradorite, and although the name is distinct from genuine orthoclase moonstone.

Moonstone has a transparent, white color similar to “moonshine” which, when rolled, rolls or floats over the stone, which is why the term is called “moonstone.” A rainbow moonstone is typically a creamy translucent white stone with occasional (particularly blue) iridescent or painted flashes that varies from opaque to semitranslucent.

Moonstone Rainbow is best seen for playing color in the natural light. In the jewels of ancient civilizations Moonstone was used. The Romans thought that the moon was born from solidified moon rays. The Romans and Greeks combined lunar gods with moonstones. Moonstone became famous with the development of jewellery artists and goldsmiths during the Art Nouveau period in the early 20th century.

The moonstone of Rainbow is present in various parts of the world, including China, India, Australia, Malagasy, Sri Lanka and Russia. Because the feldspar mineral comprises 60% of the Earth’s crust, it is commonly found in small parts and smaller parts are much rarer.

Green Moonstone

Green Moonstone
Green Moonstone

Green moon is not as well recognized as a rainbow or a blue moon as the color game, but it’s still a lovely stone. This usually appears slightly white or transparent with a pale green-yellow colour. If you look down on the pier, like a full moon, you’re going to see a glow from inside. This optical effect is usually filtered out with a tall dome, and often a star of light on the top of the dome can be seen.


Pink Moonstone

Pink Moonstone
Pink Moonstone

The term pink encompasses color, varying from honey to beige to peach. The stone has a white shine and often is seen with the appearance of a cat’s eye or a star. This type of rock is commonly used in painted bead columns.

Orthoclase

The orthoclase feldspar is an essential mineral of the tectosilicate, or orthoclase orthodontic (endmember formulation KAlSi3O8). It’s a “straight fracture,” since its two cleavages are at right angles to each other. The name is of Ancient Greek. It’s a potassium feldspar type, also referred to as K-feldspar. The diamond (composed mainly by orthoclase) is called the moonstone.

Orthoclase is an expensive, colorless, pale yellow and transparent stone which has a white or shiny blue tone. The colourless variety, as seen on Mount Adular in Switzerland, is called adularia. Due to its fragile nature, orthoclase is usually seen as a step cut and is therefore not widely used or produced.

Amazonite

Amazonite is a mineral that is beautiful and opaque. It is either a blue-green or a blue and white streaked hue because of the presence of mercury. Even with the solid color content, the color pattern is typically erratic. Amazonite can come in various colors, including orange, purple, red and gray but it is the most popular and widely used blue green paint.

Sugar delivered to Earth from space

Murchison meteorite
This is a Murchison meteorite. Sugars are found from this meteorite in this study.. Credit: Yoshihiro Furukawa

Researchers from Tohoku University, Hokkaido University, JAMSTEC, and NASA Goddard Space Flight Center investigated meteorites and found ribose and other sugars. These sugars possessed distinct carbon-isotope compositions, differing from terrestrial biological sugars, indicating their extraterrestrial origin. The results suggest that the sugars formed in the early solar system and made their way to earth via meteorites.

The team analyzed three meteorites with their original protocol and found sugars in two meteorites. “Analysis of sugars in meteorites is so difficult. Over the past several years, we have investigated the techniques of sugar analysis in such samples and constructed our original method” says lead author, Yoshihiro Furukawa of Tohoku University.

Amino acids and nucleobases, other vitally important compounds in the building block of life, have been found in meteorites previously. Scientists have known of the existence of sugars in meteorites. However, research to date has largely revealed sugar-related compounds (sugar acids and sugar alcohols) and the simplest sugar (dihydroxy acetone), compounds not considered essential for life.

Formation of bio-essential sugars, including ribose, on the prebiotic Earth, is considered to have been possible. However, there is no geological evidence of their formation. Furthermore, it is not clear which and how much sugar(s) formed on the prebiotic Earth.

With the current research evidencing the delivery of bio-essential sugars, it is plausible that extraterrestrial sugar contributed to the formation of primordial RNA on the prebiotic Earth. This, in turn, has the possibility of being a factor in the origin of life.

“The next step is to investigate the chirality of the sugars in more meteorites and to investigate how much sugars were provided from space and how the extraterrestrial sugar influenced life’s homochirality” says the team. NASA Jonson Space Center has provided the team other meteorites and the team will analyze them to see which meteorites contain the sugars and how theses sugars formed.

Reference:
Extraterrestrial ribose and other sugars in primitive meteorites. DOI: 10.1073/pnas.1907169116

Note: The above post is reprinted from materials provided by Tohoku University.

Newborn volcanic island in the Pacific has survived five years

An October 7th, 2019 image of Hunga Tonga-Hunga Ha‘apai from NASA Earth Observatory. Credit: Joshua Stevens, using RADARSAT-2 data courtesy of James Garvin/NASA GSFC

A surtseyan eruption is a volcanic eruption in shallow water. It’s named after the island Surtsey, off the coast of Iceland. In 2015, a surtseyan eruption in the Tongan Archipelago created the island Hunga Tonga-Hunga Ha’apai. Despite the odds, that island is still there almost five years later.

Fortunately, scientists have a wealth of resources at their disposal to study this whole phenomenon. These types of eruptions are difficult to study, since they occur underwater, and often in remote locations. They also tend to erode away quickly. But Earth-observing satellites are changing that, and Hunga Tonga-Hunga Ha’apai is the first of its kind to be studied intensively, especially during its formation.

Jim Garvin and Dan Slayback are two NASA scientists who have studied the volcanic island. They’ve relied on radar imaging satellites to do so, using synthetic aperture radar (SAR). SAR can see through clouds and can see at night, providing high-resolution images of the island. In 2018, Garvin, Slayback, and other scientists published a paper on their observations in the AGU journal Geophysical Letters. The paper is titled “Monitoring and Modeling the Rapid Evolution of Earth’s Newest Volcanic Island: Hunga Tonga Hunga Ha’apai (Tonga) Using High Spatial Resolution Satellite Observations.”

Before the eruption, there were two small islands nearby. They were in a relatively isolated location, about 30 kilometers (19 miles) from the Tongan island of Fonuafo’ou. On December 19, 2014, fishermen spotted a plume of white steam rising from under the water. Satellite images from December 29th show the plume. Eventually, an ash cloud rose 3 kilometers into the sky on January 9th, 2015. By January 11th, the plume reached 9 kilometers (30,000 feet) high.

By January 26, Tongan officials declared the eruption over. By that time, the island was 1 to 2 kilometers (0.62 to 1.24 miles) wide, 2 kilometers (1.2 miles) long, and 120 meters (390 feet) high.

During 2015, the island stabilized somewhat, thanks to redistribution of volcanic material and “hydrothermal alteration” of the same. The island had a crater lake in the middle, which was eventually eroded away. Then a sandbar formed, sealing it off again, and protecting it from ocean waves. Eventually, ash and sediment widened the isthmus connecting it to Hunga Tonga to the northeast.

The team studying this volcanic island has developed two scenarios for its future.

The first sees accelerated erosion due to ocean waves, and in six or seven years, only the land bridge connecting the two island would remain. What’s called the “tuff cone” would be eroded. The second scenario sees slower erosion, with the tuff cone intact for up to 30 years.

The volcanic island changed the most in its first six months. At that time, Slayback and Garvin thought that the island might disappear quickly. When the barrier protecting the crater lake and the tuff cone was washed away, they thought the island’s demise was near. But the sandbar reappeared.

“Those cliffs of volcanic ash are pretty unstable,” said remote sensing specialist and co-author Dan Slayback of NASA Goddard in a press release.

This new volcanic island and its neighbors are situated above the north rim of a caldera of a much larger underwater volcano. That whole complex rises 1400 meters (4,593 feet) above the ocean floor, and the larger caldera is about 5 kilometers (3 miles) across.

In 2017, NASA scientist Jim Garvin said, “Volcanic islands are some of the simplest landforms to make. Our interest is to calculate how much the three-dimensional landscape changes over time, particularly its volume, which has only been measured a few times at other such islands. It is the first step to understanding erosion rates and processes and deciphering why the island has persisted longer than most people expected.”

Dan Slayback visited the island in October 2019, and wrote in a blog post: “We made many useful observations, collected some good data, and gained a more practical human-scale understanding of the topography of the place (such as that the adjacent pre-existing islands and their rocky shorelines are almost fortress-like in their inaccessibility). We also saw things not accessible from space, such as the hundreds of nesting sooty terns, and details of the emergent vegetation.”

A Martian Connection?

Garvin and Slayback think that their study of this volcano is not only useful for understanding our own planet; they think it might shed light on processes on Mars.

“Using the Earth to understand Mars is, of course, something we do,” Garvin said, noting the similarities in erosion on the island and scars left by ancient eruptions through shallow seas on Mars. “Mars may not have a place exactly like this, but still, it bespeaks the planet’s history of persistent water.”

Mars is not without volcanoes. In fact, it’s home to the largest volcano in the solar system, now dormant. Olympus Mons rises almost 22 kilometers (13.6 miles or 72,000 feet) above the surface of Mars. It’s the granddaddy of volcanoes. But NASA’s Mars Reconnaissance Orbiter (MRO) has found fields of smaller volcanoes. These volcanoes may once have erupted into the Martian oceans, deep in that planet’s geological past. Those surviving landscapes could tell us something about how those ancient volcanoes responded to the active Mars environment.

Reference:
J. B. Garvin et al. Monitoring and Modeling the Rapid Evolution of Earth’s Newest Volcanic Island: Hunga Tonga Hunga Ha’apai (Tonga) Using High Spatial Resolution Satellite Observations, Geophysical Research Letters (2018). DOI: 10.1002/2017GL076621

Note: The above post is reprinted from materials provided by Universe Today.

New technology developed to improve forecasting of Earthquakes, Tsunamis

The shallow water buoy can detect small movements and changes in the Earth's seafloor that are often a precursor to deadly natural hazards, like earthquakes, volcanoes and tsunamis. Credit: University of South Florida
The shallow water buoy can detect small movements and changes in the Earth’s seafloor that are often a precursor to deadly natural hazards, like earthquakes, volcanoes and tsunamis. Credit: University of South Florida

University of South Florida geoscientists have successfully developed and tested a new high-tech shallow water buoy that can detect the small movements and changes in the Earth’s seafloor that are often a precursor to deadly natural hazards, like earthquakes, volcanoes and tsunamis.

The buoy, created with the assistance of an $822,000 grant from the National Science Foundation’s Ocean Technology and Interdisciplinary Coordination program, was installed off Egmont Key in the Gulf of Mexico last year and has been producing data on the three-dimensional motion of the sea floor. Ultimately the system will be able to detect small changes in the stress and strain the Earth’s crust, said USF School of Geosciences Distinguished Professor Tim Dixon.

The patent-pending seafloor geodesy system is an anchored spar buoy topped by high precision Global Positioning System (GPS). The buoy’ orientation is measured using a digital compass that provides heading, pitch, and roll information — helping to capture the crucial side-to-side motion of the Earth that can be diagnostic of major tsunami-producing earthquakes, Dixon said. He was joined in leading the project by USF Geoscience Phd student Surui Xie, Associate Professor Rocco Malservisi USF College of Marine Science’s Center for Ocean Technology research faculty member Chad Lembke, and a number of USF ocean technology personnel.

Their findings were recently published in the Journal of Geophysical Research-Solid Earth.

While there are several techniques for seafloor monitoring currently available, that technology typically works best in the deeper ocean where there is less noise interference. Shallow coastal waters (less than a few hundred meters depth) are a more challenging environment but also an important one for many applications, including certain types of devastating earthquakes, the researchers said. Offshore strain accumulation and release processes are critical for understanding megathrust earthquakes and tsunamis, they noted.

The experimental buoy rests on the sea bottom using a heavy concrete ballast and has been able to withstand several storms, including Hurricane Michael’s march up the Gulf of Mexico. The system is capable of detecting movements as small as one to two centimeters, said Dixon, an expert on natural hazards and author of the book Curbing Catastrophe.

“The technology has several potential applications in the offshore oil and gas industry and volcano monitoring in some places, but the big one is for improved forecasting of earthquakes and tsunamis in subduction zones,” Dixon said. “The giant earthquakes and tsunamis in Sumatra in 2004 and in Japan in 2011 are examples of the kind of events we’d like to better understand and forecast in the future.”

Dixon said the system is designed for subduction zone applications in the Pacific Ocean’s “Ring of Fire” where offshore strain accumulation and release processes are currently poorly monitored. One example where the group hopes to deploy the new system is the shallow coastal waters of earthquake prone Central America.

The Egmont Key test location sits in just 23 meters depth. While Florida is not prone to earthquakes, the waters off Egmont Key proved an excellent test location for the system. It experiences strong tidal currents that tested the buoy’s stability and orientation correction system. The next step in the testing is to deploy a similar system in deeper water of the Gulf of Mexico off Florida’s west coast.

Reference:
Surui Xie, Jason Law, Randy Russell, Timothy H. Dixon, Chad Lembke, Rocco Malservisi, Mel Rodgers, Giovanni Iannaccone, Sergio Guardato, David F. Naar, Daniele Calore, Nicola Fraticelli, Jennifer Brizzolara, John W. Gray, Matt Hommeyer, Jing Chen. Seafloor Geodesy in Shallow Water With GPS on an Anchored Spar Buoy. Journal of Geophysical Research: Solid Earth, 2019; DOI: 10.1029/2019JB018242

Note: The above post is reprinted from materials provided by University of South Florida (USF Innovation).

Moonstone vs Opal : What’s the difference between Moonstone and Opal?

Rainbow Moonstone. Credit: gemsnjewelry 2014

Moonstone vs Opal

Chemical Composition

Opal : (SiO2·nH2O)

Moonstone : ((Na,K)AlSi3O8)

About Moonstone vs Opal

Opal

Opal is a hydrated amorphous form of silica (SiO2·nH2O); its water content can range from 3 to 21 per cent by weight, but is usually between 6 and 10 per cent. Because of its amorphous nature, it is classified as mineraloid, unlike the crystalline forms of silica, which are classified as minerals.

It is deposited at a relatively low temperature and can occur in cracks of almost any kind of rock, most commonly found with limonite, sandstone, rhyolite, marl and basalt. Opal is Australia’s national gemstone.

Moonstone

Moonstone is a sodium potassium aluminum silicate ((Na, K)AlSi3O8) of the feldspar group with a pearly and opalescent schiller.

The most common moonstone is the orthoclase feldspar mineral adularia, named for the early mining site near Mt. Adular in Switzerland, now the town of St. Gotthard. Strong solution of plagioclase feldspar oligoclase + /-Potassium feldspar orthoclase also contains lunar stone samples.

Physical Properties

Opal is hardened by silica. Measures 7 on the Mohs hardness scale, with 10 being the hardest. Opal is available in a variety of colours, including white, red, pink and blue.

Moonstone is one of the most valuable forms of feldspar. Measure 6 on the Mohs scale. Moonstone ranges in color from silver gray to peach and has a white or blue sheen.

Occurrence

Opal occurs in a significant quantity and variety in central Mexico, where the Querétaro state mining and production center is located. In this area, the opal deposits are mainly located in the mountain ranges of three municipalities: Colón, Tequisquiapan and Ezequiel Montes.

Spencer, Idaho, is another source of white opal base or creamy opal in the United States. A high percentage of opal contained exists in thin layers.

Other large deposits of precious opal can be found worldwide in the Czech Republic, Canada, Slovakia, Hungary, Turkey, Indonesia, Brazil (in Pedro II, Piauí), Honduras (more specifically in Erandique), Guatemala and Nicaragua.

Moonstone is the Florida State Gemstone; it was designated as such in 1970 to commemorate the Moon landings, which took off from Kennedy Space Center. Despite it being the Florida State Gemstone, it does not naturally occur in the state.

Reference:

Opal
What Is Opal?
Types of Opal
Virgin Rainbow ;The most beautiful opal in the world
Welo Opal : What Is Welo Opal? Where Can You Find Welo Opal?
Geyser Opal  What is Geyser Opal? How it Formed?
Fire Opal : What Is Fire Opal? How Is Fire Opal Formed?
Moonstone : What Is Moonstone Gemstone? How Is The Moonstone Formed?

New study reveals secrets of Wolfe Creek Crater

An orthophoto of Wolfe Creek Crater. An orthophoto is an aerial photograph that has been geometrically corrected so that the scale is uniform and the photo has the same lack of distortion as a map. Credit: University of Wollongong

A study by an international research team led by Professor Tim Barrows from the University of Wollongong has thrown new light on how frequently large meteorites strike the Earth.

The research focused on Wolfe Creek Crater, one of the largest meteorite impact craters in Australia and the second largest on Earth from which meteorite fragments have been recovered (the largest is Meteor Crater in Arizona in the United States).

Horror film buffs might recognise Wolfe Creek Crater from the 2005 film Wolf Creek.

Located in a remote part of Western Australia, on the edge of the Great Sandy Desert and about 145 kilometres from Halls Creek via the Tanami Road, Wolfe Creek Crater was formed by a meteorite estimated to be about 15 metres in diameter and weighing around 14,000 tonnes.

The meteorite was probably travelling at 17 kilometres per second and struck with the force of 0.54 megatons of TNT.

Just when that impact occurred, however, had not been well understood.

The new study, published in the journal Meteoritics & Planetary Science, found that the impact most likely occurred around 120,000 years ago—much more recently than the previous estimate of 300,000 years ago.

Debris from outer space constantly bombards the Earth, but only the biggest objects survive the journey through the atmosphere to hit the planet’s surface and leave a crater. Having an accurate age for the Wolfe Creek Crater impact enabled the researchers to calculate how frequently such impacts occur.

Including Wolfe Creek Crater, there are seven sets of impact craters in Australia dating to within the past 120,000 years, said Professor Barrows, a Future Fellow in UOW’s School of Earth, Atmospheric and Life Sciences.

“Although the rate is only one large meteor hitting Australia every 17,000 years, it isn’t that simple,” he said.

“The craters are only found in the arid parts of Australia. Elsewhere, craters are destroyed by geomorphic activity like river migration or slope processes in the mountains. Since Australia has an excellent preservation record with dated craters within the arid zone, we can extrapolate a rate for the whole Earth.

“Taking into account that arid Australia is only about one percent of the surface, the rate increases to one every 180 years or so.

“This is a minimum estimate because some smaller impacts were probably covered by sand during the ice age. The number of large objects is probably 20 times this number because stony meteorites are far more common but not as many survive the fiery journey through the atmosphere or effectively make craters.

“Our results give us a better idea of how frequent these events are.”

Professor Barrows and his colleagues used two techniques to date the crater: exposure dating (which estimates the length of time a rock has been exposed at the Earth’s surface to cosmic radiation) and optically stimulated luminescence (which measures how long ago sediment was last exposed to sunlight).

The researchers also created a new 3-D topographical model of the crater using aerial photographs taken by Ted Brattstrom, a Hawaiian high school teacher who flew over the crater in 2007 taking photos of it from a number of different directions. They used this to calculate the crater’s dimensions.

“We calculate that the maximum width of the crater is 946 metres in a NE-SW direction, reflecting the direction of the impact. The average diameter is 892 metres. We predict a depth of 178 metres and that it is filled by about 120 metres of sediment, mostly sand blown in from the desert,” Professor Barrows said.

Using the same geochronological dating techniques, the researchers were also able to recalculate the age of the Meteor Crater in Arizona. They found it is likely to be 61,000 years old, more than 10,000 years older than previously thought.

Reference:
Timothy T. Barrows et al. The age of Wolfe Creek meteorite crater ( Kandimalal ), Western Australia, Meteoritics & Planetary Science (2019). DOI: 10.1111/maps.13378

Note: The above post is reprinted from materials provided by University of Wollongong.

New geologic modeling method explains collapse of ancient mountains in American West

Reconstructed paleo-elevation in southwestern North America at the Late Eocene (36 million years ago). Credit: Bahadori and Holt

By using the latest computer numerical modeling technologies, combined with geologic compilations and seismic data, researchers in the Department of Geosciences at Stony Brook University have developed a complete geodynamic model that explains the forces behind the remarkable collapse of what were lofty mountains some 30 million years ago in what is now part of the American West.

The research, published in Nature Communications, includes visuals that reveal how the mountains were probably higher than the Rockies are today and how a complex system of faults chopped the region up, allowing mountains to expand bountifully and form the Basin and Range province and the now dangerous San Andreas fault system in California.

The article is authored by graduate student Ali Bahadori and William E. Holt, Ph.D., and the study was funded by the National Science Foundation.

Holt, who is the project leader, says that the results will be combined with climate and erosion models of the vast region to better explain this geologic evolution over millions of years and its impact on the fauna and flora found in the fossil record.

Reference:
Alireza Bahadori et al. Geodynamic evolution of southwestern North America since the Late Eocene, Nature Communications (2019). DOI: 10.1038/s41467-019-12950-8

Note: The above post is reprinted from materials provided by Stony Brook University.

New Earth mission will track rising oceans into 2030

The Sentinel-6A spacecraft sits in its clean room in Germany's IABG space test center. The satellite is being prepared for a scheduled launch in November 2020 from Vandenberg Air Force Base in California. Credit: IABG
The Sentinel-6A spacecraft sits in its clean room in Germany’s IABG space test center. The satellite is being prepared for a scheduled launch in November 2020 from Vandenberg Air Force Base in California. Credit: IABG

Earth’s climate is changing, and the study of oceans is vital to understanding the effects of those changes on our future. For the first time, U.S and European agencies are preparing to launch a 10-year satellite mission to continue to study the clearest sign of global warming—rising sea levels. The Sentinel-6/Jason-CS mission (short for Jason-Continuity of Service), will be the longest-running mission dedicated to answering the question: How much will Earth’s oceans rise by 2030?

By 2030, Sentinel-6/Jason-CS will add to nearly 40 years of sea level records, providing us with the clearest, most sensitive measure of how humans are changing the planet and its climate.

The mission consists of two identical satellites, Sentinel-6A and Sentinel-6B, launching five years apart. The Sentinel-6A spacecraft was on display for the media on Nov. 15 for a last look in its clean room in Germany’s IABG space test center. The satellite is being prepared for a scheduled launch in November 2020 from Vandenberg Air Force Base in California on a SpaceX Falcon 9 rocket.

Sentinel-6/Jason-CS follows in the footsteps of four other joint U.S.-European satellite missions—TOPEX/Poseidon and Jason-1, Ocean Surface Topography/Jason-2, and Jason-3—that have measured sea level rise over the past three decades. The data gathered by those missions have shown that Earth’s oceans are rising by an average of 0.1 inches (3 millimeters) per year.

Sentinel-6/Jason-CS will continue that work, studying not just sea level change but also changes in ocean circulation, climate variability such as El Niño and La Niña, and weather patterns, including hurricanes and storms.

“Global sea level rise is, in a way, the most complete measure of how humans are changing the climate,” said Josh Willis, the mission’s project scientist at NASA’s Jet Propulsion Laboratory in Pasadena, California. “If you think about it, global sea level rise means that 70 percent of Earth’s surface is getting taller—70 percent of the planet is changing its shape and growing. So it’s the whole planet changing. That’s what we’re really measuring.”

Decades of space- and ground-based observations have documented Earth’s surface temperature rising at a rapidly accelerating rate. The oceans help to stabilize our climate by absorbing over 90 percent of the heat trapped on the planet by excess greenhouse gases, like carbon dioxide, that have been emitted into the atmosphere since the start of the Industrial Revolution.

As the oceans warm, they expand, increasing the volume of water; the trapped heat also melts ice sheets and glaciers, contributing further to sea level rise. The rate at which it is rising has accelerated over the past 25 years and is expected to continue accelerating in years to come.

Sentinel-6/Jason-CS will measure down to the millimeter how much global sea level rises during the 2020s and how fast that rise accelerates. As the rate increases, humans will need to adapt to the effects of rising seas—including flooding, coastal erosion, hazards from storms and negative impacts to marine life.

Along with measuring sea level rise, the mission will provide datasets that can help with weather predictions, assessing temperature changes in the atmosphere and collecting high-resolution vertical profiles of temperature and humidity.

As with its Jason-series predecessors, Sentinel-6/Jason-CS will gather global ocean data every 10 days, providing insights into large ocean features like El Niño events. However, unlike previous Jason-series missions, its higher-resolution instruments will also be able to provide data on smaller ocean features—including complex currents—that will benefit navigation and fishing communities.

“Global sea level rise is one of the most expensive and disruptive impacts of climate change that there is,” said Willis. “In our lifetimes, we’re not going to see global sea level fall by a meaningful amount. We’re literally charting how much sea level rise we’re going have to deal with for the next several generations.”

Note: The above post is reprinted from materials provided by NASA.

Telescopes and satellites combine to map entire planet’s ground movement

Earth
Earth

Curtin University research has revealed how pairing satellite images with an existing global network of radio telescopes can be used to paint a previously unseen whole-of-planet picture of the geological processes that shape the Earth’s crust.

The research, published in Geophysical Research Letters, showed that satellite images capturing the movement of the Earth’s surface on different continents as a result of geological and man-made forces can be integrated using radio telescopes to deliver a global-scale view and new understanding of these processes.

Lead researcher Dr. Amy Parker, an ARC Research Fellow from Curtin’s School of Earth and Planetary Sciences, said the global network of radio telescopes was shown to be a key link to integrating satellite measurements of ground movements on a global scale.

“The height of the Earth’s surface is constantly changed by geological forces like earthquakes and the effects of human activities, such as mining or ground water extraction,” Dr. Parker said.

“Increasing numbers of scientists are measuring these changes using the global coverage of images from radar satellites, however, it has not been previously possible to link together ground movements measured on different continents because they are measured relative to an arbitrary point and not a globally consistent reference frame.

“This is the first time we have thought about how to integrate these measurements on a global scale, and the potential benefits of this approach in terms of our understanding of the processes that shape our planet’s crust are significant.”

Dr. Parker said the study, which was done in collaboration with researchers from the University of Tasmania and Chalmers University of Technology in Sweden, demonstrated that the already existing global network of radio telescopes could be the missing link to integrate these satellite measurements on a worldwide scale.

“By harnessing the power of these radio telescopes, we hope to shed new light on the processes that shape the Earth’s crust including a complete, consistent assessment of the contribution of land displacements to relative sea-level rise,” Dr. Parker said.

Reference:
A. L. Parker et al. The Potential for Unifying Global‐Scale Satellite Measurements of Ground Displacements Using Radio Telescopes, Geophysical Research Letters (2019). DOI: 10.1029/2019GL084915

Note: The above post is reprinted from materials provided by Curtin University.

Life under extreme conditions at hot springs in the ocean

Aerial view of the acidic hot springs in the shallow water of the Taiwanese Kueishantao volcanic island, visible through the whitish discoloration of the sea water by sulphur. Credit: Mario Lebrato, Uni Kiel

The volcanic island of Kueishantao in northeastern Taiwan is an extreme habitat for marine organisms. With an active volcano, the coastal area has a unique hydrothermal field with a multitude of hot springs and volcanic gases. The acidity of the study area was among the highest in the world. The easily accessible shallow water around the volcanic island therefore represents an ideal research environment for investigating the adaptability of marine organisms, some of which are highly specialised, such as crabs, to highly acidified and toxic seawater.

For about ten years, marine researchers from the Institute of Geosciences at Kiel University (CAU), together with their Chinese and Taiwanese partners from Zhejiang University in Hangzhou and the National Taiwan Ocean University in Keelung, regularly collected data on geological, chemical and biological processes when two events disrupted the results of the time series in 2016. First, the island was shaken by an earthquake and hit by the severe tropical typhoon Nepartak only a few weeks later. On the basis of data collected over many years, the researchers from Kiel, China and Taiwan were now able to demonstrate for the first time that biogeochemical processes had changed due to the consequences of the enormous earthquake and typhoon and how different organisms were able to adapt to the changed seawater biogeochemistry in the course of only one year. The first results of the interdisciplinary study, based on extensive data dating back to the 1960s, were recently published in the international journal Nature Scientific Reports.

“Our study clearly shows how closely atmospheric, geological, biological and chemical processes interact and how an ecosystem with extreme living conditions such as volcanic sources on the ocean floor reacts to disturbances caused by natural events,” says Dr. Mario Lebrato of the Institute of Geosciences at Kiel University. For years, scientists led by Dr. Dieter Garbe-Schönberg and Dr. Mario Lebrato from the Institute of Geosciences at the CAU have been researching the shallow hydrothermal system “Kueishantao.” The selected site has a large number of carbon dioxide emissions in the shallow water. In addition, the sources release toxic metals. Sulphur discolours the water over large areas. The volcanic gases—with a high sulphur compounds—lead to a strong acidification of the sea water. Through methods of airborne drone surveying, modelling, regular sampling and laboratory experiments research into the hydrothermal field therefore makes an important contribution to the effects of ocean acidification on marine communities. Only a few specialized animal species such as crabs, snails and bacteria live in the immediate vicinity of the sources. A few metres away, on the other hand, is the diverse life of a tropical ocean.

“Due to the high acidity, the high content of toxic substances and elevated temperatures of the water, the living conditions prevailing there can serve as a natural laboratory for the investigation of significant environmental pollution by humans. The sources at Kueishantao are therefore ideal for investigating future scenarios,” says co-author Dr. Yiming Wang, who recently moved from Kiel University to the Max Planck Institute for the Science of Human History in Jena.

After the severe events in 2016, the study area changed completely. The seabed was buried under a layer of sediment and rubble. In addition, the acidic warm water sources dried up, and the composition of the sea water had significantly and continuously changed over a long period of time. Aerial photos taken with drones, samples taken by research divers from Kiel and Taiwan as well as biogeochemical investigations clearly showed the spatial and chemical extent of the disturbances. These were recorded by the biologist and research diver Mario Lebrato and his Taiwanese colleague Li Chun Tseng and compared with the results of earlier samplings. “What initially looked like a catastrophe for our current time series study turned out to be a stroke of luck afterwards. This gave us the rare opportunity to observe how organisms adapt to the severe disturbances. We were able to draw on a comprehensive database to do this” explains project manager Dr. Dieter Garbe-Schönberg from the Institute of Geosciences at Kiel University.

Reference:
Mario Lebrato et al, Earthquake and typhoon trigger unprecedented transient shifts in shallow hydrothermal vents biogeochemistry, Scientific Reports (2019). DOI: 10.1038/s41598-019-53314-y

Note: The above post is reprinted from materials provided by Kiel University.

Fossil dig leads to unexpected discovery of 91-million-year-old shark new to science

A 91-million-year-old fossil shark newly named Cretodus houghtonorum discovered in Kansas
Credit: Taylor & Francis

A 91-million-year-old fossil shark newly named Cretodus houghtonorum discovered in Kansas joins a list of large dinosaur-era animals. Preserved in sediments deposited in an ancient ocean called the Western Interior Seaway that covered the middle of North America during the Late Cretaceous period (144 million to 66 million years ago), Cretodus houghtonorum was an impressive shark estimated to be nearly 17 feet or slightly more than 5 meters long based on a new study appearing in the Journal of Vertebrate Paleontology.

The fossil shark was discovered and excavated in 2010 at a ranch near Tipton, Kansas, in Mitchell County by researchers Kenshu Shimada and Michael Everhart and two central Kansas residents, Fred Smith and Gail Pearson. Shimada is a professor of paleobiology at DePaul University in Chicago. He and Everhart are both adjunct research associates at the Sternberg Museum of Natural History, Fort Hays State University in Hays, Kansas. The species name houghtonorum is in honor of Keith and Deborah Houghton, the landowners who donated the specimen to the museum for science.

Although a largely disarticulated and incomplete skeleton, it represents the best Cretodus specimen discovered in North America, according to Shimada. The discovery consists of 134 teeth, 61 vertebrae, 23 placoid scales and fragments of calcified cartilage, which when analyzed by scientists provided a vast amount of biological information about the extinct shark. Besides its estimated large body size, anatomical data suggested that it was a rather sluggish shark, belonged to a shark group called Lamniformes that includes modern-day great white and sand tiger sharks as distant cousins, and had a rather distinct tooth pattern for a lamniform shark.

“Much of what we know about extinct sharks is based on isolated teeth, but an associated specimen representing a single shark individual like the one we describe provides a wealth of anatomical information that in turn offers better insights into its ecology,” said Shimada, the lead author on the study.

“As important ecological components in marine ecosystems, understanding about sharks in the past and present is critical to evaluate the roles they have played in their environments and biodiversity through time, and more importantly how they may affect the future marine ecosystem if they become extinct,” he said.

During the excavation, Shimada and Everhart believed they had a specimen of Cretodus crassidens, a species originally described from England and subsequently reported commonly from North America. However, not even a single tooth matched the tooth shape of the original Cretodus crassidens specimen or any other known species of Cretodus, Shimada said.

“That’s when we realized that almost all the teeth from North America previously reported as Cretodus crassidens belong to a different species new to science,” he noted.

The growth model of the shark calibrated from observed vertebral growth rings indicates that the shark could have theoretically reached up to about 22 feet (about 6.8 meters).

“What is more exciting is its inferred large size at birth, almost 4 feet or 1.2 meters in length, suggesting that the cannibalistic behavior for nurturing embryos commonly observed within the uteri of modern female lamniforms must have already evolved by the late Cretaceous period,” Shimada added.

Furthermore, the Cretodus houghtonorum fossil intriguingly co-occurred with isolated teeth of another shark, Squalicorax, as well as with fragments of two fin spines of a yet another shark, a hybodont shark.

“Circumstantially, we think the shark possibly fed on the much smaller hybodont and was in turn scavenged by Squalicorax after its death,” said Everhart.

Discoveries like this would not be possible without the cooperation and generosity of local landowners, and the local knowledge and enthusiasm of amateur fossil collectors, according to the authors.

“We believe that continued cooperation between paleontologists and those who are most familiar with the land is essential to improving our understanding of the geologic history of Kansas and Earth as a whole,” said Everhart.

The new study, “A new large Late Cretaceous lamniform shark from North America with comments on the taxonomy, paleoecology, and evolution of the genus Cretodus,” will appear in the forthcoming issue of the Journal of Vertebrate Paleontology.

Reference:
Kenshu Shimada et al. A New Large Late Cretaceous Lamniform Shark from North America, with Comments on the Taxonomy, Paleoecology, and Evolution of the Genus Cretodus, Journal of Vertebrate Paleontology (2019). DOI: 10.1080/02724634.2019.1673399

Note: The above post is reprinted from materials provided by Taylor & Francis.

New finding on origin of avian predentary in Mesozoic birds

The pink arrow points to the predentary and the blue arrow points to the upper portion of the jaw, which has no teeth. Together, they may have been covered by a keratinous beak, and the predentary was most likely mobile Credit: IVPP

The predentary bone is one of the most enigmatic skeletal elements in avian evolution. Located at the tip of the lower jaw, this bone is absent in more primitive birds and in living birds; it is thought to have been lost during evolution. For over 30 years, the origin and function of the avian predentary has remained mysterious.

Now, however, Alida Bailleul, LI Zhiheng, Jingmai O”Connor and ZHOU Zhonghe from the Institute of Vertebrate Paleontology and Paleoanthropology (IVPP) of the Chinese Academy of Sciences have made significant progress towards solving this long-standing mystery. Their findings were published in Proceedings of the National Academy of Sciences (PNAS) on November 18.

Using a battery of analytical methods, the team, led by Dr. Bailleul, presents strong evidence that the avian predentary was covered by a keratinous beak—a horny sheath that covers the bones of the rostrum in all living birds, all of which are edentulous and have beaks. It also provides evidence the predentary was proprioceptive, i.e., it was able to detect external mechanical stimuli; and was mobile—thus representing a now extinct form of cranial kinesis.

Cranial kinesis occurs when joints are able to move within the skull—mainly between the upper jaw and the braincase. This feature is widespread in living birds; however, it is thought to be mostly absent in Mesozoic birds.

Based on her examination of the fossilized tissues of the predentary and other jaw elements of Yanornis martini from the Jehol Biota, Dr. Bailleul identified a specific type of cartilage inside the joint between the predentary and dentary that strongly suggests some movement between these elements.

The team noticed that the predentary is only found in ornithuromorphs that have teeth. However, the tip of the premaxilla—the bone of the upper bill that would have occluded with the predentary—is without teeth. This suggests that the tip of the upper jaw, like the predentary, was also covered with a keratinous beak.

The tiny beak at the tip of the skull, combined with the sensitive and mobile predentary bone and teeth that were most likely also proprioceptive, represents a unique feeding adaptation that allowed greater dexterity when manipulating food. Although bizarre and now extinct, this unique feeding apparatus persisted in the ornithuromorph clade for at least 58 million years, from the Early to the Late Cretaceous.

Using information from the fossilized tissues and preexisting data on the embryology of living birds, the team also formulated a hypothesis regarding the origin of this bone, suggesting it is a sesamoid, similar to the human knee cap. Identification as a sesamoid means this bone is a novel skeletal innovation unique to one lineage of ornithuromorphs, and that it did not arise from a preexisting skull bone.

Although additional research on fossils birds (and also extant birds) is required to confirm some of these hypotheses, the predentary is such a small bone that it is only rarely preserved, thus making it very difficult—if not impossible—to find specimens that can shed light on the remaining pieces of this mystery.

Reference:
Alida M. Bailleul el al., “Origin of the avian predentary and evidence of a unique form of cranial kinesis in Cretaceous ornithuromorphs,” PNAS (2019). www.pnas.org/cgi/doi/10.1073/pnas.1911820116

Note: The above post is reprinted from materials provided by Chinese Academy of Sciences.

Fire Opal : What Is Fire Opal? How Is Fire Opal Formed?

Fire Opal
Multicolor rough crystal opal from Coober Pedy, South Australia, expressing nearly every color of the visible spectrum. Credit: Dpulitzer

Fire Opal

Fire opal is a translucent opal with warm body colors ranging from yellow to orange to gold. Even though it usually doesn’t show any color play, sometimes a stone will show bright green flashes. Querétaro in Mexico is the most popular supplier of fire opals; these opals are commonly referred to as Mexican fire opals.

Sometimes fire opals that do not display color play are referred to as jelly opals. Occasionally Mexican opals are cut into their rhyolitic host material if slicing and polishing is difficult enough. A form of opal from Mexico is called an opal from Cantera. A type of opal from Mexico, known as Mexican water opal, is also a colorless opal that shows either a bluish or golden internal shine.

Not all fire opals are similar. We distinguish between the common fire opals, which are either faced or cut into cabochons depending on their quality, and the particularly valuable ones, which, in addition to their vivacious color, also have the typical opal gaudy color play. But the fire opal plays its part as a high-quality gemstone to perfection with or without color play.

Fire opal has a Mohs hardness of 5.5 to 6, which is weak enough that many items will damage it during daily wear. Fire opal is also poor in tenacity, meaning it can be chipped or broken quickly.

Fire opal is best used in accessories such as earrings, pins and pendants that are not normally exposed to rough wear. If a fire opal is placed into a circle, it is recommended to have a setting built specifically to protect the stone from abrasion and impact.

How Is Fire Opal Formed?

Opal is a hydrated amorphous type of silica (SiO2·nH2O); its water content can differ by weight from 3 to 21%, but is typically between 6 and 10%. It is known as a mineraloid because of its amorphous nature, unlike crystalline types of silica, classified as minerals. It is deposited at a relatively low temperature and can occur in nearly any rock fissures, most commonly found in limonite, sandstone, rhyolite, marl, and basalt. Opal is Australia’s largest gemstone.

There are two broad opal classes: precious and normal. Play-of-color (iridescence) precious opal shows, not regular opal. Play-of-color was described as’ a pseudochromatic optical effect resulting in bursts of colored light from certain minerals as they are converted into white light.’ The precious opal’s internal structure allows it to diffract light, resulting in play-of-colour. Opal may be clear, translucent or opaque depending on the conditions under which it was made, and the background color may be white, black or almost any color of the visual spectrum.

Where Is Fire Opal Found?

For nearly 100 years, Mexico has been the primary fire opal source in the world. Fire Opal is found in Queretaro, Hidalgo, Guerrero, Michoacan, Julisio, Chihuahua and San Luis Potosi states of Mexico. Queretaro’s mines are the most important and have been mining since 1835. Small fire opal pebbles can be found in silica-rich lava flows.

Smaller quantities of fire opal are produced in Australia, Brazil, Honduras and Guatemala. Some beautiful fire opals are produced in the United States, Nevada and Oregon.

Is Fire Opal valuable?

Fire opal is a mineral opal variety, red, orange or yellow in colour. The visibility and clarity differ, as well as the particular complexity and brightness of its color, and these are some of the factors that determine the quality of fire opal. In comparison, the price of red fire opal is usually higher than the price of yellow samples.

Why is opal so expensive?

Several experienced opal valuers will price the opal per carat and the final value will be determined by the average price per carat. Over many years there has been guidelines developed on how to value Opal. We are going to explore the some factors that contribute to an Opals final value.

COLOR : Color is the first thing that you will notice about an opal. Red is the rarest and most sought out color. In order of value, the most valuable color is red, then orange, green, blue and purple. However, Opal is usually never a single color.
DIRECTION OF COLOR : Opals are a gemstone that dramatically change appearance based on what angle the Opal is viewed at. When an Opal is at it’s brightest, this is called ‘facing’. The direction of color can affect the price becuase it will determine how versatile the Opal is.
PATTERN : Opals that have a rare or unique pattern are more valuable. The Harlequin pattern is the rarest and most loved pattern in opals but it is very rare.
BRIGHTNESS : The Opal brightness guide was produced by the Australian opal association along with the body tone guide.


Researchers unlock the secret of explosive volcanism

The eruption of the Merapi on 11 May 2018. Credit: Université de Strasbourg/Uppsala University/Technical University of Munich/The University of Leeds/Universitas Gadjah Mada/German Research Center for Geosciences

When will the next eruption take place? Examination of samples from Indonesia’s Mount Merapi show that the explosivity of stratovolcanoes rises when mineral-rich gases seal the pores and microcracks in the uppermost layers of stone. These findings result in new possibilities for the prediction of an eruption.

Mount Merapi on Java is among the most dangerous volcanoes in the world. Geoscientists have usually used seismic measurements which illustrate underground movements when warning the population of a coming eruption in time.

An international team including scientists from the Technical University of Munich (TUM) has now found another indication for an upcoming eruption in the lava from the peak of Mount Merapi: The uppermost layer of stone, the “plug dome,” becomes impermeable for underground gases before the volcano erupts.

“Our investigations show that the physical properties of the plug dome change over time,” says Prof. H. Albert Gilg from the TUM Professorship for Engineering Geology . “Following an eruption the lava is still easily permeable, but this permeability then sinks over time. Gases are trapped, pressure rises and finally the plug dome bursts in a violent explosion.”

Mount Merapi as a model volcano

Using six lava samples, one from an eruption of Mount Merapi in 2006, the others from the 1902 eruption — the researchers were able to ascertain alterations in the stone. Investigation of pore volumes, densities, mineral composition and structure revealed that permeability dropped by four orders of magnitude as stone alteration increased. The cause is newly formed minerals, in particular potassium and sodium aluminum sulfates which seal the fine cracks and pores in the lava.

The cycle of destruction

Computer simulations confirmed that the reduced permeability of the plug dome was actually responsible for the next eruption. The models show that a stratovolcano like Mount Merapi undergoes three phases: First, after an eruption when the lava is still permeable, outgassing is possible; in the second phase the plug dome becomes impermeable for gases, while at the same time the internal pressure continuously increases; in the third phase the pressure bursts the plug dome.

Photographs of Mount Merapi from the period before and during the eruption of May 11, 2018 support the three-phase model: The volcano first emitted smoke, then seemed to be quiet for a long time until the gas found an escape and shot a fountain of ashes kilometers up into the sky.

“The research results can now be used to more reliably predict eruptions,” says Gilg. “A measurable reduction in outgassing is thus an indication of an imminent eruption.”

Mount Merapi is not the only volcano where outgassing measurements can help in the timely prediction of a pending eruption. Stratovolcanoes are a frequent source of destruction throughout the Pacific. The most famous examples are Mount Pinatubo in the Philippines, Mount St. Helens in the western USA and Mount Fuji in Japan.

Reference:
Michael J. Heap, Valentin R. Troll, Alexandra R. L. Kushnir, H. Albert Gilg, Amy S. D. Collinson, Frances M. Deegan, Herlan Darmawan, Nadhirah Seraphine, Juergen Neuberg, Thomas R. Walter. Hydrothermal alteration of andesitic lava domes can lead to explosive volcanic behaviour. Nature Communications, 2019; 10 (1) DOI: 10.1038/s41467-019-13102-8

Note: The above post is reprinted from materials provided by Technical University of Munich (TUM).

Evidence of two quakes extends rupture history in Grand Tetons National Park

The excavation of trench B at the Leigh Lake site. Shown in the photo (from left to right) are Glenn Thackray, Cooper Brossy, and Darren Zellman. Credit: Mark Zellman

Hand-dug trenches around Leigh Lake in Grand Teton National Park in Wyoming reveal evidence for a previously unknown surface-faulting earthquake in along the Teton Fault—one occurring about 10,000 years ago.

Together with evidence from the site of a second earthquake that ruptured around 5,900 years ago, the findings published in the Bulletin of the Seismological Society of America extend the history of Teton Fault earthquakes and may offer some clues as to how segments of the fault have ruptured together in the past, the study authors suggest.

The Teton Fault is one of the fastest-moving normal faults in the western United States, separating the eastern edge of the Teton Range from the Jackson Hole basin. The fault is divided into southern, central and northern segments, with the Leigh Lake site falling within the central segment. A previous study identified two Teton Fault earthquakes that occurred 8,000 years ago and 4,700 to 7,900 years ago on the southern segment at Granite Canyon, one of the most famous hiking spots in the Grand Teton National Park.

The younger earthquake at Leigh Lake may be the same rupture as the youngest Granite Canyon earthquake, confirming that there were at least three earthquakes in Holocene times, and that the most recent activity along the fault occurred about 6,000 years ago, said Mark Zellman of BGC Engineering, Inc., the lead author of the BSSA study.

Although the Leigh Lake study doesn’t provide a definite answer to the question of whether multiple segments of the Teton fault have ruptured at once, Zellman said the findings “do give us a clue that multi-section ruptures are possible. The overlap in age between the youngest Leigh Lake earthquake and the youngest Granite Canyon earthquake “leaves open the possibility that at least the southern and central section of the Teton fault ruptured together during the most recent event.”

Given the Teton fault’s high rate of movement in the past, it has been a surprisingly long time since its last earthquake, said Zellman. “The seemingly regular and relatively short intervals of time between these three events makes the long period of quiescence on the Teton fault even more surprising,” he said. “I was expecting that we would have found evidence for at least one rupture that post-dates the youngest event known from Granite Canyon.”

Zellman and colleagues chose Leigh Lake as a study site because no other paleoseismic studies had been conducted previously on this central segment of the fault, and because the site offered several small and easy to reach scarps for shovel excavations. The researchers excavated at two of three scarps that represent the fault’s movement in postglacial times.

The remoteness of the site and its location within a national park prevented the researchers from using heavy equipment to dig and backfill their shallow trenches. In the future, Zellman said, “it would be nice to identify a location or two where we could excavate a deeper trench to expose a longer record.”

Asked about the older event at Granite Canyon that was not found at Leigh Lake, Zellman said “evidence for that earthquake might be preserved in the third scarp. But we won’t know for sure until we excavate that scarp.”

The researchers examined the coarse exposed sediments in the trenches for signs of past faulting, in some places analyzing the orientation of large rocks clasts within the trench walls to reveal the fault’s presence. The faults were dated using radiocarbon and optically stimulated luminescence methods.

Based on the length of the fault ruptures, Zellman and colleagues estimate the 10,000-year old earthquake may have been a magnitude 6.6 to 7.2 quake, while the 5,900-year old earthquake may have been magnitude 7.0 to 7.2.

Zellman said other studies of sites along the fault’s northern segment, combined with data from studies that look at landslides and other signs of paleoseismic activity contained in deep lake sediments from the region, will help further fill in the history of the Teton Fault.

Reference:
Bulletin of the Seismological Society of America (2019). dx.doi.org/10.1785/0120190129 , pubs.geoscienceworld.org/ssa/b … of-the-Central-Teton

Note: The above post is reprinted from materials provided by Seismological Society of America.

Rare gas find solves African landscape puzzle

Researchers doing fieldwork in KwaZulu-Natal, South Africa. Credit: Stuart Gilfillan

The discovery of gases released from deep beneath the Earth’s crust could help to explain Southern Africa’s unusual landscape, a study suggests.

Scientists have long puzzled over why areas such as South Africa’s Highveld region are so elevated and flat, with unexpectedly hot rocks below the surface.

Geologists have revealed that carbon dioxide-rich gases bubbling up through natural springs in South Africa originate from a column of hot, treacle-like material — called a hotspot — located deep inside the Earth.

Hotspots are known to generate volcanic activity in Hawaii, Iceland and Yellowstone National Park. In South Africa, the hotspot pushes the crust upwards, generating the distinctive landscape, which consists mostly of tablelands more than one kilometre above sea level, the researchers say.

This also explains why rocks beneath the region are hotter than expected — a property that could be harnessed to generate geothermal energy.

A team led by scientists from the University of Edinburgh analysed the chemical make-up of gas emerging from a deep crack in the Earth’s crust located in KwaZulu-Natal, South Africa.

They found that variants of the elements helium and neon present in the gas match the composition of a rocky layer 1,000 kilometres below Earth’s surface — called the deep mantle.

The findings provide the first physical evidence that Southern Africa lies on top of a plume of abnormally hot mantle, which had until now only been theorised using computer modelling of seismic data.

The study, published in the journal Nature Communications, was funded by the Engineering and Physical Sciences Research Council and the Natural Environment Research Council.

The research was completed with support from Scottish Carbon Capture and Storage and the UK Carbon Capture and Storage Research Centre. It also involved scientists from the Universities of Aberdeen and Strathclyde, Scottish Universities Environmental Research Centre, British Geological Survey and South Africa Council for Geoscience.

Dr Stuart Gilfillan, of the University of Edinburgh’s School of GeoSciences, who led the study, said: “The high relief and hotter than expected subsurface temperatures of the rocks beneath Southern Africa had been a puzzle for geologists for many years. Our findings confirm that carbon dioxide gas at the surface is from a deep mantle plume, helping to explain the regions unusual landscape.”

Reference:
S. M. V. Gilfillan, D. Györe, S. Flude, G. Johnson, C. E. Bond, N. Hicks, R. Lister, D. G. Jones, Y. Kremer, R. S. Haszeldine, F. M. Stuart. Noble gases confirm plume-related mantle degassing beneath Southern Africa. Nature Communications, 2019; 10 (1) DOI: 10.1038/s41467-019-12944-6

Note: The above post is reprinted from materials provided by University of Edinburgh.

Oman tsunami : Huge tsunami hit Oman 1,000 years ago

Klaus Reicherter from the University of Aachen examines a boulder that the tsunami carried onto the cliffs. Credit: Gösta Hoffmann/Uni Bonn

15-meter high waves that pushed boulders the weight of a Leopard tank inland: This is more or less how one can imagine the tsunami that hit the coast of today’s Sultanate of Oman about 1,000 years ago, as concluded by a recent study by the universities of Bonn, Jena, Freiburg and RWTH Aachen. The findings also show how urgently the region needs a well-functioning early warning system. But even then, coastal residents would have a maximum of 30 minutes to get to safety in a similar catastrophe. The study will be published in the journal “Marine Geology,” but is already available online.

Oman lies in the east of the Arabian Peninsula. The coasts of the Sultanate are repeatedly struck by tsunamis, most recently in 2013. Even with the most severe of these in recent times, the Makran event in 1945, the damage remained comparatively low. Back then, the tidal wave reached a height of three meters.

The scientists have now discovered evidence of a tsunami which is likely to have been much more powerful, with waves of up to 15 meters. For this purpose, the researchers from Bonn, Jena and Aachen concentrated their terrain investigations on a 200-kilometer coastal strip in northeastern Oman. “There we identified 41 large boulders, which were apparently carried inland by the force of the water,” explains Dr. Gösta Hoffmann from the Institute for Geosciences at the University of Bonn.

Quartz clock in the rock

Some of the boulders were probably formed when the tsunami shattered parts of the cliffs; for one of them, the largest weighing around 100 metric tons, scientists were even able to determine the exact point at which it broke off. Others show traces of marine organisms such as mussels or oysters that cannot survive on land. “Certain methods can be used to determine their time of death,” says the geologist Gösta Hoffmann. “This allowed us to establish when the boulders were washed ashore.”

The quartz crystals in the rock also represent a kind of clock: They provide information about the last time they were exposed to the sun. This allowed the scientists to deduce how long the rocks had been in the place where they were found. The scientists from Freiburg are specialists in this method. “Many of these measurements gave us a value of about 1,000 years,” emphasizes Hoffmann. “This corresponds well with the dating results of clay fragments we found in tsunami sediments. They originate from vessels used by coastal dwellers.”

The Arabian and Eurasian tectonic plates collide in the Arabian Sea. They move towards each other at a speed of about four centimeters per year. During this process, one plate slides beneath the other. Sometimes they get stuck in this subduction zone. This can cause tensions that intensify more and more over years and decades. If they suddenly come loose with a violent jolt, the water column above the plates starts to move. This can lead to the extremely destructive waves that are characteristic of tsunamis.

“So far it has been unclear to what extent the Arabian and Eurasian plates get stuck,” says Hoffmann. At the Makran event of 1945, for example, the effects were locally confined. The current findings, however, suggest that the tensions can also build up and unload on a very large scale — there is no other feasible explanation for the enormous forces at work at the time. “It is therefore extremely important that a tsunami early warning system is put in place for this region,” stresses the geologist.

Nevertheless, even a smaller tsunami would have devastating consequences today: A large part of the vital infrastructure in the Sultanate of Oman has been built near the coast, such as the oil refineries and seawater desalination plants. A well-functioning warning system can, however, at least give residents some time to get to safety. Not very much though: Tsunamis move at the speed of a passenger aircraft; in the best case, the time between the alarm and the wave’s impact would therefore be little more than 30 minutes.

Reference:
Gösta Hoffmann, Christoph Grützner, Bastian Schneider, Frank Preusser, Klaus Reicherter. Large Holocene tsunamis in the northern Arabian Sea. Marine Geology, 2019; 106068 DOI: 10.1016/j.margeo.2019.106068

Note: The above post is reprinted from materials provided by University of Bonn.

Huge trove of mammoth skeletons found in Mexico

Mammoth bones are pictured in Tultepec, Mexico in this handout photograph released by Mexico's National Institute of Anthropology (INAH)
Mammoth bones are pictured in Tultepec, Mexico in this handout photograph released by Mexico’s National Institute of Anthropology (INAH)

Archaeologists said Wednesday they have made the largest-ever discovery of mammoth remains: a trove of 800 bones from at least 14 of the extinct giants found in central Mexico.

Moreover, they believe they have made the first-ever find of a mammoth trap set by humans, who would have used it to capture the huge herbivores more than 14,000 years ago, said Mexico’s National Institute of Anthropology and History (INAH).

“This is the largest find of its kind ever made,” the institute said in a statement.

The skeletal remains were found in Tultepec, near the site where President Andres Manuel Lopez Obrador’s government is building a new airport for Mexico City.

Some bore signs that the animals had been hunted, leading experts to conclude that they had found “the world’s first mammoth trap,” it said.

“Mammoths lived here for thousands of years. The herds grew, reproduced, died, were hunted… They lived alongside other species, including horses and camels,” archaeologist Luis Cordoba told journalists.

Researchers said at least five mammoth herds lived in the area of the find.

Mexico has been the scene of surprising mammoth discoveries before.

In the 1970s, workers building the Mexico City subway found a mammoth skeleton while digging on the capital’s north side.

Note: The above post is reprinted from materials provided by AFP .

Related Articles