Starting at the eastern foot of the Rocky Mountains in the midwest United States, the dramatic landscape of the High Plains stretches across several US states. Dropping just a few hundred meters over a length of more than 500 kilometres, these plains have only a very gentle gradient and the nearly flat surfaces exhibit unique ecosystems, making them a geological and ecological anomaly.
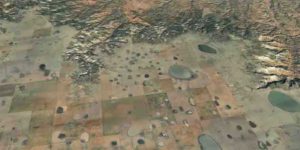
In the High Plains there are hundreds of thousands of small ephemeral lakes known as playas, that are filled with rainwater only during wet seasons, drying out completely during dry periods. The lakes provide an important breeding, resting and wintering habitat for millions of birds and also supply recharge to the groundwater reservoir known as the Ogallala aquifer. At 450,000 square kilometres, it is the largest aquifer in North America. Without these groundwater resources, agriculture in this dry region would be nearly impossible.
By no means a geological bore
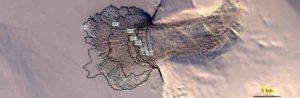
Geologists have given little attention to the High Plains in recent times. “For alpine geologists used to working in high mountains, the region is too flat and considered uninteresting,” says Sean Willett, a professor of geology at ETH Zurich, with a chuckle. It was by chance that he and his two colleagues from the University of Nevada developed an interest in the region when they noticed “peculiar patterns of streams” crossing the High Plains. They have now published their reconstruction of the region’s unusual geological history in “Nature.”
The High Plains were formed 20 million years ago. Earth scientists have recently discovered a zone of unusually hot material in the Earth’s mantle that creates a wave of uplift that is slowly shifting from west to east under the continental plate. This wave first uplifted the Colorado Plateau, then the Rockies and finally the plains themselves. This resulted in a steeper gradient of the mountains towards the plains, accelerating erosion. For 15 million years, a massive flow of sediment poured out of the mountains, down the river valleys and into the plains.
Sediment transported by the rivers was deposited to form huge alluvial fans at the foot of the mountains. Gravel and coarse sand completely filled river valleys and all older topography, effectively repaving the landscape to form the gentle slopes of the modern high plains.
Lakes with limestone sealant
Because alluvial fans only have a very low gradient, rivers flowing down its surface lack erosive power. The surface of these plains sealed with sand, mud and clay, thus making it possible for rain water to remain in sinks to form lakes. Chemical processes eventually led to a calcification of the lakebeds and soils, forming limestone layers up to 10 meters thick. Finally, as it aged, cracks formed in the limestone, allowing water to seep through and feed a groundwater reservoir of vast area and volume, hosted in the gravels shed from the mountains.
The flow of sediment finally stopped around three to five million years ago. Since then, the High Plains’ surfaces have changed very little (with the exception of human impact). “They are a preserved ancient landscape,” says Willett.
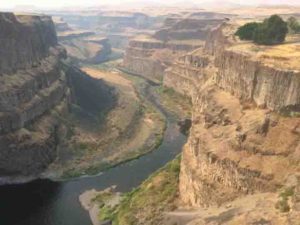
Rivers flowing from the Rocky Mountains did, however, seek out new paths and carved deeper into the subsurface along the edges of the prehistoric alluvial fans. This inexorable process is still underway: the rivers continue to erode the alluvial fans, which is evident in the formation of escarpments and badlands with dendritic patterns of streams and rivers cutting into the plateaus of the High Plains. “What we are seeing today is a landscape in transition,” the ETH professor points out. “It will take five or ten million years until the High Plains have completely eroded.”
An unstoppable disintegration of the alluvial fans
Willet does not see any immediate threat to the groundwater supply. However, people should be aware that the forces breaking down the High Plains are responsible for where groundwater is found today and where agriculture is possible.
There is nowhere else in the world quite like the High Plains. There are, of course, gigantic alluvial plains in South America as well, and in the part of the Himalayas located in India. “But the High Plains have been inactive for nearly five million years, whereas the other large alluvial fans are still in the process of formation,” says the researcher.
Reference:
Sean D. Willett, Scott W. McCoy, Helen W. Beeson. Transience of the North American High Plains landscape and its impact on surface water. Nature, 2018; 561 (7724): 528 DOI: 10.1038/s41586-018-0532-1
Note: The above post is reprinted from materials provided by ETH Zurich.