Artist’s impression of Magyarosuchus fitosi. Credit: Marton Szabo
A 180-million-year-old fossil has shed light on how some ancient crocodiles evolved into dolphin-like animals.
The specimen — featuring a large portion of backbone — represents a missing link in the family tree of crocodiles, and was one of the largest coastal predators of the Jurassic Period, researchers say.
The newly discovered species was nearly five metres long and had large, pointed teeth for grasping prey. It also shared key body features seen in two distinct families of prehistoric crocodiles, the team says.
Some Jurassic-era crocodiles had bony armour on their backs and bellies, and limbs adapted for walking on land. Another group had tail fins and flippers but did not have armour.
The new species was heavily armoured but also had a tail fin, suggesting it is a missing link between the two groups, researchers say.
It has been named Magyarosuchus fitosi in honour of the amateur collector who discovered it, Attila Fitos.
The fossil — unearthed on a mountain range in north-west Hungary in 1996 and stored in a museum in Budapest — was examined by a team of palaeontologists, including a researcher from the University of Edinburgh.
It was identified as a new species based on the discovery of an odd-looking vertebra that formed part of its tail fin.
The study, published in the journal PeerJ, also involved researchers in Hungary and Germany. It was supported by the Leverhulme Trust and the SYNTHESYS project, part of the European Commission’s Seventh Framework Programme.
Dr Mark Young, of the University of Edinburgh’s School of GeoSciences, who was involved in the study, said: “This fossil provides a unique insight into how crocodiles began evolving into dolphin and killer whale-like forms more than 180 million years ago. The presence of both bony armour and a tail fin highlights the remarkable diversity of Jurassic-era crocodiles.”
Reference:
Attila Ősi, Mark T. Young, András Galácz, Márton Rabi. A new large-bodied thalattosuchian crocodyliform from the Lower Jurassic (Toarcian) of Hungary, with further evidence of the mosaic acquisition of marine adaptations in Metriorhynchoidea. PeerJ, 2018; 6: e4668 DOI: 10.7717/peerj.4668
A rendition of what the Hyneria lindae might have looked like. Credit: Jason Poole of the Academy of Natural Sciences of Drexel University.
After 25 years of collecting fossils at a Pennsylvania site, scientists at the Academy of Natural Sciences of Drexel University now have a much better picture of an ancient, extinct 12-foot fish and the world in which it lived.
Although Hyneria lindae was initially described in 1968, it was done without a lot of fossil material to go on. But since the mid-1990s, dedicated volunteers, students, and paleontologists digging at the Red Hill site in northern Pennsylvania’s Clinton County have turned up more — and better quality — fossils of the fish’s skeleton that have led to new insights.
Academy researchers Ted Daeschler, PhD, and Jason Downs, PhD, who specialize in the Devonian time period (a time before dinosaurs and even land animals) when Hyneria lived, have been able to reconstruct that the predator had a blunt, wide snout, reached 10-12 feet in length, had small eyes and featured a sensory system that allowed it to hunt prey by feeling pressure waves around it.
“Dr. Keith Thomson, the man who first described Hyneria in 1968, did not have enough fossil material to reconstruct the anatomy that we have now been able to document with more extensive collections,” explained Daeschler, curator of Vertebrate Zoology at the Academy, as well as a professor in Drexel’s College of Arts and Sciences.
Originally, pieces of the fish were collected in the 1950s. Thomson described and officially named Hyneria lindae in 1968, but he had just a few pieces of a crushed skull and some scales to work with.
The new discoveries that Daeschler and Downs (who is an assistant professor at Delaware Valley University) wrote about in the Journal of Vertebrate Paleontology were made possible by years of collecting that turned up, “well-preserved, well-prepared three-dimensional material of almost all of the [bony] parts of the skeleton,” according to Downs.
No single complete skeleton exists of this giant, but enough is there to show that Hyneria would have truly been a monster to the other animals in the subtropical streams of the Devonian Period, roughly 365 million years ago. An apex predator, Hyneria’s mouth was bristling with two-inch fangs. For reference, that’s bigger than most modern Great White Shark’s teeth.
Due to its sheer size, weaponry, and sensory abilities, Hyneria may have preyed upon anything from ancient placoderms (armored fish), to acanthodians (related to sharks) and sarcopterygians (lobe-finned fish, the group Hyneria belongs to) — including early tetrapods (limbed vertebrates) that are also found at the site.
Since the streams Hyneria lived in were likely murky and not conducive to hunting by eyesight, sensory canals allowed it to detect fish swimming near it and attack them.
“We discovered that the skull roof elements have openings on their surfaces that connect up, forming a network of tubes that would function like the sensory line system in some modern aquatic vertebrates,” Daeschler said. “Similarly, we found a network of connected pores on the parts of the scales that would be exposed on the body of Hyneria.”
All of the new information gleaned about Hyneria is doubly valuable because it provides more information about the ecosystem — and time period — it lived in. The Devonian was a pivotal time in vertebrate evolution, especially since some of Hyneria’s fellow lobe-finned fish developed specialized fins that would take them onto land and eventually give rise to all limbed verterbates including reptiles, amphibians and mammals.
“Hyneria lived in a time and place that is of incredible interest to those of us studying the vertebrate fin-to-limb transition,” Downs commented. “Each study like this one contributes more to our understanding of these ecosystems and what may have played a part in the successful transition to land.”
Reference:
Edward B. Daeschler, Jason P. Downs. New description and diagnosis of Hyneria lindae (Sarcopterygii, Tristichopteridae) from the Upper Devonian Catskill Formation in Pennsylvania, U.S.A.. Journal of Vertebrate Paleontology, 2018; e1448834 DOI: 10.1080/02724634.2018.1448834
Note: The above post is reprinted from materials provided by Drexel University. Original written by Frank Otto.
Fossil reconstruction and illustration of Ichthyornis dispar. Credit: Michael Hanson/Yale University
Researchers have pieced together the three-dimensional skull of an iconic, toothed bird that represents a pivotal moment in the transition from dinosaurs to modern-day birds.
Ichthyornis dispar holds a key position in the evolutionary trail that leads from dinosaurian species to today’s avians. It lived nearly 100 million years ago in North America, looked something like a toothy seabird, and drew the attention of such famous naturalists as Yale’s O.C. Marsh (who first named and described it) and Charles Darwin.
Yet despite the existence of partial specimens of Ichthyornis dispar, there has been no significant new skull material beyond the fragmentary remains first found in the 1870s. Now, a Yale-led team reports on new specimens with three-dimensional cranial remains — including one example of a complete skull and two previously overlooked cranial elements that were part of the original specimen at Yale — that reveal new details about one of the most striking transformations in evolutionary history.
“Right under our noses this whole time was an amazing, transitional bird,” said Yale paleontologist Bhart-Anjan Bhullar, principal investigator of a study published in the journal Nature. “It has a modern-looking brain along with a remarkably dinosaurian jaw muscle configuration.”
Perhaps most interesting of all, Bhullar said, is that Ichthyornis dispar shows us what the bird beak looked like as it first appeared in nature.
“The first beak was a horn-covered pincer tip at the end of the jaw,” said Bhullar, who is an assistant professor and assistant curator in geology and geophysics. “The remainder of the jaw was filled with teeth. At its origin, the beak was a precision grasping mechanism that served as a surrogate hand as the hands transformed into wings.”
The research team conducted its analysis using CT-scan technology, combined with specimens from the Yale Peabody Museum of Natural History; the Sternberg Museum of Natural History in Fort Hays, Kan.; the Alabama Museum of Natural History; the University of Kansas Biodiversity Institute; and the Black Hills Institute of Geological Research.
Co-lead authors of the new study are Daniel Field of the Milner Centre for Evolution at the University of Bath and Michael Hanson of Yale. Co-authors are David Burnham of the University of Kansas, Laura Wilson and Kristopher Super of Fort Hays State University, Dana Ehret of the Alabama Museum of Natural History, and Jun Ebersole of the McWane Science Center.
“The fossil record provides our only direct evidence of the evolutionary transformations that have given rise to modern forms,” said Field. “This extraordinary new specimen reveals the surprisingly late retention of dinosaur-like features in the skull of Ichthyornis — one of the closest-known relatives of modern birds from the Age of Reptiles.”
The researchers said their findings offer new insight into how modern birds’ skulls eventually formed. Along with its transitional beak, Ichthyornis dispar had a brain similar to modern birds but a temporal region of the skull that was strikingly like that of a dinosaur — indicating that during the evolution of birds, the brain transformed first while the remainder of the skull remained more primitive and dinosaur-like.
“Ichthyornis would have looked very similar to today’s seabirds, probably very much like a gull or tern,” said Hanson. “The teeth probably would not have been visible unless the mouth was open but covered with some sort of lip-like, extra-oral tissue.”
In recent years Bhullar’s lab has produced a large body of research on various aspects of vertebrate skulls, often zeroing in on the origins of the avian beak. “Each new discovery has reinforced our previous conclusions. The skull of Ichthyornis even substantiates our molecular finding that the beak and palate are patterned by the same genes,” Bhullar said. “The story of the evolution of birds, the most species-rich group of vertebrates on land, is one of the most important in all of history. It is, after all, still the age of dinosaurs.”
Reference:
Daniel J. Field, Michael Hanson, David Burnham, Laura E. Wilson, Kristopher Super, Dana Ehret, Jun A. Ebersole, Bhart-Anjan S. Bhullar. Complete Ichthyornis skull illuminates mosaic assembly of the avian head. Nature, 2018; 557 (7703): 96 DOI: 10.1038/s41586-018-0053-y
Note: The above post is reprinted from materials provided by Yale University.
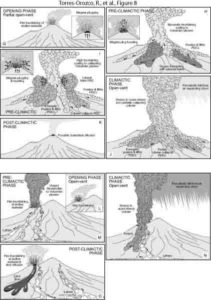
Volcanic hazard scenarios for Plinian eruptions at Mount Taranaki’s summit crater and Fanthams Peak vent. A-F: Scenario I. Close-conduits and conduit decompression by vent unroofing and dome collapse. G-K: Scenario II. Transient open and clogged conduits by repeated plugging-and-bursting of gas-depleted or chilled magma. L-O: Scenario III. Rapid progression into steady phases by open conduits. P: Possible upper conduit dynamics for each scenario based on data and interpretations of Torres-Orozco et al. (2017a, 2017b). Credit: R. Torres-Orozco et al., GSA Bulletin, 2018.
Over the last 5000 years, Mount Taranaki volcano, located in the westernmost part of New Zealand’s North Island, produced at least 16 Plinian-scale explosive eruptions, the latest at AD 1655. These eruptions had magnitudes of 4 to 5, eruptive styles, and contrasting basaltic to andesitic chemical compositions comparable to the eruptions of Etna, 122 BC; Vesuvius, AD79; Tarawera, 1886; Pelée, 1902; Colima, 1910; Mount Saint Helens, 1980; Merapi, 2010; and Calbuco, 2015.
In this work, Rafael Torres-Orozco and colleagues combined geological mapping and lithostratigraphic analyses to define the possible hazard scenarios in case of Taranaki’s explosive reawakening.
The results indicate that, during a future Plinian event, bursting of both long-lasting, large-volume lava domes and transient, small-volume lava plugs from Taranaki’s andesitic summit crater would be typical, and these would produce different types of pyroclastic density currents (PDCs) flowing down the volcano flanks mainly due to gravity.
The most deadly “blast-type” PDCs would first explode and expand laterally, and then would flow downstream, reaching urban areas located at up to 18 km distance from the crater. Eruptive columns following or accompanying PDCs are ubiquitous to every scenario. These columns would inject ash and gas into the atmosphere, and could disperse 10-cm-thick layers of volcanic material over the most populated areas at 20-30 km from the crater. In the scenario of eruptions produced from vents different to the summit-crater, these would be expected to be basaltic and lack major PDCs.
These scenarios highlight the major role that PDCs must have in evaluating the hazardscape of Taranaki and of other similar volcanoes. The scenarios can be tailored to different sites around the world by localized studies, and can also be used to plan emergency management.
Reference:
Torres-Orozco et al. Volcanic hazard scenarios for multi-phase andesitic Plinian eruptions from lithostratigraphy: Insights into PDC diversity at Mount Taranaki, New Zealand. GSA Bulletin, 2018 DOI: 10.1130/G31850.1
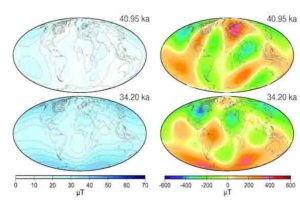
Intensity at Earth’s surface (left) and radial field (Br) at the CMB (right). Top: mid-point of the Laschamp excursion; bottom: mid-point of the Mono Lake excursion. The field is truncated at spherical harmonic degree five. Credit: University of Liverpool
A study of the most recent near-reversals of the Earth’s magnetic field by an international team of researchers, including the University of Liverpool, has found it is unlikely that such an event will take place anytime soon.
There has been speculation that the Earth’s geomagnetic fields may be about to reverse , with substantial implications, due to a weakening of the magnetic field over at least the last two hundred years, combined with the expansion of an identified weak area in the Earth’s magnetic field called the South Atlantic Anomaly, which stretches from Chile to Zimbabwe.
In a paper published in the Proceedings of the National Academy of Sciences, a team of international researchers model observations of the geomagnetic field of the two most recent geomagnetic excursion events, the Laschamp, approximately 41,000 years ago, and Mono Lake, around 34,000 years ago, where the field came close to reversing but recovered its original structure.
The model reveals a field structures comparable to the current geomagnetic field at both approximately 49,000 and 46,000 years ago, with an intensity structure similar to, but much stronger than, today’s South Atlantic Anomaly (SAA); their timing and severity is confirmed by records of cosmogenic nuclides. However, neither of these SAA-like fields developed into an excursion or reversal.
Richard Holme, Professor of Geomagnetism at the University of Liverpool, said: “There has been speculation that we are about to experience a magnetic polar reversal or excursion. However, by studying the two most recent excursion events, we show that neither bear resemblance to current changes in the geomagnetic field and therefore it is probably unlikely that such an event is about to happen.
“Our research suggests instead that the current weakened field will recover without such an extreme event, and therefore is unlikely to reverse.”
The strength and structure of the Earth’s magnetic field has varied at different times throughout geological history. At certain periods, the geomagnetic field has weakened to such an extent that it was able to swap the positions of magnetic north and magnetic south, whilst geographic north and geographic south remain the same.
Called a geomagnetic reversal, the last time this happened was 780,000 years ago. However, geomagnetic excursions, where the field comes close to reversing but recovers its original structure, have occurred more recently.
The magnetic field shields the Earth from solar winds and harmful cosmic radiation. It also aids in human navigation, animal migrations and protects telecommunication and satellite systems. It is generated deep within the Earth in a fluid outer core of iron, nickel and other metals that creates electric currents, which in turn produce magnetic fields.
Reference:
Maxwell Brown, Monika Korte, Richard Holme, Ingo Wardinski, Sydney Gunnarson. Earth’s magnetic field is probably not reversing. Proceedings of the National Academy of Sciences, 2018; 201722110 DOI: 10.1073/pnas.1722110115
How “Snowball Earth” might have looked. Credit: NASA
The movie The Day After Tomorrow depicts a catastrophic climate shift to global cooling, which is referred to as the new ice age. In the movie, melting of polar ice caused by global warming disrupts the North Atlantic current, rapidly dropping the ocean temperature, ultimately leading to the freezing of the ocean on a global scale. Although this over-the-top effect portrayed by this fictional film contains little scientific truth, many scientists are studying a global ice age during the Cryogenian, a geologic period that lasted from 720 to 635 million years ago.
Recent research on glacial refugia has been heating up the debate about this ice age, brewing a contention over the extent to which the glaciation covered the Earth. Two main hypotheses are on the table: “Snowball Earth” theory, which argues that ice covered the entire Earth, and “Slushball Earth” hypothesis, where the band of the sea near the equator stayed open, allowing the hydrologic cycle—the evaporation and precipitation of water— to persist.
The term Snowball Earth was first coined by Joe Kirschvink, a geobiologist at CalTech in the late 1980s. The theory was based on the early observation that glacial deposits from this time were widely distributed on nearly every continent, with some geologic evidence even suggesting glaciation at tropical latitudes. The abrupt change in the climate is rooted in the positive feedback loop, commonly referred to as the albedo (“whiteness” in Latin) effect. Simply put, as Earth cools and ice forms from the pole down to lower latitudes, the albedo, or the whiteness of the Earth increases, reflecting more solar radiation—just like how a black t-shirt absorbs more heat, while a white t-shirt reflects all wavelengths of light.
Along with the albedo effect, the long-term carbon cycle kicked into high gear, making a double positive feedback. As the ancient supercontinent Rodinia broke apart, the newly created coastline in the low latitude intensified the weathering of the rock. Silicate rock, which constitutes the majority of the Earth’s crust, goes through a chemical weathering reaction that removes CO2 from the atmosphere. As the atmospheric CO2 was reduced, Earth became colder, as CO2, along with other greenhouse gases, blocks heat from escaping the Earth. Moreover, because the broken up continents were in the low latitudes, they could not have prevented the advance of ice that formed in the poles, the coldest region on Earth, which would have created a completely frozen planet.
The critics of the Snowball Earth theory—including professor Richard Peltier and his fellow colleagues at the University of Toronto and Texas A&M—published a paper refuting the hypothesis, in which they run a series of simulations that resulted in an equatorial belt of open water that may explain the survival of the organisms during the ice age, as well as the subsequent revival of numerous species.
Their argument stems from the fact that the process of glaciation not only entailed positive feedback, but also one important negative feedback. As the climate got colder, the atmospheric oxygen would have sunk deeper into the ocean. As atmospheric oxygen spread deep into the sea, it bonded with the layer of old organic matter, forming CO2. Carbon dioxide, released back into the atmosphere, would have warmed the Earth by the greenhouse effect, which would have defrosted Earth, stopping the ice sheets and glaciers from further advancing. Therefore, such negative feedback could have prevented ice from completely covering the Earth surface.
Peltier provides another key piece of evidence against Snowball Earth theory: a geographic region that allowed the survival of fauna and flora, referred to as the “glacial refugia.” Had the Earth completely frosted itself, its harsh climate would have killed off many organisms. Moreover, complete reflection of solar radiation would have decimated photosynthetic organisms. Yet, there is no such geological indication that a mass extinction event occurred.
The debate of hard versus slushy Snowball Earth becomes more enigmatic at the end of the Cryogenic period and start of Cambrian, when the so-called “Cambrian explosion” of animal life occurs. The Cambrian explosion refers to a short interval during which many multicellular animals in diverse forms appeared on the surface of the Earth. Critics of Snowball Earth argue that such a dramatic increase in biodiversity within a short period of time would not have been able to happen in a hard Snowball Earth scenario, as many organisms prior to the explosion would have gone extinct. The supporters of Snowball Earth, on the other hand, argue that the biodiversity is simply the result of the robust micro-organisms that survived the Snowball Earth, evolving in size as well as anatomical complexity through time.
Neither of these hypotheses is set in stone, but rather are part of an ongoing debate that requires much clarification. To better understand what happened during the Cryogenian period, developing different climate models with many parameters is necessary, giving flexibility to the ever-unknown complexity of past climate conditions. Moreover, careful study of the organisms that survived Snowball Earth could further assist our understanding of this enigmatic period.
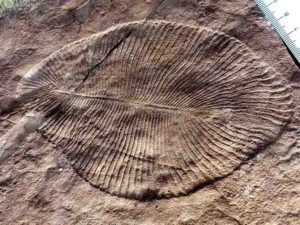
A Dickinsonia fossil animal of the Ediacaran era. Credit: Verisimilus (CC BY 3.0)
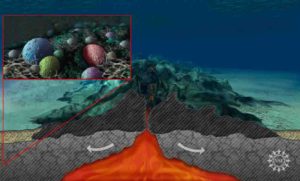
Some of the earliest animals on Earth were soft-bodied ocean-dwellers that ranged from a few inches to several feet and were shaped like circular discs, tubes, or cushion-like bags.
While fossil impressions from the Ediacaran Era — 635 to 541 million years ago — reveal their existence, little is known about this fascinating group of animal-like creatures, which preceded more complex animals with skeletons.
In a paper published Friday, May 4, in Nature Communications, researchers at the University of California, Riverside, used biomarkers in ancient rocks to learn more about the environmental conditions and food sources that sustained this group of animals, called the Ediacara Biota. Led by Gordon Love, a professor of biogeochemistry at UCR, the team studied molecular fossils, known as lipid biomarkers, made by the ancient biological communities and preserved within sedimentary rocks that contain early animal fossils. The communities they studied lived off the coast of the ancient continent Baltica — encompassing modern day Russia, Ukraine and the Baltic States — between 560 to 540 million years ago.
Love said the Ediacara Biota lived in nutrient-poor regions of the sea on the continental shelf, an extension of land under the ocean that results in relatively shallow water. Despite this oligotrophic environment, the researchers found there were sufficient nutrients and organic debris for feeding sustained by bacterial primary production and dissolved organic matter.
The team also observed a dearth of sponge biomarkers, suggesting possible niche competition between the Ediacara Biota and sponges in different marine settings.
“Different environmental conditions and nutritional resources could have selected for very different community structures in different regions of the Ediacaran oceans,” Love said.
Reference:
Kelden Pehr, Gordon D. Love, Anton Kuznetsov, Victor Podkovyrov, Christopher K. Junium, Leonid Shumlyanskyy, Tetyana Sokur, Andrey Bekker. Ediacara biota flourished in oligotrophic and bacterially dominated marine environments across Baltica. Nature Communications, 2018; 9 (1) DOI: 10.1038/s41467-018-04195-8
Sakurajima Volcano with Lightning Credit & Copyright: Martin Rietze (Alien Landscapes on Planet Earth)
Concern over the potential imminent eruptions of Earth’s supervolcanoes, like Taupo in New Zealand or Yellowstone in the United States, may be quelled by the results of a new study suggesting that geological signs pointing to a catastrophic eruption would be clear far in advance.
To help forecast supervolcano eruptions, the study led by the University of Illinois has quantified the often-overlooked effects of tectonic stress on the rocks that house these sleeping giants, and suggests that people need not be quick to panic — at least not yet.
In the study, researchers set out to investigate regional-scale tectonic stress and unexpectedly found that their models could help forecast supervolcano eruption timing and inform experts on what to expect, geologically, well before an eruption.
“Traditionally, it is thought that eruptions occur when the pressure caused by hot magma overtakes the strength of a volcano’s roof rock,” said geology professor Patricia Gregg. “But supervolcanoes tend to occur in areas of significant tectonic stress, where plates are moving toward, past or away from each other. That plate motion will affect model calculations.”
Gregg, graduate student Haley Cabaniss and Pomona College geology professor Eric Grosfils published their findings in the journal Geophysical Research Letters.
The team created a model based on the Taupo Volcanic Zone in northern New Zealand. They chose this system because of its relatively uncomplicated extensional tectonic setting — the type of area often associated with supervolcanoes. However, their models found that any tectonic stress would have a profound effect on the stability of supervolcanoes.
“It does not matter if it is extensional, compressional or shear stress,” Cabaniss said. “Any tectonic stress will help destabilize rock and trigger eruptions, just on slightly different timescales. The remarkable thing we found is that the timing seems to depend not only on tectonic stress, but also on whether magma is being actively supplied to the volcano.”
Using their model, the team looked at scenarios with different amounts of stress, tectonic plate movement and magma supply. They found that in any given tectonic setting, the magma reservoirs inside of supervolcanoes appear to remain stable for hundreds to thousands of years while new magma is being actively suppled to the system.
“We were initially surprised by this very short timeframe of hundreds to thousands of years,” Gregg said. “But it is important to realize that supervolcanes can lay dormant for a very long time, sometimes a million years or more. In other words, they may remain stable, doing almost nothing for 999,000 years, then start a period of rejuvenation leading to a large-scale eruption.”
Of course, panic sets in whenever Yellowstone or Taupo experience any change in seismic or geyser activity, but this research suggests that the precursors to catastrophic eruption will be far greater and long-lasting than anything yet documented, the researchers said.
“When new magma starts to rejuvenate a supervolcano system, we can expect to see massive uplift, faulting and earthquake activity,” Gregg said. “Far greater than the meter-scale events we have seen in recent time. We are talking on the range of tens to hundreds of meters of uplift. Even then, our models predict that the system would inflate for hundreds to thousands of years before we witness catastrophic eruption.”
“People need to keep in mind that sites like Yellowstone are very well-monitored,” Cabaniss said. “It is also important to note that our research suggests that the whole rejuvenation-to-eruption process will take place over several or more human lifetimes. Our models indicate that there should be plenty of warning.”
Reference:
Haley E. Cabaniss, Patricia M. Gregg, Eric B. Grosfils. The Role of Tectonic Stress in Triggering Large Silicic Caldera Eruptions. Geophysical Research Letters, 2018; DOI: 10.1029/2018GL077393
Researchers reexamining historical seismograms from the 1906 Meishan earthquake have uncovered a new mechanism for the quake, one of the deadliest to ever strike Taiwan.
The new mechanism provides a better fit for the fault rupture expected from the magnitude 7.1. earthquake, as well as a better fit for the distribution of recorded damage and aftershocks, according to the report in the journal Seismological Research Letters.
The findings will help seismologists improve their understanding of the complex fault systems in this area, “which is important to provide better information for seismic hazard assessment,” said Kuo-Fong Ma of the Earthquake Disaster & Risk Evaluation and Management (E-DREaM) Center in Taiwan.
The result might also encourage others to use historical records in tectonically active countries to “explore the full fault system rather than a single fault segment for seismic hazard evaluation,” she added.
The 1906 Meishan earthquake caused 1258 deaths, 2385 injuries and leveled 6769 houses near its namesake village. Ground shaking has been estimated at a Mercalli intensity of IX or “violent,” meaning that there would have been significant damage to large buildings, including building shifted off their foundations.
Field studies conducted after the earthquake suggested that the earthquake was related an east-west strike-slip rupture on the Meishan Fault. However, there has been a longstanding debate about whether this rupture represents the earthquake’s true origins. The surface rupture was short compared to what might be expected for such an intense quake, for instance, and reports of damage and aftershocks were confined in a north-south pattern, instead of an east-west pattern.
With these inconsistencies in mind, Ma and her colleagues decided to reexamine the historical records of the earthquake. The researchers used the original seismogram recordings from three seismic stations in Taiwan, which were archived at the Earthquake Research Institute of Tokyo University, along with historical literature collected with the help of Taiwan’s Central Weather Bureau.
The researchers used these original records to create new artificial waveform simulations for the earthquake, to evaluate several models of how the fault might have ruptured. They created artificial waveforms from the original seismograms because of the difficulties in accounting for unknown instrument responses and in digitizing the historical records, Ma explained.
The simulated waveform data uncovered a discrepancy between the first motions of P-waves and S-waves (the first and second waves detected by a seismograph in the event of an earthquake) that suggested the earthquake’s mechanism might not have been a pure strike-slip rupture, the researchers said.
The scientists then hunted for an alternative fault motion in the region that could better explain the data. They concluded that the preferred mechanism would be a thrust fault oriented in a northeast-southwest direction, with a small right-lateral component.
Rupture along this type of thrust fault is more consistent with the level of shaking intensity and the pattern of aftershocks seen after the 1906 earthquake, Ma and colleagues said.
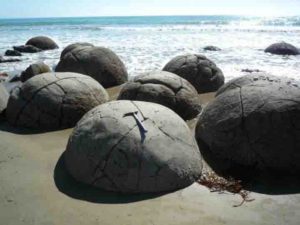
Gigantic concretions formed in mudstone on New Zealand’s Moeraki coast; about 50 million years old. The present research shows that even concretions of this size formed very rapidly, within several decades. Credit: Hidekazu Yoshida
All over the world, spectacular fossils have frequently been found preserved inside solid, roughly spherical rocks called “concretions.” From geologists to casual observers, many have wondered why these hardened masses of carbonate formed around dead organisms, with round shapes and sharp boundaries with the surrounding material, typically in marine mud and mudstone.
Several important questions regarding concretions have long puzzled scientists. What conditions cause them to form? How long do they take to grow? Why do they stop growing? Why are they so distinct from the surrounding rock or sediments?
Now, researchers led by Nagoya University have developed a method to analyze concretions using L-shaped “cross-plot diagrams” of diffusion and growth rate, reported in a new study published in Scientific Reports. With this method, they analyzed dozens of concretions from three sites across Japan and compared them with concretions from England and New Zealand.
The results of this new study dramatically impact understanding of the rate at which concretions form. “Until now, the formation of spherical carbonate concretions was thought to take hundreds of thousands to millions of years,” co-author Koshi Yamamoto says. “However, our results show that concretions grow at a very fast rate over several months to several years.” This rapid sealing mechanism could explain why some concretions contain well-preserved fossils of soft tissues that are rarely fossilized under other conditions.
Study first author Hidekazu Yoshida explains, “The concretions maintained their characteristics, with well-preserved fossils at their centers or textures indicative of the original presence of organic matter. Simple mass balance calculations also demonstrate that the carbon fixed in the carbonate concretions came predominantly from the organs of organisms inside the concretions.”
All of the studied concretions were composed of calcite, with relatively consistent compositions throughout, distinct from the surrounding muddy matrix. Fine-grained, generally clay-rich sediments were found to be important to limit diffusion and permeability, and to slow the migration of solutes. Thus, bicarbonate concentrations would rise high enough at a reaction front to cause rapid precipitation of calcium carbonate, with sharp boundaries from the surrounding mud.
This new unified model for the creation of spherical concretions, which can be generalized by simple formulas, can be applied to interpret concretions from all over the world. In addition to advancing our knowledge of this important preservation mechanism in the fossil record, this improved understanding of the rapid precipitation of calcite due to the presence of organic material may have practical applications in the field of sealing technology.
Reference:
Hidekazu Yoshida, Koshi Yamamoto, Masayo Minami, Nagayoshi Katsuta, Sirono Sin-ichi, Richard Metcalfe. Generalized conditions of spherical carbonate concretion formation around decaying organic matter in early diagenesis. Scientific Reports, 2018; 8 (1) DOI: 10.1038/s41598-018-24205-5
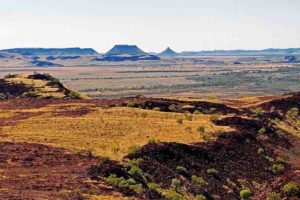
Millstream National Park, Pilbara, Western Australia. Credit: Wikimedia
There is a mystery in Earth’s ancient past, and the clues lie in the desert rocks of Australia and other ancient places.
The last century has seen rapid advances in our understanding of how the Earth formed, and how the movement of continents through plate tectonics continues to shape our lands, oceans and mountain ranges.
But geologists are yet to agree on one important question: what was the Earth like before the plates formed?
New research, published in the journal Geology, supports the theory that early Earth was highly volcanically active, and that evidence of the violent transition to plate tectonics can still be seen today.
“Geology is built upon an idea, uniformitarianism, that we can study geological processes occurring today and use these to understand how the Earth works at timescales of millions of years,” says Dr. Adam Beall, who studied early Earth dynamics during his Ph.D. project at the University of Melbourne.
“This method breaks down when we try to understand the early Earth, because it was hotter and behaved in a completely different way. Geologists have the difficult task of imagining how the Earth’s oldest continents formed by processes we can no longer observe.”
“There are two views,” says Professor Louis Moresi, from the School of Earth Sciences at the University of Melbourne.
“One is that there was no such thing as ‘before plate tectonics.” There was a cloud of dust, you formed the Earth, and as it crystallises out and becomes solid you immediately get some form of plate tectonics.
“And then the other paradigm is that the first billion or so years of Earth were nothing like modern plate tectonics.”
The Earth is constantly being heated from within by radioactivity, and this heat needs to go somewhere. Plate tectonics, sometimes called continental drift, is the planet’s way of releasing this heat.
“With plate tectonics, the whole ocean basin rolls over, which puts the cold outside stuff into the interior and the hot inside stuff on the surface, which is how you get the energy out,” says Professor Moresi.
Scientists agree that early Earth was hotter and more radioactive than it is today. So if there was no plate tectonics, where did all that heat go?
Geologists looked elsewhere in the Solar System for an alternative explanation.
Io, one of Jupiter’s 69 moons, is the most volcanically active place in the Solar System, and Professor Moresi says this could be a model for the ancient Earth.
“On the moon Io, the inside heat turns itself over to the outside volcanically so you just basically have these endless eruptions of volcanoes.”
This theory, which is gaining in popularity, is called the ‘Heat-Pipe Earth”.
Professor Moresi and his colleagues have built an open source computer model of the lithosphere, which covers the Earth’s crust and upper mantle, to a depth of about 200 kilometres, and this was the perfect tool to model the death of the Heat-Pipe Earth.
Dr. Beall, during his Ph.D. work supervised by Professor Moresi and working with Associate Professor Katie Cooper from Washington State University, used this program, called Underworld, to model early Earth’s transition to plate tectonics, focussing on the thin layer of solid rock – called the “Heat-Pipe lid’ – that would have covered most of the Heat-Pipe Earth.
And by doing so they may have solved a second geological mystery—why are there parts of the Earth that are not affected by plate tectonics?
While most of the Earth’s crust has been constantly crushed, melted, uplifted and eroded through the actions of plate tectonics, some regions, called cratons, haven’t changed in billions of years. Examples of these large, mostly flat landforms are found in Western Australia, the Amazon basin, Southern Africa and parts of Canada.
“Plate tectonics creates a massive structure like the Himalayas, but eventually it will just erode away,” says Professor Moresi.
“And yet these cratons just sit there, and they don’t deform very much, and we can still see the original, nearly four-billion-year-old structure in some places.”
Parts of Australia are built from these ancient cratons, and they are the source of much of our mineral wealth, including the vast iron ore deposits in Western Australia.
Professor Moresi says the heat pipe theory explains how these rocks originally formed, but not why they are so strong.
Thick layers of volcanic rock have been mapped out, supporting the idea that the cratonic crust initially formed through many volcanic eruptions. But Professor Moresi says this process should form thin layers of rock, while cratons are very thick, more than 200 kilometres.
“So they must have formed in a time where they were able to become very thick, and very very strong,” he says.
“The extreme thickness of these ancient cratons was first proposed more than 50 years ago, but no one has been able to solve the mystery of why they are so thick,” says Dr. Beall.
“A few years ago, our colleague on this project, Associate Professor Katie Cooper, came up with a hypothesis that the cratons had thickened as cold mantle rock sunk below.
“An unusually large amount of sinking mantle rock is required and I wondered if this could be triggered by the initiation of plate tectonics, which would have been catastrophic and probably occurred at a similar time to craton formation.”
The researchers tested this idea with the computer model. In the simulations, the cratons are formed during the violent transition from heat-pipe to plate tectonics.
“Our solution is pretty simple,” says Professor Moresi.
“During the transition to plate-tectonics, the Earth goes through this complete overturn. It has stored up a lot of energy for a billion years or so, and then it’s all released in a short period. And you can see in the video that the flat thin rock gets crumpled up into these zones by this very strong, impulsive overturn.
“And that doesn’t repeat, because once plate tectonics starts it’s a different paradigm and you don’t build up that stress again.
“So in one action you create these incredibly strong rocks that then last for billions of years.”
Reference:
A.P. Beall et al. Formation of cratonic lithosphere during the initiation of plate tectonics, Geology (2018). DOI: 10.1130/G39943.1
Aerial photograph of Istanbul. The entire metropolitan area is considered to be particularly earthquake-prone. Credit: G. Kwiatek, GFZ
The metropolitan area of Istanbul with around 15 million inhabitants is considered to be particularly earthquake-prone. In order to be able to assess the risk correctly, researchers must decipher the processes underground. Now, a team including Marco Bohnhoff from the GFZ German Research Center for Geosciences has made new progress. Below the Marmara Sea, they detected earthquakes that were not directly caused by tectonic stresses but by rising natural gas. Their findings are published in the journal Scientific Reports.
The team, led by Louis Geli of the French Research Center Ifremer, analyzed seismic data recorded after a magnitude 5.1 earthquake in the Western part of the Maramara Sea on 25 July 2011. As expected, several aftershocks occurred in the following days and weeks, but they were less severe. “A stronger earthquake changes the stress underground. This results in further shocks—so-called aftershocks—in which the stress changes are then compensated again,” explains Bohnhoff. This happened in the summer of 2011 below the Marmara Sea near Istanbul. It was striking, however, that only a few aftershocks occurred in the crystalline basement where the main earthquake had its origin. “Instead, we recorded a lot of tremors at very shallow depths below the seafloor,” says Bohnhoff, who was involved in the localization and analysis of the shallow quakes. “This was quite surprising, because these layers consist of soft sediment that typically deforms aseismically under tectonic stress and does not make abrupt movements typical for earthquakes.”
In fact, there is another underlying mechanism, as the authors explain: The M5.1 earthquake disrupted the stress field such that a natural gas reservoir in close proximity to the tectonic disturbance is under increased pressure. As a result, gas escaped and moved upward, triggering weaker earthquakes. “Different processes come into question. Small shear fractures may have been activated, or the outgassing may have caused oscillations of water-filled cavities, a process also known from volcanoes or gas leaks. “The exact processes taking place below the bottom of the Maramara Sea cannot be resolved from the available data,” says the geophysicist. This requires seismometers, which are installed even closer to the source location, for example in boreholes.
Bohnhoff and his colleagues from GFZ and other international partner institutes have set up this instrumentation further east, in the greater Istanbul area, as part of the GONAF observatory (Geophysical Observatory at the North Anatolian Fault). The devices are designed to detect the ongoing deformation of the tectonic plates, tensions in the Earth’s crust and vibrations very accurately, and thus ultimately allow for a more realistic risk analysis for the upcoming strong earthquake at the gates of the mega-city. There is a 35 to 70 percent probability of a magnitude 7 or larger earthquake by the year 2040.
“The seismic hazard and risk for the metropolitan region of Istanbul does not necessarily change as a result of the new findings. But they must be included in various earthquake scenarios to make them more realistic,” says Bohnhoff. “In this way, we also highlight an aspect hitherto completely ignored by the public, i.e. that the spatial proximity of the North Anatolian Fault Zone and the gas deposit poses an additional hazard potential.” Due to the deposit large gas tanks are located at a short distance on land. In the case of a strong earthquake, there is an increased risk of explosion or gas leaks. Bohnhoff says, “Such hazards increase the risk to the population of being damaged as a result of an earthquake.”
Reference:
L. Géli et al, Gas and seismicity within the Istanbul seismic gap, Scientific Reports (2018). DOI: 10.1038/s41598-018-23536-7
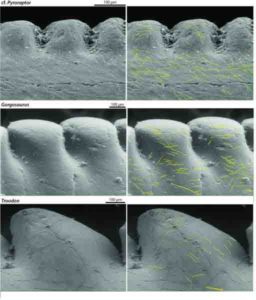
This figure shows microwear patterns on the teeth of three theropods. Credit: Angelica Torices and Victoria Arbour/Current Biology
Predatory, bird-like theropod dinosaurs from the Upper Cretaceous (100.5-66 million years ago) of Spain and Canada all relied on a puncture-and-pull bite strategy to kill and consume their prey. But close examination of patterns of wear and modeling of their serrated, blade-like teeth reported in Current Biology on April 26 also suggest that these dinosaurs weren’t necessarily in direct competition for their next meal. Some of them apparently preyed on larger, struggling prey, while others stuck to softer or smaller fare.
“All these dinosaurs were living at the same time and place, so it is important to know if they were competing for food resources or if they were aiming for different prey,” says Angelica Torices of Universidad de La Rioja, Spain. “Through this work we [can] begin to understand the interactions between these predatory dinosaurs in the ecosystem a bit better.
“We find that, in general, predatory coelurosaurian dinosaurs bite in the same way through a puncture-and-pull system, but troodontids and dromaeosaurids may have preferred different prey,” she adds, noting that troodontids apparently favored requiring lower bite forces in comparison to dromeosaurs. Coelurosaurians include a group of theropod dinosaurs more closely related to birds than to other dinosaurs, including the allosaurs.
Torices has always had an interest in the teeth of carnivorous dinosaurs. At first, her goal was to match tooth remains to the dinosaur species they had come from. Over time, she grew curious about how various dinosaur species used their teeth, how that related to specific tooth shapes and sizes, and what she might learn about dinosaurs’ lives based on that.
Torices first examined the microwear, or patterns of small scratches on the teeth, to see whether she could establish any pattern in the way various dinosaurs were eating. She, along with colleagues including Ryan Wilkinson from the University of Alberta, Canada, also used a modeling approach called finite elements analysis, commonly used to solve problems in engineering and mathematical physics, to explore how the dinosaurs’ teeth most likely behaved at different cutting angles.
Both approaches led to the same general conclusion, she says. All of the dinosaurs studied employed a puncture-and-pull feeding movement, in which parallel scratches form while they bite down into prey, followed by oblique scratches as the head is pulled backwards with the jaws closed, the researchers report. However, they found, the different tooth shapes performed differently under a variety of simulated biting angles.
The evidence suggests that Dromaeosaurus and Saurornitholestes were well adapted for handling struggling prey or for processing bone as part of their diet. By comparison, Troodon teeth were more likely to fail at awkward bite angles. The findings suggest that troodontids may have preferred softer prey such as invertebrates, smaller prey that required a less powerful bite or could be swallowed whole, or immobile prey such as carrion.
Torices says they are now working to develop more complex models to include teeth along with their roots and jaws to better understand the biting process.
Reference:
Angelica Torices, Ryan Wilkinson, Victoria M. Arbour, Jose Ignacio Ruiz-Omeñaca, Philip J. Currie. Puncture-and-Pull Biomechanics in the Teeth of Predatory Coelurosaurian Dinosaurs. Current Biology, 2018; DOI: 10.1016/j.cub.2018.03.042
Note: The above post is reprinted from materials provided by Cell Press.
A University of Cincinnati geology student is helping NASA determine whether life existed on other planets.
Doctoral candidate Andrew Gangidine is working with UC geology professor Andrew Czaja to develop a marker for ancient bacterial life on Mars. The research could help scientists put to rest one of our most fundamental mysteries.
“We’re trying to answer the question: How rare is life in the universe?” Gangidine said.
Czaja, an assistant professor in UC’s McMicken College of Arts and Sciences, serves on a NASA advisory committee that will decide where on Mars to send the next remote-controlled rover. Among other objectives, the rover will look for evidence that life once existed on the red planet. The advisory committee has narrowed the list of landing-site candidates to three and will recommend a finalist later this year.
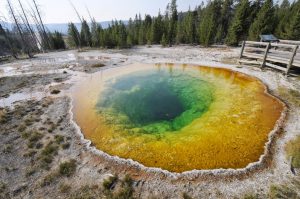
Meanwhile, Gangidine is studying microbial life in silica hot springs to come up with a useful indicator of life on Mars. For the past two years, he has conducted fieldwork in the geyser basins of Wyoming’s Yellowstone National Park to examine what elements are associated with bacteria that live in these geothermal pools.
“We want to remain objective. Some people think there has to be life on Mars,” Gangidine said. “Others think there certainly isn’t life on Mars. And either side has a good chance of being correct. Both have valid arguments. Which is why if we go there and don’t see anything, it won’t be ‘mission fail.'”
Gangidine presented his research April 25 at the Second International Mars Sample Return conference in Berlin, Germany.
Today, we know that life cannot exist on Mars, at least not on its dry surface. Solar radiation split most of its surface water into its elemental parts nearly 3 billion years ago when the red planet lost its protective magnetic field.
But scientists are debating whether life might exist somewhere deep underground, among pockets of water trapped around geothermal areas similar to Yellowstone’s geysers.
Finding evidence of life on Mars is surprisingly complicated.
If Mars ever sustained life, it’s possible that it was wiped out when most of its atmosphere vanished in the solar wind, Czaja said.
So NASA scientists must be prepared to look for fossil evidence of bacterial life dating back that far. Gangidine said the good news is that similar fossils of early bacterial life more than 3.5 billion years ago have been found on Earth. This makes him optimistic that if similar life ever existed on Mars, NASA has a chance of finding a fossil record of it.
“We can look at life being preserved in these silica deposits today. We have evidence of this happening throughout geologic time,” Gangidine said. “What we’re trying to do is catch fossilization as it happens. What happens to the microbes themselves? And what happens to the trace elements we think are associated with them while they’re alive?”
To unearth clues about ancient life on Mars, geologists look to hot springs such as those found in America’s first national park.
Gangidine and his colleagues need permits to collect samples in the park’s backcountry. But exploring the geyser basins can be tricky and dangerous. A tourist died in 2017 after falling into one of the basin’s boiling pools while hiking off-trail.
“These things really can strip the flesh off your bones,” Gangidine said. “At the bottom of hot springs we study you see skulls of bison and other animals that were unfortunate enough to wander too close.”
Gangidine’s team includes an experienced backcountry field researcher, UC postdoctoral fellow Jeff Havig who is now with the University of Minnesota. They pick their way carefully across the caldera. Sometimes, they can see where a bison’s hoof has broken through the thin crust to reveal steaming mud.
The geology work takes them across “quaking bogs,” a thin layer of peat and grass covering deep shifting mud. Gangidine was walking alongside a colleague on one such hike when he sank above his knees in the treacherous mire.
“Luckily, that place wasn’t super hot. But I was walking just a foot away from someone else. The ground can really change quickly,” he said. “When we go into these settings, we have to be very careful.”
Boiling acid and lava-like mud aren’t the only hazards for researchers in the geyser basins. They also have to be careful not to spend too long around the steam vents, which contain a mix of gases such as carbon dioxide, hydrogen sulfide and methane that can asphyxiate a person under the right conditions.
The U.S. Geological Survey documented this phenomenon in 1888 in part of the park nicknamed “Death Gulch,” a natural depression between two steep hills where toxic gases bubble up from Cache Creek. Harvard University geologist T.A. Jaggar Jr. returned to the area in 1899 and found six bears, an elk and various small animals that died apparently after succumbing to the toxic fumes.
But even in the fresh air, the gas rising from the ground can have a cumulative effect, Gangidine said.
“These hot springs emit a lot of gases you don’t want to breathe in. They bind to the hemoglobin that carries oxygen through your body. Breathing that in, you get very fatigued,” Gangidine said.
“That’s why we try to schedule a day out of the field for every three days we work in the field. If you’re there for four days, you can really feel like a zombie. It’s really hard to think, hard to move.”
As a biology undergraduate at UC, Gangidine worked with UC biology professor Dennis Grogan to examine microbial life called extremophiles that live in hostile places such as Yellowstone’s acidic or alkaline hot springs. Now as a geologist, Gangidine is studying the fossils these hardy single-celled creatures leave behind.
“Hot springs make silica deposits that preserve life really well,” Gangidine said. “When left exposed on a planet’s surface, it doesn’t crystallize and doesn’t metamorphose. So these samples should be relatively well preserved if we find them.”
In UC professor Czaja’s geology lab, Gangidine peers through a microscope at slides he prepared from chunks of Yellowstone silica he took from a mountainous steam cone geyser.
The bacterial filaments from samples taken at the top of the geyser are full of color. But the older samples, some perhaps thousands of years old, are colorless, even if they hold their shape. So for more clues about this basic form of life, Gangidine subjects the bacterial samples to elemental analysis using a secondary ion mass spectrometer. The analysis renders the elements in vivid color: deep yellows, reds and greens representing chromium or gallium perhaps associated with the bacterial life.
If Gangidine finds a correlation between the concentrations and spatial distributions of particular elements and the bacteria, it might serve as a biosignature that scientists can use to identify past life on Mars.
“The reason we chose gallium is it’s not known to be associated with life. But when we look at the fossilized bacterial samples, we find it, so there must be something going on,” Gangidine said. “Do the bacteria store certain elements preferentially as opposed to what you would find elsewhere in these rocks?”
Gangidine is working with researchers in Australia, home to some of the world’s oldest fossils, some dating back 3.5 billion years.
“If I want to create a biosignature, I have to prove that it persists throughout time,” Gangidine said. “It exists in these relatively younger samples. But does it exist in these ancient samples, too? That will be crucial to figure out.”
Gangidine also plans to build an artificial hot spring in a lab aquarium using similar elements found in geysers. By introducing a super-saturation to the water, the excess silica will precipitate much the same way it does in nature. Then he can add trace chemicals associated with life and study what happens in a miniature world absent of life.
“To prove we found a biosignature, we have to prove the signature doesn’t occur without life,” he said.
“Gallium is the one we were surprised by,” Czaja said. “It is associated with silica near the bacteria but isn’t in the bacteria.”
Like Gangidine, Czaja got his start in the sciences by studying biology before pursuing a career in paleontology.
Czaja’s NASA advisory committee will meet in October to decide where on Mars they would like to send the rover among the three preferred destinations. The rover is tentatively slated for launch in July or August of 2020, arriving on Mars about seven months later.
“NASA tends to like to go new places to push the frontier. Geologists like to go back to the same places over and over to ask new questions,” Czaja said.
The rover will collect samples in sealed containers for shipping back to Earth in a later mission. So it could be many years before geologists such as Czaja and Gangidine know whether their hunches about where best to look for life on Mars were correct.
Helping to frame a question that you may never live to see answered is one of science’s most selfless pursuits, Czaja said.
“One thing I like about these NASA missions is the long-term thinking and planning,” he said. “People working on these projects now may never see the results. But they’re still willing to put in the work because it’s such a fascinating question.”
The Mars 2020 mission will not be a failure if scientists find no evidence of life. Quite the contrary, Gangidine said.
“If we find it, we can say maybe life is not that rare among planets,” Gangidine said. “But if we don’t find life in places that would be the most ideal and best preserved candidates, then maybe life is pretty rare.”
But if NASA does find evidence of life on Mars, that might suggest that sparking life from a primordial soup isn’t so extraordinary after all. And the first question will be how life on Mars compares to life on Earth, Czaja said. Was there a common ancestor?
“Maybe we’re all Martians,” Czaja said.
Any claim about the existence or absence of life on Mars will be subjected to worldwide scrutiny and skepticism. Czaja said researchers must be prepared to provide a wealth of evidence to fortify their findings.
“It’s not nearly enough to find something that looks like a bacterial cell,” Czaja said. “There are nonbiological things that could look like that. But if you have a cascade of traits — this and this and this added together — it’s hard to explain it any other way except for life.”
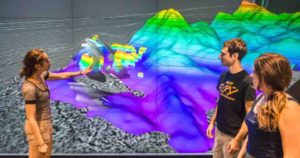
The Galicia group — from left, Rice graduate student Nur Schuba, alumnus Ara Alexanian and graduate research assistant Mari Tesi Sanjurjo — discuss the northwest portion of the 3-D seismic volume at Rice’s Visualization Lab. Credit: Gary Linkevich/Rice University
The first study to spring from a Rice University-led 2013 international expedition to map the sea floor off the coast of Spain has revealed details about the evolution of the fault that separates the continental and oceanic plates.
A paper in Earth and Planetary Science Letters by Rice graduate student Nur Schuba describes the internal structure of a large three-dimensional section of the Galicia, a non-volcanic passive margin between Europe and the Atlantic basin that shows no signs of past volcanic activity and where the crust is remarkably thin.
That thinness made it easier to capture 3-D data for about 525 square miles of the Galicia, the first transition zone in the world so analyzed.
Sophisticated seismic reflection tools towed behind a ship and on the ocean floor enabled the researchers to model the Galicia. Though the rift is buried under several hundreds of meters of powdered rock and invisible to optical instruments, seismic tools fire sound into the formation. The sounds that bounce back tell researchers what kind of rock lies underneath and how it’s configured.
Among the data are the first seismic images of what geologists call the S-reflector, a prominent detachment fault within the continent-ocean transition zone. They believe this fault accommodated slipping along the zone in a way that helped keep the crust thin.
“The S-reflector, which has been studied since the ’70s, is a very low-angle, normal fault, which means the slip happens due to extension,” Schuba said. “What’s interesting is that because it’s at a low angle, it shouldn’t be able to slip. But it did.
“One mechanism people have postulated is called the rolling hinge,” she said. “The assumption is that an initially steep fault slipped over millions of years. Because the continental crust there is so thin, the material underneath it is hot and domed up in the middle. The initially steep fault started rolling and became almost horizontal.
“So with the help of the doming of the material coming from below and also the continuous slip, that’s how it is likely to have happened,” Schuba said.
The large data set also provided clues about interactions between the detachment fault and the serpentinized mantle, the dome of softer rock that presses upward on the fault and lowers friction during slippage. The researchers believe that led the Galicia to evolve differently, weakening faults and allowing for longer durations of activity.
The research is relevant to geologists who study land as well as sea because detachment faults are common above the water, Schuba said. “One of my advisers, (adjunct faculty member) Gary Gray, is jazzed about this because he says you can see these faults in Death Valley and Northern California, but you can’t ever see them fully because the faults keep going underground. You can’t see how deep they go or how the fault zones change or how they’re associated with other faults.
“But a 3-D dataset is like having an MRI,” she said. “We can bisect it any way we want. It makes me happy that this was the first paper to come out of the Galicia data and the fact that we can see things no one else could see before.”
Reference:
C. Nur Schuba, Gary G. Gray, Julia K. Morgan, Dale S. Sawyer, Donna J. Shillington, Tim J. Reston, Jonathan M. Bull, Brian E. Jordan. A low-angle detachment fault revealed: Three-dimensional images of the S-reflector fault zone along the Galicia passive margin. Earth and Planetary Science Letters, 2018; 492: 232 DOI: 10.1016/j.epsl.2018.04.012
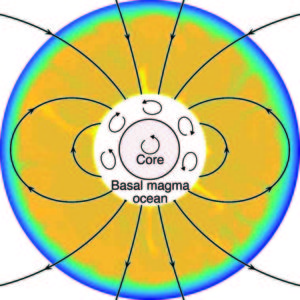
The bottom-most layer of the moon’s mantle melts to form a metal-rich “basal magma ocean” that sits on top of the moon’s metal core. Convection in this layer may have driven a dynamo, creating a magnetic field which would have been recorded at the surface by the cooling lunar crust, including the samples brought back by Apollo astronauts. Credit: Aaron Scheinberg
Around four billion years ago, the Moon had a magnetic field that was about as strong as Earth’s magnetic field is today. How the Moon, with a much smaller core than Earth’s, could have had such a strong magnetic field has been an unsolved problem in the history of the Moon’s evolution.
Scientist Aaron Scheinberg of Princeton, with Krista Soderlund from the University of Texas Institute for Geophysics, and Linda Elkins-Tanton of Arizona State University, set out to determine what may have powered this early lunar magnetic field. Their results and a new model for how this may have happened, have been recently published in Earth and Planetary Science Letters.
A new model
Earth’s magnetic field protects our planet by deflecting most of the solar wind, whose charged particles would otherwise strip away the ozone layer that protects the Earth from harmful ultraviolet radiation.
While Earth’s magnetic field is generated by the motions of its convecting liquid metal outer core, known as the dynamo, the Moon’s core is too small to have produced a magnetic field of that magnitude.
So, the research team proposed a new model for how the magnetic field could have reached Earth-like levels. In this scenario, the dynamo is powered not by the Moon’s small metal core, but by a heavy layer of molten (liquid) rock that sits on top of it.
In this proposed model, the bottom-most layer of the Moon’s mantle melts to form a metal-rich “basal magma ocean” that sits on top of the Moon’s metal core. Convection in this layer then drives the dynamo, creating a magnetic field.
“The idea of a basal magma ocean dynamo had been proposed for the early Earth’s magnetic field, and we realized that this mechanism may also be important for the Moon,” says co-author Soderlund.
Soderlund further explains that a partially molten layer is thought to still exist at the base of the lunar mantle today. “A strong magnetic field is easier to achieve at the Moon’s surface if the dynamo operated in the mantle rather than in the core,” she says, “because magnetic field strength decreases rapidly the farther away it is from the dynamo region.”
In simulations of the core dynamo of the Moon conducted by the team, they kept finding that the lower layer of the Moon’s mantle was overheating and melting. Initially, they tried to focus on cases without melting that were easier to model, but eventually considered that the melting process was the key to their new model.
“Once we started thinking of that melting as a feature, instead of a bug,” says Scheinberg, “the pieces started fitting together and we wondered if the melting that we saw in the models could produce a metal-rich magma ocean to power the strong early field.”
A later weak magnetic field
Further along in the evolution of the Moon (around 3.56 billion years ago), there is also evidence that the strong magnetic field that existed around the Moon eventually became a weak magnetic field, one that continued until relatively recently. The team’s new model may also help explain this phenomenon as well.
“Our model provides an elegant potential solution,” says Scheinberg. “As the Moon cooled, the magma ocean would have solidified, while the core dynamo would have continued to create the later weak field.”
“We’re excited by this result because it explains fundamental observations about the Moon—its early, strong magnetic field and its subsequent weakening and then disappearance—using first-order processes already supported by other observations,” adds co-author Elkins-Tanton.
Beyond providing a new model to build from, this research may also provide a better understanding of planetary magnetic field generation elsewhere in our solar system and beyond.
“Basal magma ocean dynamos, like the one in our model, may well have been a common occurrence in rocky planets like Earth and Mars,” says Scheinberg.
Reference:
Aaron L. Scheinberg et al, A basal magma ocean dynamo to explain the early lunar magnetic field, Earth and Planetary Science Letters (2018). DOI: 10.1016/j.epsl.2018.04.015
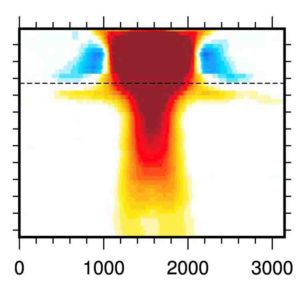
Scientists have now made the best computational modeling yet of mantle plumes, hypothesized, mushroom-shaped upwellings of hot rock from the deep Earth. They plumes are hypothesized to form within the thermal boundary layer at the base of the mantle and are thought to carry heat from Earth’s core that generates a volcano’s magma. Credit: Ross Maguire
Hawaii’s volcanos stand as silent sentinels. They guard the secret of how they formed, thousands of miles away from where the edges of tectonic plates clash and generate magma for most volcanos. A 2017 Nature study by Jones et al. found the best clues yet of the origin of Hawaii’s volcanos through simulation of a shift in the Pacific plate three million years ago. What remains elusive is conclusive evidence that mantle plumes exist.
The plumes are hypothesized, mushroom-shaped upwellings of hot rock from the deep Earth. They are hypothesized to form within the thermal boundary layer at the base of the mantle and are thought to carry heat from the Earth’s core that generates a volcano’s magma. Scientists have now made the best computational modeling yet of mantle plumes, according to a study made available online in January of 2018 ahead of its peer-review and publication November of 2017 in the American Geophysical Union’s Journal of Geophysical Research, Solid Earth.
The international science team showed through supercomputer simulations, for the first time, details of how plumes decelerate seismic waves and how plumes appear in seismic tomographic images of the Earth’s mantle, the layer beneath the crust. What’s more, the researchers say their work could help guide future experiments on the ocean floor with deep Earth imaging and help get to the bottom of mysteries like the origin of Hawaii’s volcanos.
“We found that mantle plumes are likely to be more challenging to seismically image than we previously recognized,” said study lead author Ross Maguire, formerly a PhD student who has recently graduated from the department of Earth and Environmental Sciences at the University of Michigan. “Our current picture of deep mantle plumes might be lacking,” Maguire said, pointing to a lack of seismic data coverage.
Seismic imaging can see rock structures thousands of kilometers below ground by listening to the echos of earthquakes. Networks of seismic stations sit on the ocean floor and measure differences in the travel time of seismic waves through rock, in essence taking a CT scan of the deep Earth.
“In order to constrain the role of mantle plumes in Earth dynamics as well as to understand the causes of hot spot volcanism, we need to focus on increasing the global coverage of seismic sensors, particularly in the oceans, which currently only have sparse coverage,” Maguire said. Oceanic deployments of seismic sensors are costly and tough to plan and execute, he added.
“In our study, we used computer modeling to find optimal imaging scenarios, so that we can recover the most detail of mantle plumes at the lowest cost,” Maguire said. “We hope that our results will help guide the design of future seismic deployments aimed at imaging the mantle beneath hotspots.”
“The thing that is probably new in this work is that we combine, maybe for the first time, actual numerical models of how plumes form and how they rise in the Earth with estimates of their seismic structure ” said study co-author Jeroen Ritsema, a professor in the Department of Earth and Environmental Sciences at the University of Michigan.
“Secondly,” he added, “we’ve also explored how various network configurations might change the way that we are imaging plumes. We’ve done extensive tests to figure out the optimal configurations of seismometers on Earth to see plumes. This is particularly important for Hawaii,” Ritsema said. “Hawaii is a place where we believe there is a plume responsible for volcanism on the Hawaiian islands. We’ve determined what might be optimal offshore deployments on the seafloor that could lead to best images of the deep mantle beneath Hawaii.”
“It is a big computational challenge to simulate wave propagation through mantle plumes,” Maguire said. They needed numerical codes that solve the elastic wave equation in Earth’s mantle at high frequencies and in three dimensions. “What that does is it allows us to accurately account for the effects of wave propagation phenomena such as wave diffraction around plume tails, which is very important for imaging plumes,” Maguire said.
XSEDE, the eXtreme Science and Engineering Discovery Environment, funded by the National Science Foundation, provided computational resources to the science team through access to supercomputers and experts in how to use them best. “We would not be able to do this type of work without supercomputing resources like those that are provided by XSEDE,” Maguire said. “They allowed us to run our wave propagation simulations on hundreds or sometimes thousands of computer cores in parallel.”
The science team tackled the challenges imposed by their modeling requirements and used a seismology software package called SPECFEM 3D (GLOBE), which is a spectral element code developed by Jeroen Tromp of Princeton and his team that simulates wave propagation in the Earth’s interior. They used the Stampede1 supercomputer of the Texas Advanced Computing Center through an XSEDE allocation that ran over 1.2 million core hours on Stampede1 and continues with the Stampede2 system. “We ran that code mostly on Stampede1, and it was actually quite easy to get the code configured on Stampede1, since all the modules and tools we needed to compile it were immediately available,” Maguire said.
The workflow management proved daunting, with many simulations that produced hundreds of gigabytes of data. “The XSEDE team was really helpful in answering all my questions about how I can optimize my workflow, for example how I can spend the least amount of time waiting in the queue for my jobs to run; or how I can efficiently transfer large amounts of from Stampede onto my local machine,” Maguire said.
The researchers also took advantage of the XSEDE Campus Champions program, campus information technology faculty and staff that are trained by and maintain close ties to XSEDE. “XSEDE Campus Champion Brock Palen of the University of Michigan helped us answer questions about what type of resources are available through XSEDE, and how we can get access to them,” Maguire said.
Another useful resource, said Maguire, was access to an allocation on XSEDE Science Gateways through the Computational Infrastructure for Geodynamics with the help of Lorraine Wang. “Science Gateways enabled us to test our code and really figure out how computationally demanding our project would be,” Maguire said.
The researchers used a computationally demanding technique called synthetic tomography, which Maguire explained was essentially a reliability test of how well scientists can trust the accuracy of images of the Earth’s interior. “What we do is we simulate seismic wave propagation through a digital Earth model, which in our case contains a mantle plume,” Maguire said. They do that with virtual seismograms, which are processed like actual seismic data to get an image of recovered plume structure. “It really allows us to test how a mantle plume would be imaged tomographically and how its features would either be blurred or distorted, depending on the imaging configuration,” Maguire said.
“Our study focuses primarily on lower mantle plume tails because it’s really one of the only ways forward in terms of settling the debate on the existence of mantle plumes,” Maguire said. This relates to hotspot volcanism, caused by an anomalously hot mantle away from plate boundaries. Mantle plumes that rise from the core boundary interest geoscientists because they play a role in Earth’s total heat budget by moving heat from the core to the surface.
“Whole mantle plumes, meaning plumes that rise from the core-mantle boundary, are also the most challenging to image seismically because our resolution is very poor in the deep mantle and deep plume conduits are likely to be thin,” Maguire said.
Supercomputers might finally be starting to catch up with long-standing scientific questions and help provoke new questions. “I think that the challenge remains in understanding exactly what we are looking for,” said Ritsema. “In Maguire’s work, we have defined a mantle plume as a purely thermal upwelling in the deep Earth. In this particular case, the plume is a fairly narrow structure—it has a fairly narrow tail, with its complications in imaging. But there has been other work by other groups who have in fact argued that plumes might be much thicker than what we have investigated in our work. The very nature of plumes, whether plumes are purely thermal or temperature-driven, or whether there is also a compositional component to their formation, are issues that are now being addressed in geophysics,” Ritsema said.
The computational demands of simulations in this study of wave propagation limited the number of plume structures, which can be more varied in shape, size, composition, and temperature than the solely thermal plume cases they considered.
“Our study is also the first to model wave propagation through plumes at frequencies as high as one-tenth of a hertz,” Maguire said. “But we’d like to be able to push that even further to go to higher frequencies. And that means that it’s going to be even more of a computational challenge. As the numerical tools that we use become more efficient, and as more high-performance computing clusters become available, that’s something that we might be able to achieve in the future.”
Said Maguire: “Understanding Earth dynamics is of fundamental importance, because we all live here and are affected by what goes on beneath our feet. The existence of mantle plumes and the role that they play in our planet is still a big question mark. Additionally, plumes have been linked to some of the biggest volcanic eruptions in the history of the Earth. And they’re thought to potentially play a role in the largest mass extinction events that we have on geologic record. There’s still a lot that we don’t understand about them. Doing research into probing the nature of mantle plumes is of fundamental importance.”
The study, “Evaluating the Resolution of Deep Mantle Plumes in Teleseismic Traveltime Tomography,” was published in January of 2018 in the American Geophysical Union’s Journal of Geophysical Research: Solid Earth.
Reference:
Ross Maguire et al, Evaluating the Resolution of Deep Mantle Plumes in Teleseismic Traveltime Tomography, Journal of Geophysical Research: Solid Earth (2017). DOI: 10.1002/2017JB014730
Inside the target chamber at the University of Rochester’s Omega Facility, a team of researchers including Princeton University’s Thomas Duffy and June Wicks use lasers to compress iron-silicon samples to the ultrahigh pressures found in the cores of super-Earths. Credit: Laboratory for Laser Energetics
Using high-powered laser beams, researchers have simulated conditions inside a planet three times as large as Earth.
Scientists have identified more than 2,000 of these “super-Earths,” exoplanets that are larger than Earth but smaller than Neptune, the next-largest planet in our solar system. By studying how iron and silicon alloys respond to extraordinary pressures, scientists are gaining new insights into the nature of super-Earths and their cores.
“We now have a technique that allows us to directly access the extreme pressures of the deep interiors of exoplanets and measure important properties,” said Thomas Duffy, a professor of geosciences at Princeton. “Previously, scientists were restricted to either theoretical calculations or long extrapolations of low-pressure data. The ability to perform direct experiments allows us to test theoretical results and provides a much higher degree of confidence in our models for how materials behave under these extreme conditions.”
The work, which resulted in the highest-pressure X-ray diffraction data ever recorded, was led by June Wicks when she was an associate research scholar at Princeton, working with Duffy and colleagues at Lawrence Livermore National Laboratory and the University of Rochester. Their results were published today in the journal Science Advances.
Because super-Earths have no direct analogues in our own solar system, scientists are eager to learn more about their possible structures and compositions, and thereby gain insights into the types of planetary architectures that may exist in our galaxy. But they face two key limitations: we have no direct measurements of our own planetary core from which to extrapolate, and interior pressures in super-Earths can reach more than 10 times the pressure at the center of the Earth, well beyond the range of conventional experimental techniques.
The pressures achieved in this study—up to 1,314 gigapascals (GPa)—are about three times higher than previous experiments, making them more directly useful for modeling the interior structure of large, rocky exoplanets, Duffy said.
“Most high-pressure experiments use diamond anvil cells which rarely reach more than 300 GPa,” or 3 million times the pressure at the surface of the Earth, he said. Pressures in Earth’s core reach up to 360 GPa.
“Our approach is newer, and many people in the community are not as familiar with it yet, but we have shown in this (and past) work that we can routinely reach pressures above 1,000 GPa or more (albeit only for a fraction of a second). Our ability to combine this very high pressure with X-ray diffraction to obtain structural information provides us with a novel tool for exploring planetary interiors,” he said.
The researchers compressed two samples for only a few billionths of a second, just long enough to probe the atomic structure using a pulse of bright X-rays. The resulting diffraction pattern provided information on the density and crystal structure of the iron-silicon alloys, revealing that the crystal structure changed with higher silicon content.
“The method of simultaneous X-ray diffraction and shock experiments is still in its infancy, so it’s exciting to see a ‘real-world application’ for the Earth’s core and beyond,” said Kanani Lee, an associate professor of geology and geophysics at Yale University who was not involved in this research.
This new technique constitutes a “very significant” contribution to the field of exoplanet research, said Diana Valencia, a pioneer in the field and an assistant professor of physics at the University of Toronto-Scarborough, who was not involved in this research. “This is a good study because we are not just extrapolating from low pressures and hoping for the best. This is actually giving us that ‘best,’ giving us that data, and it therefore constrains our models better.”
Wicks and her colleagues directed a short but intense laser beam onto two iron samples: one alloyed with 7 weight-percent silicon, similar to the modeled composition of Earth’s core, and another with 15 weight-percent silicon, a composition that is possible in exoplanetary cores.
A planet’s core exerts control over its magnetic field, thermal evolution and mass-radius relationship, Duffy said. “We know that the Earth’s core is iron alloyed with about 10 percent of a lighter element, and silicon is one of the best candidates for this light element both for Earth and extrasolar planets.”
The researchers found that at ultrahigh pressures, the lower-silicon alloy organized its crystal structure in a hexagonal close-packed structure, while the higher-silicon alloy used body-centered cubic packing. That atomic difference has enormous implications, said Wicks, who is now an assistant professor at Johns Hopkins University.
“Knowledge of the crystal structure is the most fundamental piece of information about the material making up the interior of a planet, as all other physical and chemical properties follow from the crystal structure,” she said.
Wicks and her colleagues also measured the density of the iron-silicon alloys over a range of pressures. They found that at the highest pressures, the iron-silicon alloys reach 17 to 18 grams per cubic centimeter—about 2.5 times as dense as on the surface of Earth, and comparable to the density of gold or platinum at Earth’s surface. They also compared their results to similar studies done on pure iron and discovered that the silicon alloys are less dense than unalloyed iron, even under extreme pressures.
“A pure iron core is not realistic,” said Duffy, “as the process of planetary formation will inevitably lead to the incorporation of significant amounts of lighter elements. Our study is the first to consider these more realistic core compositions.”
The researchers calculated the density and pressure distribution inside super-Earths, taking into account the presence of silicon in the core for the first time. They found that incorporating silicon increases the modeled size of a planetary core but reduces its central pressure.
Future research will investigate how other light elements, such as carbon or sulfur, affect the structure and density of iron at ultrahigh pressure conditions. The researchers also hope to measure other key physical properties of iron alloys, to further constrain models of exoplanets’ interiors.
“For a geologist, the discovery of so many extrasolar planets has opened the door to a new field of exploration,” said Duffy. “We now realize that the varieties of planets that are out there go far beyond the limited examples in our own solar system, and there is a much broader field of pressure, temperature and composition space that must be explored. Understanding the interior structure and composition of these large, rocky bodies is necessary to probe fundamental questions such as the possible existence of plate tectonics, magnetic field generation, their thermal evolution and even whether they are potentially habitable.”
Reference:
“Crystal structure and equation of state of Fe-Si alloys at super-Earth core conditions” Science Advances (2018). DOI: 10.1126/sciadv.aao5864
Representative Image: Hot magma blows up into the water before settling to the seafloor. Foreground: Jason remotely-operated vehicle with sampling hoses. Image is about 6-10 feet across in an eruptive area about 100 yards that runs along the summit. Credit: NOAA and NSF
Japanese researchers have mapped vast reserves of rare earth elements in deep-sea mud, enough to feed global demand on a “semi-infinite basis,” according to a fresh study.
The deposit, found within Japan’s exclusive economic waters, contains more than 16 million tons of the elements needed to build high-tech products from mobile phones to electric vehicles, according to the study, released Tuesday in the journal Scientific Reports.
The team, comprised of several universities, businesses and government institutions, surveyed the western Pacific Ocean near Minamitorishima Island, Japan.
In a sample area of the mineral-rich region, the team’s survey estimated 1.2 million tons of “rare earth oxide” deposited there, said the study, conducted jointly by Yutaro Takaya, researcher with Waseda University and Yasuhiro Kato of the University of Tokyo, among others.
The finding extrapolates that a 2,500-square kilometre region off the southern Japanese island should contain 16 million tons of the valuable elements, and “has the potential to supply these metals on a semi-infinite basis to the world,” the study said.
The area reserves offer “great potential as ore deposits for some of the most critically important elements in modern society,” it said.
The report said there were hundreds of years of reserves of most of the rare earths in the area surveyed.
The team has also developed an efficient method to separate valuable elements from others in the mud.
The world relies heavily on China for rare earths, with Beijing producing most of the elements currently available on the market.
But Beijing has severely restricted exports of these products at times of diplomatic tension.
In 2010, for example, Japanese manufacturers faced serious supply shortages as China limited the valuable exports.
That came after Japan arrested the captain of a Chinese trawler that was involved in a run-in with Japanese coastguards near the disputed Senkaku Islands, claimed by China as the Diaoyus.
The Japanese study stressed the importance of the efforts to develop efficient and economic methods to collect the deep-sea mud.
“The enormous resource amount and the effectiveness of the mineral processing are strong indicators that this new (rare-earth rich mud) resource could be exploited in the near future,” the study said.
Reference:
Yutaro Takaya et al. The tremendous potential of deep-sea mud as a source of rare-earth elements, Scientific Reports (2018). DOI: 10.1038/s41598-018-23948-5
Note: The above post is reprinted from materials provided by AFP.
Microbes in a sub-seafloor aquifer feast on carbon in fluids flowing through the permeable rock. Credit: National Science Foundation
Just about all life on Earth — from the jumbo-jet-sized blue whale to tiny microbes — use carbon in one form or another.
In the deep ocean, though, all carbon is not created equal.
While some, like sugars and proteins, is quickly gobbled up by the micro-organisms that call the ocean home, some — the chitin found in fish scales and marine exoskeletons — is far harder to consume. Scientists have long believed relatively little of that so-called “refractory carbon” is eaten. Much of it simply falls to the ocean floor and helps make up deep-water sediment, although some small refractory molecules stay suspended in the ocean and float along with currents for thousands of years.
But a team of researchers, led by Professor of Organismic and Evolutionary Biology Peter Girguis and Suni Shah Walter, then a post-doctoral fellow in Girguis’ lab, has shown that underground aquifers along the mid-ocean ridge act like natural biological reactors, pulling in cold, oxygenated seawater, and allowing microbes to break down more — perhaps much more — refractory carbon than scientists ever believed. The study is described in an April 23 paper published in Nature Geoscience.
“This has the real prospect of reshaping the way we think about carbon cycling in the deep ocean,” Girguis said. “Instead of setting up a tiny reactor here in the lab with maybe ten liters of water and pumping it around to get some result, this is a natural lab.
“At the end of the day our community wants to know what happens to carbon,” he continued. “We know it is produced at the surface by photosynthetic algae. We know fish eat some of it. We know some of it sinks. We can account for that, but we have some giant holes in our budget.”
While the study begins to close those gaps, it also helps illuminate a part of the deep-ocean carbon cycle that had been a mystery.
“We don’t know where all of that old carbon goes, and underground aquifers are part of the answer,” Shah Walter added. “The majority of fluids that circulate through the crust might look like this, we just didn’t know much about what was going on in them before.”
“This work shows that the vast subseafloor community of microbes could be fed by seawater circulating through deep ocean crust,” said Michael Sieracki, program director in the National Science Foundation’s Division of Ocean Sciences, which funded the research. “In turn, these microbes change the composition of the seawater that then circulates back into the ocean.”
At the heart of the system, Girguis said, is the mid-ocean ridge, a massive chain of undersea mountains that circle the globe.
A key part in the development of the theory of tectonics, in the deep ocean the ridge system acts like a convection cell — water seeps into cracks and fissures on either side of the ridge and is heated as it gets closer to the axis, where magma is close to the surface. As that heated water rises, cold, oxygenated seawater is pulled into the rocks, creating a massive undersea aquifer.
For scientists — like Girguis — working to understand ocean carbon cycles, the aquifer represents a rare chance to study the ocean under virtually ideal conditions.
“Our understanding of where carbon goes in the ocean is pretty rudimentary,” he said. “This gives us an opportunity to go to this natural laboratory and for the first time…take a measurement at point A and a measurement at point B and talk about what happens between them. That’s a rare opportunity in the deep sea. There is nowhere in the deep ocean that we can do that in the water column — it’s impossible because it’s too well-mixed.”
To get those measurements, Girguis and colleagues targeted a site in the mid-Atlantic they dubbed the “North Pond.”
In 2011, an international team of researchers drilled a series of wells into the seafloor at the site and collected water samples to identify which microbes call the aquifer home and whether they were capable of consuming carbon.
“We wanted to tap into this and collect pristine water and microbial samples,” he said. “When you look at these mid-ocean ridge systems and think about the water that is circulating through them, it looks as though a lot of the ocean is circulating through this cold, oxic environment…we wanted to know what’s going on there with the microbes and what’s happening with the carbon they get.”
“Why do we care?” he continued. “We care about the fate of carbon because the carbon cycle is extremely important, not just for climate change, but for helping us to understand how the oceans work.”
But when the team began collecting samples from the aquifer, Shah Walter said, they were in for a surprise.
“When the team pulled the fluids up from the aquifer, they didn’t expect it to be as similar to seawater as it was,” Shah Walter said. “All the planning was for fluids that looked more like other hydrothermal fluids (which can show high levels of methane and lower levels of oxygen.) They were prepared to measure methane, for example. But at first glance North Pond fluids looked chemically very similar to seawater, so that’s when I got pulled in, because my work has focused on the open ocean. So the fact that this was a unique environment, that we could use this natural incubator, that became clear to us after the samples came up.”
While Girguis and colleagues were able to show microbes in the aquifer could eat carbon, it remained unclear how active they were.
“With the limited data we have, we have been able to show that water comes in with a certain oxygen concentration, and as it drops, the carbon goes down in direct proportion,” he said. “That gives us a high degree of confidence that microbes are eating it and using oxygen.”
In fact, Girguis said, it’s possible that microbes are eating carbon at an impressive rate.
“The number we found was that about 50 percent of the carbon is consumed, but it’s important to realize that number is very conservative,” he said. “If you consider how little we know about this system…it begs the question of what happens to this water as it continues to flow through here. It’s not hard to imagine that we might eventually find that the majority of the carbon being eaten.”
In later tests, Girguis and colleagues showed as water moves through the aquifer over nearly 3,000 years, the easy-to-eat carbon is consumed quickly — within just a few hundred years. More importantly, they also found signs that refractory carbon was also being eaten.
“What’s exciting is that for a long time — and even today — there have been debates about how quickly (refractory carbon) can be eaten,” Girguis said. “But this natural laboratory has showed us that not only is this being degraded biologically, but the time over which it’s being eaten.”
Ultimately, Girguis said, the study highlights the way in which understanding the deep ocean can lead to a better overall understanding of the ocean.
“We think that the entire ocean circulates through this mid-ocean ridge system every 100,000 to 200,000 years,” Girguis said. “If the entire ocean is circulating through this aquifer, we think this is probably the best representation of a typical microbial-seawater interaction as it moves through that system.
“Until we had these data there was a big gap in our knowledge,” he added. “We thought water gets pulled in here, and all the action happens when it gets hot. But we don’t think that’s true anymore, especially because these microbes are eating this difficult-to-eat carbon.”
Going forward, Girguis and colleagues hope to better quantify how much carbon is consumed as seawater moves through the aquifer, and whether the minerals in the basalt rock may contribute to microbe’s ability to consume refractory carbon.
Ongoing studies, Shah Walter said, are testing the aquifer in other locations, and to test whether microbes are also consuming particulate matter in the aquifer.
“The majority of fluid that circulates through the crust is cool like this, and so far this is the only place we’re looking at, so we definitely need to look in other spots,” she said. “But there is also still a hole in our carbon budget. We have an idea that one missing piece of the puzzle is that we weren’t looking at the particles in the water. We think we can close this hole by accounting for the carbon metabolism that’s happening on those particles.”
“This started with the intent of saying…let’s figure out what the microbes are doing in this cold, oxygenated aquifer, and we can add those data to our understanding of the carbon cycle,” Girguis said. “But in looking at the data, we were rather astonished by the results, which tell us that, not surprisingly, this easy-to-eat carbon is consumed first, but then we began to see signs of the consumption of this refractory carbon.
“That is a big deal,” he added. “One way to think about this is that all creatures depend on carbon, and there’s this cycle where carbon is produced and consumed…but studying that in the water column is impractical. But take that water and pump it through an underground, oxygenated aquifer and you suddenly have an opportunity to take a closer look at these processes.”
This research was supported with funding from the German Science Foundation, the National Science Foundation, the WHOI Postdoctoral Scholar Program and the NSF Cooperative Agreement for the Operation of a NOSAMS Facility, The Center for Dark Energy Biosphere Investigations and The Gordon and Betty Moore Foundation.
Reference:
Sunita R. Shah Walter, Ulrike Jaekel, Helena Osterholz, Andrew T. Fisher, Julie A. Huber, Ann Pearson, Thorsten Dittmar, Peter R. Girguis. Microbial decomposition of marine dissolved organic matter in cool oceanic crust. Nature Geoscience, 2018; DOI: 10.1038/s41561-018-0109-5
Note: The above post is reprinted from materials provided by Harvard University.